Abstract
We have studied the relationship between diacylglycerol kinase delta (DGKδ) and lipogenesis. There is a marked increase in the expression of DGKδ during the differentiation of 3T3-L1 cells to adipocytes, as well as in the synthesis of neutral and polar lipids. When 3T3-L1 undifferentiated fibroblasts are transfected to express DGKδ there is increased triglyceride synthesis without differentiation to adipocytes. Hence, expression of DGKδ promotes lipogenesis. Lipid synthesis is decreased in DGKδ knockout mouse embryo fibroblasts, especially for lipids with shorter acyl chains and limited unsaturation. This reduction occurs for both neutral and polar lipids. These findings suggest reduced de novo lipid synthesis. This is confirmed by measuring the incorporation of glycerol into polar and neutral lipids that is higher in the wild type cells than in the DGKδ knockouts. In comparison, there was no change in lipid synthesis in DGKε knockout mouse embryo fibroblasts. We also demonstrate that the DGKδ knockout cells had a lower expression of acetyl-CoA carboxylase and fatty acid synthase as well as a lower degree of activation by phosphorylation of ATP citrate lyase. These three enzymes are involved in the synthesis of long chain fatty acids. Our results demonstrate that DGKδ markedly increases lipid synthesis, at least in part as a result of promoting the de novo synthesis of fatty acids.
INTRODUCTION
Diacylglycerol kinases (DGK) catalyze the phosphorylation of 1,2-diacyl-sn-glycerol (DAG) to phosphatidic acid (PtdOH). There are ten mammalian isoforms of DGK each of which fulfills distinct roles in the organism (1). Mice with individual DGK isoforms knocked out have been made. Each genotype results in a different phenotype, but one isoform, DGKδ, is unique in producing knock-out (KO) mice that do not survive long after birth. The reasons for this critical biological role and the downstream consequences of DGKδ signaling are not known. In the present manuscript we demonstrate that DGKδ promotes the synthesis of many species of polar and non-polar lipids, at least in part through promotion of fatty acid synthesis.
The studies below demonstrate the important role of DGKδ in promoting lipid synthesis, including both neutral and polar lipids, using several diverse systems. One instance in which there is a marked increase in 1,2,3-triacyl-sn-glycerol (TAG) is during differentiation of cells to adipocytes. According to the expressed sequence tags (ESTs) database from the National Center for Biotechnology Information, which we used to approximate the levels of DGK mRNA in a given tissue, DGKε is the only isoform identified in adipose tissue. In the current study we tested the mRNA expression of DGK isoforms in adipocytes isolated from mouse white adipose tissue, as well as in differentiating 3T3-L1 cells, and we showed that at least seven DGK isoforms are expressed in adipocytes, with DGKδ being the predominantly expressed isoform. We found that there is a strong association between the expression of DGKδ and the synthesis of lipids in 3T3-L1 fibroblasts transfected with DGKδ or after being induced to differentiate into adipocytes. In addition, transformed mouse embryo fibroblasts (MEFs) from mice that have a genetic deletion of DGKδ exhibit decreased levels of many phospholipids and neutral lipids compared with wild type (WT) MEFs.
We have also begun to elucidate some of the mechanisms by which DGKδ regulates lipid synthesis. The fact that removal of DGKδ decreases the amount of a variety of polar lipids and of the neutral lipids DAG and TAG, suggests that lipid biosynthesis is affected at an early stage that will result in a lower amount of a variety of end products. The incorporation of glycerol, which is a common moiety in DAG, TAG and all glycerophospholipids, is lower in DGKδ-KO MEFs and that these cells also express less of the fatty acid synthesizing enzymes acetyl-CoA carboxylase (ACC), and fatty acid synthase (FAS). In addition, there is a lower degree of phosphorylation of ATP citrate lyase (ACL) in the DGKδ-KO MEFs. These three enzymes catalyze a series of biochemical reactions resulting in the synthesis of fatty acids from small molecule precursors. Thus, a major downstream consequence of DGKδ signaling is the promotion of lipid synthesis.
EXPERIMENTAL PROCEDURES
Cell culture of mouse embryonic fibroblasts
Mouse fibroblasts were obtained from embryos of mice that were made deficient in DGKδ and are designated as DGKδ-KO mouse embryonic fibroblasts (MEFs) (2). In each experiment, these cells were compared with wild-type MEFs obtained from siblings of the (−/−) mice. These cells, derived from DGKδ (+/+) embryos, are designated as DGKδ WT MEFs. All MEFs were immortalized by transfection with the SV40 large T antigen. Cells were cultured in Dulbecco’s Modified Eagle’s Medium (DMEM) supplemented with 10% fetal bovine serum, 25 mM HEPES, at 37 °C in a humidified atmosphere with 5% CO2.
Differentiation of 3T3-L1 cells
3T3-L1 pre-adipocytes (Zen-bio) were cultured in DMEM, 10% calf serum and 1% penicillin/streptomycin at 37°C in a 5% CO2 atmosphere. For adipogenesis, 2 days after cells reached 100% confluency (day 0) they were treated with 3T3-L1 Differentiation Medium (Zen-bio). The medium was replaced with Adipocyte Maintaining Medium (Zen-bio) at day 3 post differentiation. 3T3-L1 pre-adipocytes were only differentiated and used prior to passage 10; greater than 90% of cells displayed the fully differentiated phenotype, characterized by lipid accumulation, by day 12 post differentiation. Lipid accumulation in adipocytes was visualized by staining with Oil Red-O (3).
Transfection of 3T3-L1 preadipocytes with DGKδ1 and/or DGKδ2
There are two splice variants of DGKδ, giving rise to the two proteins, DGKδ1 and DGKδ2 (4). 3T3-L1 pre-adipocytes were cultured in a monolayer to about 80% confluence and on day 0 transfected with a p3XFLAG-DGKδ isoform or an empty vector under a CMV promoter (p3XFLAG-CMV7.1 backbone) using Lipofectamine LTX® with Plus Reagent according to the manufacturer’s protocol (Life Technologies). 3T3-L1 cells were harvested for analysis at day 7 after transfection by scrapping in a solution of PBS containing 1:100 protease inhibitor cocktail for mammalian cell use (Sigma Aldrich). Thereafter, the cells were lysed in buffer A containing 0.25 M sucrose, 10 mM Tris-HCl (pH 7.4), 1 mM ethylenediaminetetraaceticacid (EDTA), 1 mM KCl, 20 mM NaCl and 1:100 protease inhibitor cocktail by passing the cells through a 25 gauge needle 20 times. The cells were centrifuged at 1000 × g for 10 minutes to obtain the nuclear fraction and the supernatant centrifuged at 100,000 × g at 4°C for 1 hour to obtain the membranous fraction in a pellet. The pellet was resuspended in buffer A and both the pellet and supernatant were stored at 80°C. The samples were loaded on a 7.5% sodium dodecyl sulfate (SDS)-polyacrylamide gel (Bio-Rad, Canada) and transferred onto a polyvinylidene fluoride membrane. The presence of FLAG-DGKδ was detected using mouse anti-FLAG M2 antibody (Sigma Aldrich).
Western Blotting for enzymes of lipid metabolism
DGKδ WT and KO MEFs were grown to 70–80% confluency and harvested by scraping in 1X phosphate buffered saline with 1:100 protease inhibitor cocktail for use with mammalian cells and tissue (Sigma Aldrich). Cells were pelleted at low speed (5,000 × g) and resuspended in 250 μL of lysis buffer (20 mM Tris-HCl (pH 7.5), 150 mM NaCl, 5 mM EDTA, 2% NP-40 (Sigma Aldrich), 1/100 protease inhibitor (Sigma Aldrich)), kept for 10 minutes on ice, vortexing every 5 minutes. Lysates were centrifuged at 15,000 × g and supernatants were used for immunoblots. The following primary antibodies were used: 1:250 (v/v) goat anti-actin (Santa Cruz, sc-1616), 1:500 (v/v) rabbit anti-FAS (Santa Cruz, sc-20140), 1:500 (v/v) rabbit anti-ACC (Cell Signaling, #3662S), mouse monoclonal anti-CPT1a (Abcam, ab128568), and rabbit polyclonal anti-ACOT8 (Abcam, ab95004). To measure the expression levels of ACL and phosphorylated-ACL, cells were lysed in buffer A by passing cells through a 25 gauge needle 20 times, centrifuged at 20,800 × g, and supernatants were used for immunoblots. The following primary antibodies were used: 1/1000 (v/v) rabbit anti-ACL (Cell Signaling, #4332S), and 1:1000 (v/v) rabbit anti-phospho-ACL (#4331S). The following secondary antibodies were used: HRP-conjugated antibodies donkey anti-goat (Santa Cruz, sc-2020) or goat anti-rabbit (Santa Cruz, sc-2054) diluted 1:2,000 (v/v). Antibody complexes were visualized using Western Lighting Chemiluminescence Reagent Plus (Perkin-Elmer) and X-Omat LS film (Eastman Kodak Co.) according to manufacturer’s instructions. Densitometry analysis was performed using UN-SCAN IT (Silk Scientific) and statistical analysis was performed using Prism-6 (GraphPad Software).
Animals
Normal wild-type mice were obtained from The Jackson Laboratory (Bar Harbor, ME) at 8 weeks old. All mice used in the study were males, housed in pathogen–free micro-isolators and maintained on a 12-hour light/12-hour dark cycle with lights on at 7:00 A.M. Mice were given standard rodent chow and water ad libitum. Experimental procedures on mice used in this study were approved by the McMaster University Animal Ethics Committee. Fourteen week old mice were fasted overnight, and blood glucose concentration was assessed with a glucometer on whole blood sampled from the tail vein. Mice were anesthetized by intraperitoneal injection with ketamine (150 mg/kg) and xylazine (10 mg/kg), and tissues were rapidly collected and stored in RNAlater® solution (Life Technologies) at −20°C until RNA isolation.
Adipocyte isolation from epididymal white adipose tissue depot
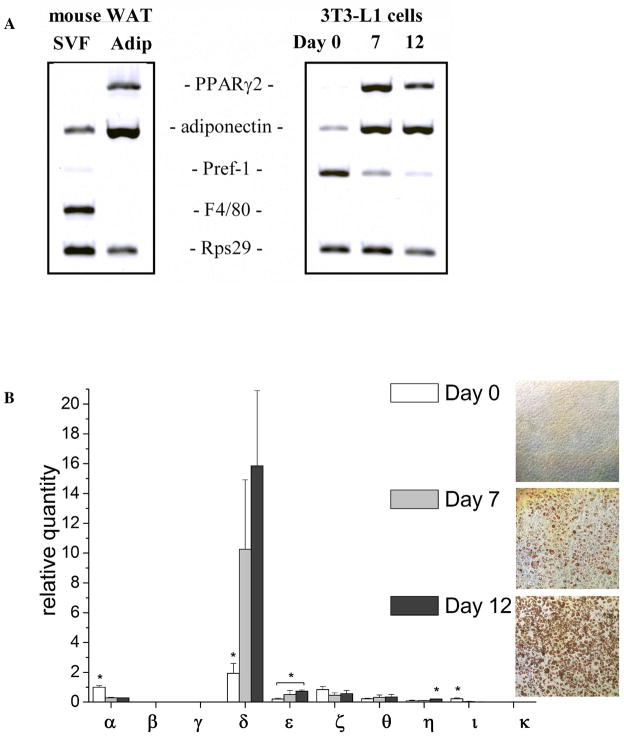
Epididymal fat pads were minced and digested for 35 minutes at 37°C with type I collagenase (1 mg/mL; Worthington) in Adipocyte Wash buffer (120 mM NaCl, 4 mM KH2PO4, 1 mM MgSO4, 1 mM CaCl2, 10 mM NaHCO3, 500 nM adenosine, 30 mM HEPES, 1.5% BSA, pH 7.4). The cell suspension was filtered through 250 μm nylon mesh and centrifuged at 190 × g for 10 minutes to separate floating adipocytes from the stromal-vascular fraction (SVF). The top layer of adipocytes was collected and washed 5 times with Adipocyte Wash buffer. After the final wash, adipocytes were transferred to a T25 flask filled completely with DMEM/F12. The flask was placed bottom side down and incubated 2 hours at 37°C, 5% CO2, to allow the non-adipocyte cells to sediment and attach to the bottom. After incubation, all medium containing adipocytes was transferred to a new 50 mL tube and centrifuged at 190 × g for 5 min. The supernatant beneath the adipocyte layer was removed, and 0.75 mL of TRIzol LS Reagent (Life Technologies) was added per 0.25 mL of adipocytes for the following RNA isolation. The SVF pellet was incubated with Erythrocyte Lysis Buffer (154 mM NH4Cl, 10 mM KHCO3, 0.1 mM EDTA) for 5 min and filtered through a 20 μm mesh to remove endothelial cell clumps. The solution was centrifuged at 500 × g for 5 min, and the resultant SVF pellet was resuspended in TRIzol LS Reagent (Life Technologies) for the following RNA isolation. Adipogenesis markers and markers for pre-adipocytes and macrophages were used to confirm the purity of isolated adipocytes (Fig. 1A and B).
Figure 1.
A. mRNA expression of markers in isolated adipocytes (Adip) and stromal-vascular fraction (SVF) from mouse epididymal white adipose tissue (WAT) depot (left panel) and in3T3-L1 cells during adipocyte differentiation (right panel). Peroxisome proliferator-activated receptor γ2 (PPARγ2) and adiponectin are used as markers onadipogenesis. Pre-adipocyte factor-1 (pref-1) is used as a pre-adipocyte marker, as it exerts negative control of adipogenesis (31). The mouse macrophage F4/80 receptor (F4/80) is used as a specific cell-surface marker for murine macrophages (32). 40S ribosomal protein S29 (Rps29), a house-keeping gene, is used as a reference gene. B. mRNA expression of DGK isoforms in 3T3-L1 cells during differentiation into adipocytes. White bars represent expression levels at day 0 post differentiation, light grey bars – at day 7, and black bars – at day 12 post differentiation. DGK expression is normalized by TATA-box binding protein (TBP) and presented as the quantity relative to the expression of DGK isoform α at day 0 post differentiation. Normalization for another house-keeping gene Rps29 showed similar results. Results are presented as the mean ±S.D. * - values are statistically different with p < 0.05. Panel on the right shows the staining of 3T3-L1 cells with Oil Red O at days 0, 7, and 12 post differentiation.
Total RNA isolation
Total RNA was isolated from 3T3-L1 cells at day 0, 7, and 12 post differentiation using TRIzol reagent with the PureLink™ RNAMini Kit (Life Technologies) according to the manufacturer’s instructions. For RNA preparation from isolated adipocytes and SVF, TRIzol LS Reagent (Life Technologies) was used. For RNA isolation from murine tissues, the tissues were homogenized with 1 mm zirconia/silica beads in 1 mL of TRIzol reagent using the Mini-Beadbeater-1 (Bio Spec Products). On–column PureLink™ DNase treatment (Life Technologies) was performed during RNA purification of all samples to obtain DNA–free total RNA.
Real-time RT-PCR
Total RNA was reverse-transcribed using AccuScript-PfuUltra II RT-PCR Kit (Agilent Technologies) and analyzed via real-time RT-PCR on the Rotorgene 6000 (Corbett Research) using TaqMan Assay-on-Demand gene expression kits (Applied Biosystems) following the manufacturer’s recommendations. qPCR was performed in a 20 μL reaction volume containing 0.5 U of AmpliTaq Gold DNA polymerase (Applied Biosystems, Foster City, CA, USA), 1×PCR Gold buffer, 2.5 mM MgCl2, 0.2 mM dNTP mix, 10 μL of diluted cDNA, 450 nM of primers and 125 nM of TaqMan MGB probes (Applied Biosystems, Foster City, CA, USA). After an initial step for enzyme activation at 95°C for 10 min, 50 cycles were performed consisting of 95°C for 10 sec and 58°C for 45 sec. Relative expression was calculated using the comparative critical threshold (Ct) method (5) and was normalized to TATA-box binding protein. The amplification efficiencies of used TaqMan Gene Expression Assays were tested and confirmed to be 100 ± 10%.
Lipidomics Analysis
Glycerophospholipids from cell pellets of different genotypes, MEF and 3T3-L1 cells, were extracted using a modified Bligh and Dyer procedure (6). Briefly, each pellet was homogenized in 800 μL of ice-cold 0.1 N HCl:CH3OH (1:1) by vortexing for one minute at 4°C. The suspension was then vortexed with 400 μL of cold CHCl3 for one minute at 4°C and the extraction proceeded with centrifugation (5 min, 4°C, 18,000 × g) to separate the two phases. The lower organic layer was collected and the solvent evaporated. The resulting lipid film was dissolved in 100 μL of isopropanol:hexane:100mM NH4COOH(aq) 58:40:2 (mobile phase A). Quantification of glycerophospholipids was achieved by the use of an LC-MS technique employing synthetic odd-carbon diacyl and lysophospholipid standards. Typically, 200 ng of each odd-carbon standard was added per sample. Glycerophospholipids were analyzed on an Applied Biosystems/MDS SCIEX 4000 Q TRAP hybrid triple quadrupole/linear ion trap mass spectrometer (Applied Biosystems, Foster City, CA, USA) and a Shimadzu high pressure liquid chromatography system with a Phenomenex Luna Silica column (2 × 250 mm, 5-μm particle size) using a gradient elution as previously described (7;8). The identification of the individual species, achieved by LC-MS/MS, was based on their chromatographic and mass spectral characteristics. This analysis allows identification of the two fatty acid moieties but does not determine their position on the glycerol backbone (sn-1 versus sn-2). Neutral lipids, DAG and TAG, were extracted by homogenizing cell pellets in the presence of internal standards (200 ng 24:0 DAG and 400 ng 42:0 TAG for MEFs and 500 ng 24:0 DAG and 1 μg 42:0 TAG for the 3T3-L1 cells) in 2 mL 1X PBS and extracting with 2 mL ethyl acetate:trimethylpentane (25:75). After drying the extracts, the lipid film was dissolved in 1 mL hexane:isopropanol (4:1) and passed through a glass Pasteur pipette column plugged with glass wool and packed with a 2 cm bed of Silica gel 60 Å to remove remaining polar phospholipids. Solvent from the collected fractions was evaporated and the lipid film was redissolved in 90 μL 9:1 CH3OH:CHCl3, containing 10 μL of 100 mM CH3COONa for MS analysis essentially as described (9). Statistical analysis was conducted by Student’s t-test.
Triglyceride Quantification Assay
The triglyceride concentration of the cell samples was measured using a triglyceride functional assay kit (Ab65336 Abcam, Canada). The cell samples were lysed and the assay performed according to manufacturer’s protocol.
Determination of de novo phospholipid, DAG, and TAG synthesis in DGKδ-KO cells
The de novo synthesis of glycerophospholipids, DAG and TAG were determined by measuring the incorporation of glycerol into these lipids. WT and DGKδ-KO MEFs were incubated with 4 μCi [1,3-3H]-glycerol/dish for 24 h with modifications indicated below (10). Subsequent to incubation, cells were washed twice with 2 mL of ice-cold PBS. The cells were removed using a rubber policeman into silanized glass tubes with 2 mL of methanol:water (1:1 v/v). The mixture was vortexed, and a 25 μL aliquot was taken for protein determination (11). Appropriate volumes of chloroform, 0.9% NaCl and methanol were added to the tubes in a 4:3:2 (v/v/v) ratio to initiate phase separation. The tubes were vortexed and then centrifuged at 2,000 rpm for 10 minutes (bench top centrifuge), the aqueous phase was removed and 2 mL theoretical upper phase (48 mL methanol, 47 mL 0.9% NaCl, 3 mL chloroform) was added to wash the organic phase. The tubes were vortexed and centrifuged as described above and the aqueous phase removed. The organic phase was dried under a stream of N2 gas and resuspended in 50 μL chloroform. A 20 μL aliquot of organic phase was placed onto a thin-layer plate and 1,2-diacyl-sn-glycerol (DAG) and 1,2,3-triacyl-sn-glycerol (TAG) were separated by thin-layer chromatography (TLC) in a solvent system containing diethyl ether:benzene:absolute ethanol:acetic acid (45:50:2:0.2, v/v/v/v). A 20 μL aliquot of organic phase was placed onto a TLC plate and phospholipids separated by two-dimensional TLC exactly as described (10). The lipids were visualized with iodine vapor and corresponding spots removed into 7-mL scintillation vials. 0.5 mL of water was added, and the vials were sonicated for 5 min to disperse the silica gel. Finally, 5 mL of Ecolite scintillation liquid was added. The radioactivity was determined using a Beckman model LS 3801 Scintillation Counter and compared to internal standards. Data was expressed as dpm/mg protein, n=3 determinations. Student’s t-test was used for statistical analysis. The level of significance was defined as p<0.05.
RESULTS
DGK expression profile during adipocyte differentiation of 3T3-L1 cells
To determine if DGK expression changes during adipocyte differentiation, we performed real-time RT-PCR on RNA samples isolated from 3T3-L1 cells at day 0, 7, and 12 post differentiation. The 3T3-L1 cell line is one of the most reliable and well-characterized models for studying differentiation of fibroblasts to adipocytes (12). In culture, differentiated 3T3-L1 cells exhibit most of the ultrastructural characteristics of adipocytes from animal tissue (13), and when injected into mice, 3T3-L1 cells differentiate and form subcutaneous fat pads that are indistinguishable from normal adipose tissue (14). Differentiation of 3T3-L1 cells into adipocytes was confirmed by Oil Red O staining of accumulated lipid droplets (Fig. 1B, right panel), as well as by measuring the expression levels of adipogenesis markers, such as adiponectin and peroxisome proliferator-activated receptor γ (PPARγ2) whose expression levels were comparable to fully differentiated mouse white adipose tissue (Fig. 1A).
Our results showed that seven DGK isoforms are expressed in 3T3-L1 cells – all except DGKβ, γ, and κ, whose mRNA expression were below detectable levels (Fig. 1B). DGKδ exhibits the highest mRNA expression among DGK isoforms in 3T3-L1 pre-adipocytes, and its expression level increases dramatically during adipocyte differentiation (8-fold increase at day 12 compared to day 0 post differentiation) (Figs. 1B). Expression of two other DGK isoforms, DGKε and DGKη, also increases during differentiation of 3T3-L1 cells, while the expression levels of DGKα and DGKι decrease significantly (See Supporting Information, Fig. S1). DGKζ and DGKθ do not substantially change during adipocyte differentiation.
Changes in lipid amount and composition during adipocyte differentiation of 3T3-L1 cells
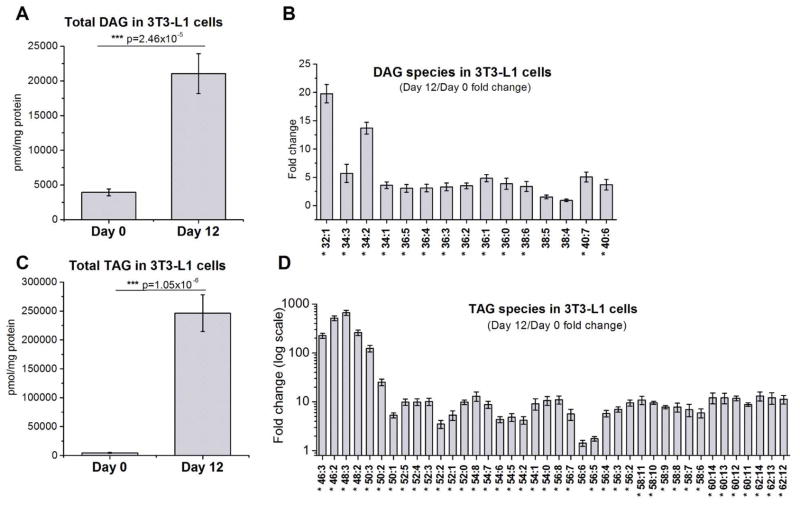
To measure the changes in lipid composition during adipocyte differentiation, we performed a lipidomics analysis of 3T3-L1 cells in undifferentiated (day 0) and differentiated states (day 12) using liquid chromatography–mass spectrometry. Our results showed that total triacylglycerol (TAG) content increased 54-fold during cell differentiation (Fig. 2C), while DAG content increased 5-fold (Fig. 2A). There is a significant shift in acyl chain composition of TAG species during adipocyte differentiation towards TAGs with shorter acyl chains, with 48:3 and 46:2 species (661- and 514-fold increase, respectively) becoming the most abundant (Fig. 2D). There is a similar trend in the changes of DAG acyl chain composition, with the prevalent species in the differentiated 3T3-L1 cells being those with shorter acyl chains, particularly 32:1 and 34:2 DAGs (Fig. 2B).
Figure 2.
Comparison of A, B) DAG and C, D) TAG content of 3T3-L1 cells at day 0 and day 12 post differentiation. Results are presented as the mean ±S.E.M. * - values are statistically different with p < 0.05; *** - p < 0.001; N=9 per group.
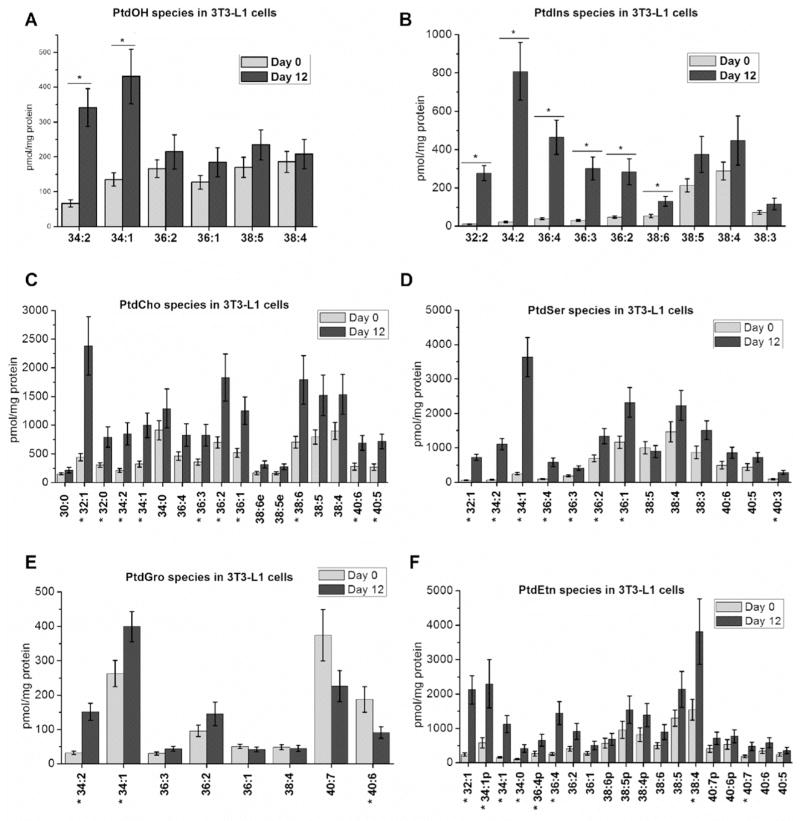
Further, our data showed that the amounts of the major classes of phospholipids increased during differentiation of 3T3-L1 cells to adipocytes (Fig. 3). There is a 2-fold increase in total PtdOH and a 4-fold increase in total phosphatidylinositol (PtdIns) content, with a prominent shift towards species with shorter acyl chains (Fig. 3A and B). A similar trend is observed for other major classes of phospholipids, including phosphatidylcholine (PtdCho), phosphatidylserine (PtdSer), phosphatidylglycerol (PtdGro) and phosphatidylethanolamine (PtdEtn) (Fig. 3C–F). Taken together, our results indicate a significant increase in the amounts of major phospholipid classes with a prevalence of species with shorter acyl chains in the differentiated 3T3-L1 cells.
Figure 3.
Comparison of A) PtdOH; B) PtdIns; C) PtdCho; D) PtdSer; E) PtdGro; and F) PtdEtn content of 3T3-L1 cells at day 0 and day 12 post differentiation. Results are presented as the mean ±S.E.M. * - values are statistically different with p < 0.05; N=9 per group.
Triglyceride content of 3T3-L1 preadipocytes transfected with DGKδ
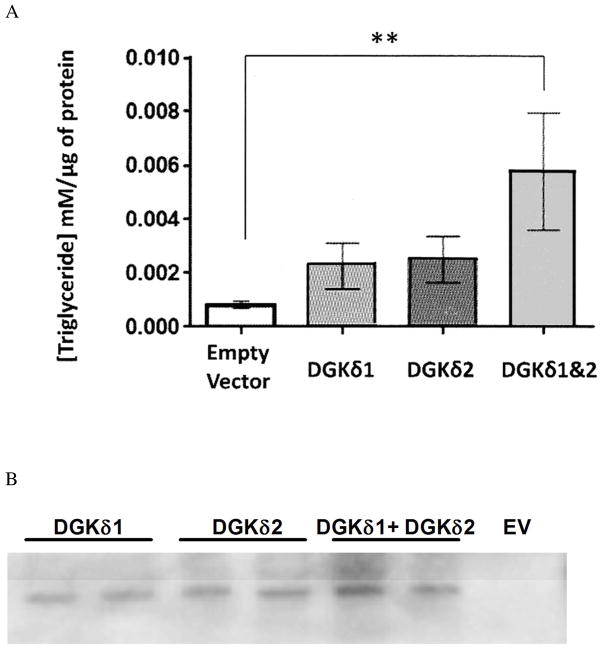
3T3-L1 preadipocytes were transfected with one or both of the forms of DGKδ. TAG concentration was measured and normalized to the total protein content of the cells. The difference in TAG production between DGKδ1 or DGKδ2 expression alone is not statistically significant relative to the vector controls. However, when both isoforms are expressed there is a significant difference in TAG concentration (Fig. 4). There is a larger amount of total DGKδ in the cells transfected with both isoforms, which may contribute to the greater synthesis of TAG in these cells (Fig. 4).
Figure 4.
Triglyceride concentration is increased in 3T3-L1 cells overexpressing DGKδ isoforms. A) 3T3-L1 cells were transiently transfected with p3XFLAG-DGKδ1, p3XFLAG-DGKδ2, both plasmids, or p3XFLAG-CMV7.1 empty vector. On day 7 following the transfections, the triglyceride concentrations were measured as described and normalized to the amount of protein. Bars represent mean ±SEM (**p<0.01; N=5). B) Western Blot showing DGKδ expression detected with anti-FLAG antibodies (EV –p3XFLAG-CMV7.1 empty vector).
3T3-L1 preadipocytes transfected with DGKδ have no evidence of differentiation to adipocytes
To evaluate the adipogenic role of DGKδ, we assayed for the expression of two master transcriptional activators in the adipocyte differentiation pathway, CEBPα and PPARγ. In 3T3-L1 cells overexpressing DGKδ isoforms 1, 2, or both, there were no detectable levels of either CEBPα or PPARγ transcription factors (data not shown). Actin levels were used as loading controls and show similar protein content in all lanes. 3T3-L1 cells which were transfected with CEBPα or PPARγ containing plasmids show a corresponding band at 43 kDa and 54 kDa respectively (data not shown).
DGK mRNA expression profiles in murine tissues and organs
We demonstrated that DGK isoforms have different profiles in different tissues, such as liver, heart, white adipose tissue (WAT), brown adipose tissue (BAT), and gastrocnemius muscle (See Supporting Information, Fig. S2). Our results revealed that DGKδ is the most abundant isoform in murine WAT, BAT, and heart tissues, while in muscle DGKδ and ζ have comparable levels, and in liver tissue DGKζ and θ are more prevalent. These findings demonstrate the diversity of the DGK family and further suggest the individual tissue- and isoform-specific functions for each DGK isoform. With regard to DGKδ, it is by far the most abundant DGK isoform in WAT and BAT and to a lesser extent in heart tissue, although it is also highly expressed in other tissues together with other DGK isoforms.
Comparison of lipid amount and composition of DGKδ KO and WT MEFs
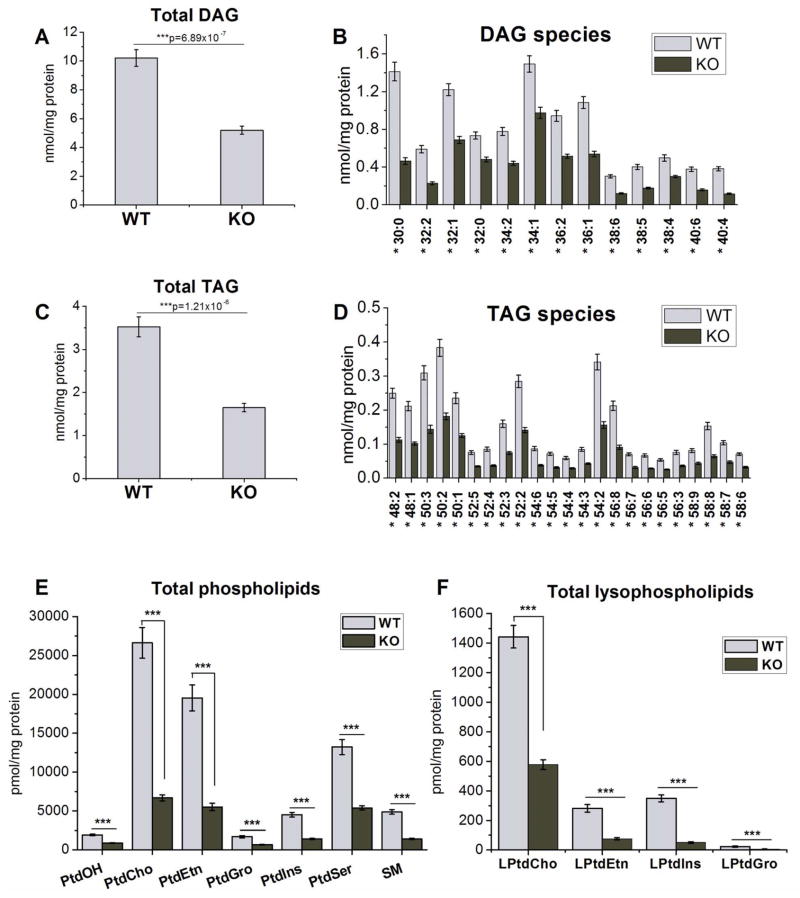
As another approach for testing the relationship between DGKδ and lipid synthesis, we performed a mass spectrometry analysis of lipid extracts from DGKδ-KO and WT MEFs. Our data showed that there is a significant decrease in the lipid content of DGKδ deficient cells (Fig. 5). Thus, DGKδ-KO cells have about half the DAG, TAG, and PtdOH than WT cells (Fig. 5A–E), while PtdCho, PtdEtn, PtdGro, PtdIns, PtdSer, SM (Fig. 5E) and lysophospholipids LPtdCho, LPtdEtn, and LPtdGro (Fig. 5F) are 3–4 times lower, and LPtdIns exhibits a 7-fold decrease (Fig. 5F) upon DGKδ-KO in MEFs.
Figure 5.
Comparison of lipid profiles of DGKδ-KO and WT MEFs. DGKδ-KO cells exhibit significantly lower content of A, B) DAG species; C, D) TAG species; E) total phospholipids: PtdOH, PtdCho, PtdEtn, PtdGro, PtdIns, PtdSer, and SM; and F) total lysophospholipids: LPtdCho, LPtdEtn, LPtdIns, LPtdGro. Results are presented as the mean ±S.E.M. * - values are statistically different with p < 0.05; *** - p < 0.001; N=9 per group.
Comparison of de novo phospholipid, DAG and TAG synthesis in DGKδ-KO and WT MEFs
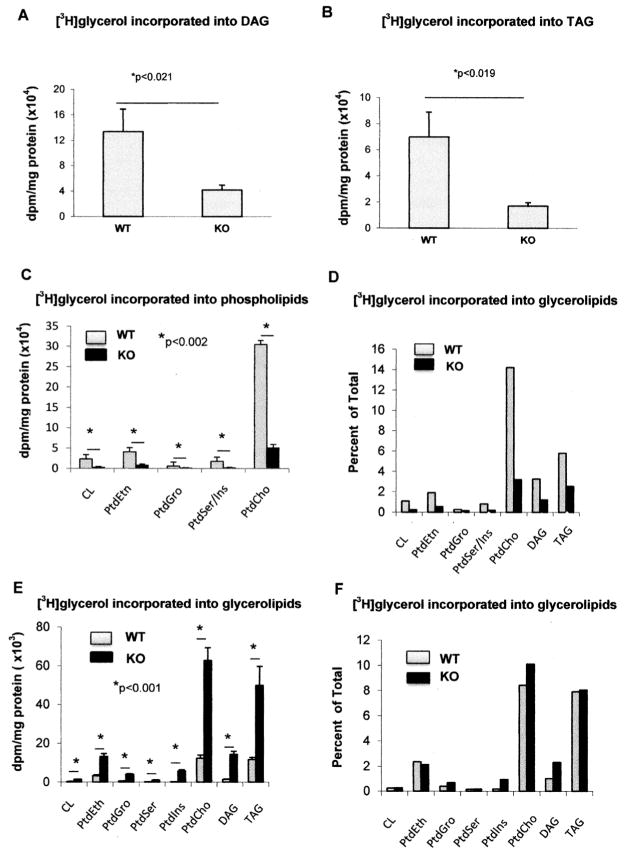
To determine if the reduction in the phospholipid, DAG and TAG mass in DGKδ-KO MEFs was due to reduced de novo synthesis of these lipids, WT and DGKδ-KO MEFs were incubated with [1,3-3H]-glycerol for 24 h and radioactivity incorporated into glycerophospholipids, DAG, and TAG was measured. Incorporation of [1,3-3H]-glycerol into DAG (Fig. 6A), TAG (Fig. 6B) and glycerophospholipids (Fig. 6C) show that there is much less de novo synthesis of these lipids in KO cells compared with WT. The percent of total glycerol incorporated into the various lipid species is shown in Fig. 6D.
Figure 6.
Incorporation of [1,3-3H]-glycerol into DAG, TAG and glycerophospholipids in wild type (WT), DGK± KO and DGKε KO mouse embryonic fibroblasts. Wild type (WT) and DGKδ-KO mouse embryonic fibroblasts (MEFs) were incubated with 4 μCi [1,3-3H]-glycerol/dish for 24 h and radioactivity incorporated into DAG (A), TAG (B), or major glycerophospholipids (C), determined as described in Materials and Methods. The results are also expressed (D) in terms of percent of the total 3H incorporated that is found in each of the lipid species. These results are compared with those obtained from DGKε KO mouse embryonic fibroblasts and their corresponding sibling WT MEFs (E, F). Results are presented as the mean ±SD. * - values are statistically different with level of significance indicated. CL:cardiolipin.
For comparison, we also performed a similar experiment with [1,3-3H]-glycerol incorporation into lipid using knockout of another isoform of DGK, namely DGKε. In contrast with DGKδ, MEF cells lacking DGKε showed increased incorporation of glycerol into various lipid species (Fig. 6E). Interestingly, when expressed as the fraction of glycerol incorporated into the various lipid species, there was no difference between the DGKε-KO and WT MEFs (Fig. 6F). In an earlier study using lipidomics analysis, we showed that there was no change in DAG concentration between DGKε-KO and WT MEFs (15). Several lines of evidence indicate that DGKε is associated with the PtdIns-cycle (1). We suggest that as a consequence of knocking out DGKε, the PtdIns-cycle is slowed, resulting directly or indirectly in less glycerol incorporation into lipid. The results comparing DGKε-KO and WT MEFs clearly show that the decreased lipid synthesis resulting from deletion of DGKδ is specific for that isoform and is not a consequence of eliminating any arbitrary DGK isoform.
Protein expression levels of ACL, ACC, and FAS in DGKδ-KO cells
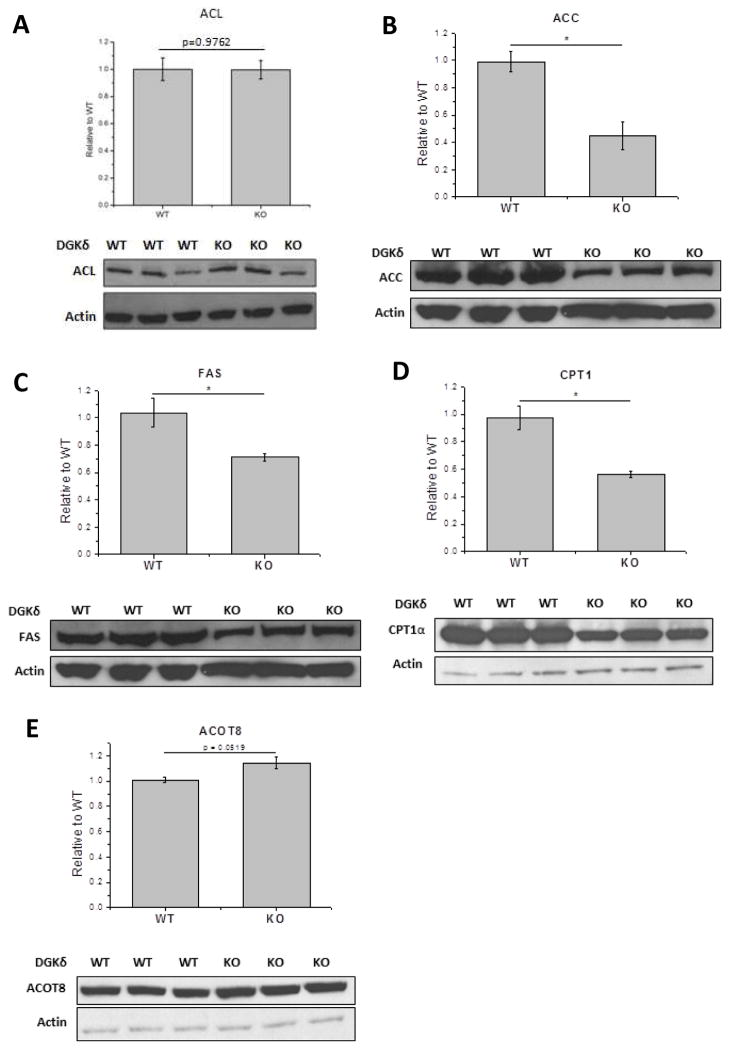
In order to determine the possible mechanism by which lipid content is decreased in DGKδ-KO MEFs, we tested the protein expression of three enzymes involved in fatty acid synthesis. Our results showed that the protein expression of ACL is the same in WT and KO cells (Fig. 7A). However, ACC, and FAS are decreased in DGKδ-KO cells in comparison with WT MEFs (Fig. 7B, and C).
Figure 7.
Protein expression levels of A) ATP citrate lyase (ACL), B) acetyl-CoA carboxylase (ACC), C) fatty acid synthase (FAS), D) carnitine palmitoyltransferase1 (CPT1), and E) acyl-coenzyme A thioesterase 8 (ACOT8)in DGKδ-KO cells compared with DGKδ WT cells. Results are presented as the mean ±S.D. Pairs marked* - values are statistically different with p < 0.05. For ACL (A), p=0.98; for ACOT8 (E), p=0.05.
Protein expression levels of CPT1 and ACOT8 in DGKδ-KO cells
We also monitored the expression of two enzymes important for the oxidation of long chain fatty acids, carnitine palmitoyltransferase1 (CPT1) and acyl-coenzyme A thioesterase 8 (ACOT8). The protein expression of ACOT8 is at least as great in DGKδ-KO cells as in WT cells (Fig. 7E). This and the results from ACL show that not all proteins involved in lipid metabolism decrease in DGKδ-KO cells. However, the expression of another enzyme involved in fatty acid oxidation, CPT1, is decreased in KO cells (Fig. 7D). A lower expression level of this enzyme may be a consequence of less fatty acid being synthesized. In addition, malonyl-CoA, the product of ACC catalysis, is also an inhibitor of CPT1. Since there is less ACC in the DGKδ-KO cells there should be less inhibition of CPT1 and hence a smaller amount of this enzyme could have a higher activity.
Extent of phosphorylation of ACL in DGKδ-KO cells
It is known that ACL is activated by protein kinases. The phosphorylation of ACL was monitored by Western blots using an antibody specific for the activated form of this enzyme, P-ACL. The DGKδ-KO cells have significantly less P-ACL than WT (Fig. 8).
Figure 8.
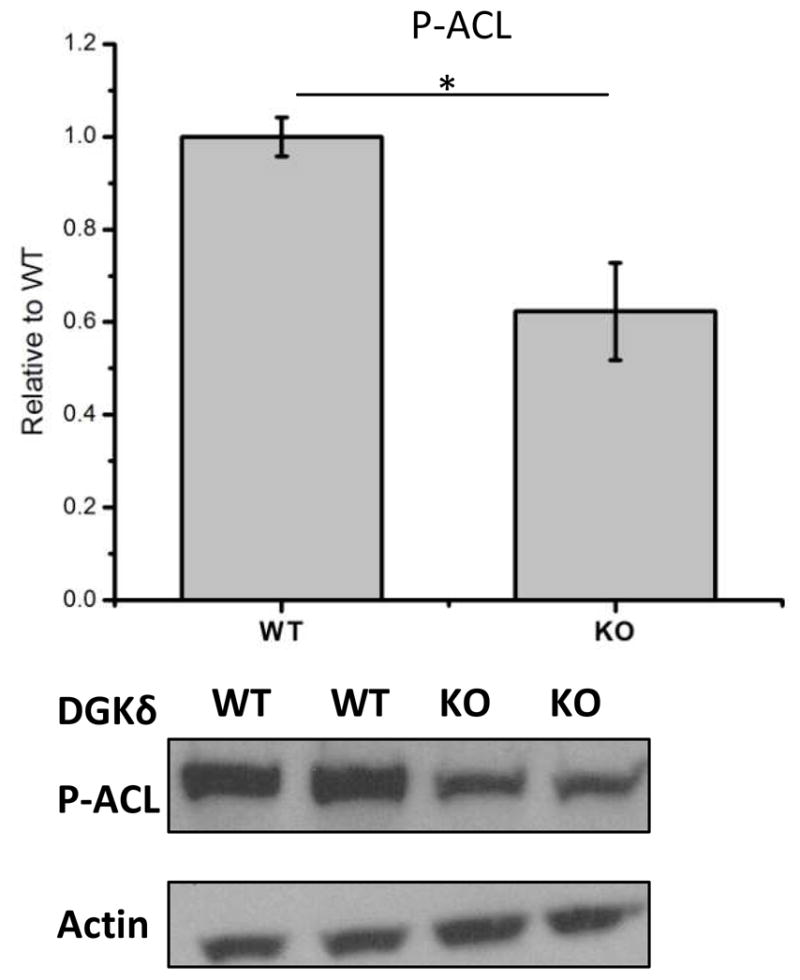
Protein expression levels of phospho-ATP citrate lyase (P-ACL) in DGKδ KO cells in comparison with DGKδ WT cells. Results are presented as the mean ±SD. * - values are statistically different with p < 0.05.
DISCUSSION
DGKδ is among the most widely expressed mammalian DGK isoforms. It is the only known DGK isoform whose deletion results in non-viable offspring (2). A major signaling pathway of DGKδ appears to be through Akt-PI3K (16). However, the major downstream consequences of DGKδ signaling have not been resolved. The present manuscript presents several independent lines of evidence to indicate that DGKδ has a major role in regulating the synthesis of a broad range of lipid species.
We demonstrate that DGKδ becomes by far the most abundant mRNA of any DGK isoform when 3T3-L1 fibroblasts are differentiated to adipocytes (Fig. 1B). The marked increase in DGKδ upon differentiation of 3T3-L1 cells (Fig. 1B and Fig. S1 in Supporting Materials) is in agreement with a recent report (17), but the present results extend the findings to show that DGKδ is the predominant isoform of DGK in adipocytes. The differentiation of 3T3-L1 cells to adipocytes is of course accompanied by a marked increase in TAG, but also in DAG (Fig. 2), as well as PtdOH, PtdIns, and other lipid species (Fig. 3). In an earlier study the only phospholipid measured was PtdOH (17), the product of DGK-catalyzed reactions. The present study shows that the increase in phospholipid synthesis is not limited to PtdOH, but occurs across many phospholipid species. The increased lipid content seen during differentiation to adipocytes is greatest for lipids with shorter acyl chains. The results suggest that de novo lipid synthesis is promoted concomitant with the expression of DGKδ. De novo lipid synthesis favors shorter acyl chains, at least in part, because FAS catalyzes the synthesis of predominantly palmitic acid and longer chains are incorporated with difficulty (18;19). In addition, fatty acids with multiple double bonds are not synthesized in mammalian cells. Since the increase in lipid concentration is observed for several diverse lipid classes, it suggests that there is an increase at an early common stage of lipid synthesis, such as the de novo synthesis of fatty acids. This conclusion is strengthened by a recent report showing that knockdown of DGKδ in differentiating 3T3-L1 cells, also results in a lower level of DAG, TAG, and PtdOH synthesis (17).
In addition to the 3T3-L1 cells, in the present work we also used WT MEF cells and DGKδ-KO MEF cells in order to separate effects of differentiation from effects on lipid synthesis. The correlation between the expression of DGKδ and lipid synthesis is also observed when comparing WT MEF cells with those that have been knocked out for DGKδ. Both TAG and DAG levels and their de novo synthesis are lower for DGKδ-KO cells, as are all of the phospholipid classes measured (Fig. 5). Thus increased DGKδ caused by differentiation of 3T3-L1 cells to adipocytes results in increased lipid synthesis, whereas knocking out DGKδ in MEF cells is accompanied by decreased lipid synthesis.
How about other isoforms of DGK? It is clear that DGKδ shows the largest fold change of expression of any DGK isoform upon differentiation of 3T3-L1 cells (Fig. S1). The next greatest fold-increase occurs with DGKε. We show, however, that DGKε has opposite effects on lipid synthesis to DGKδ (Fig. 6). In addition, lipidomics results comparing WT MEFs to DGKε-KO or DGKα-KO MEFs show that in the former case there is no change in DAG concentration, while in the later case, the DGKα-KO MEFs have a higher level of DAG (15). The expression of DGKα decreases with adipogenesis. In addition, DGKι has a marked reduction in expression with adipogensis (Fig. S1). Its role in adipogenesis is not known. Thus, DGKδ is the only isoform that shows increased expression during adipogensis and also results in increased lipid synthesis.
The mechanism by which DGKδ promotes de novo lipid synthesis is through signal transduction pathways. In this study we have identified several components of that regulation. Two moieties that are common to the structures of glycerophospholipids, TAG, and DAG are fatty acids (linked as acyl chains) and glycerol. Uptake and incorporation of glycerol into cellular lipids is greatly reduced in MEFs with DGKδ deletion (Fig. 6). The expression of two fatty acid synthesizing enzymes, FAS, and ACC is decreased in MEF cells lacking DGKδ (Fig. 7B and C). In addition, the activation of ACL by phosphorylation is also decreased in MEF cells lacking DGKδ (Fig. 8). FAS, ACC and ACL regulate the metabolism of fatty acids – FAS catalyzes the synthesis of long-chain saturated fatty acids from acetyl-CoA and malonyl-CoA, ACC catalyzes the carboxylation of acetyl-CoA to produce malonyl-CoA, and ACL is a cytosolic enzyme catalyzing the synthesis of acetyl-CoA (see Scheme 1).
Scheme 1.
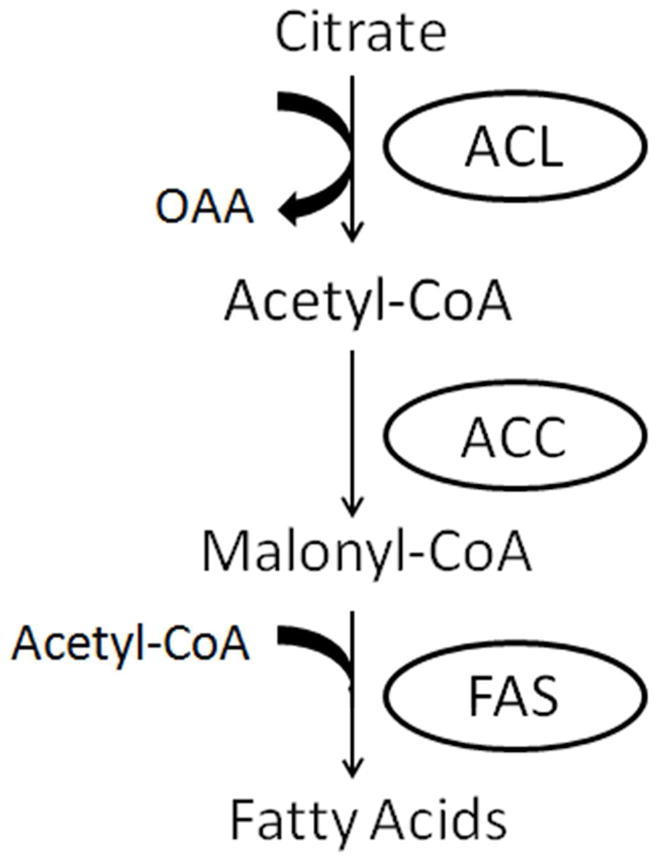
Simplified scheme showing the involvement of ACL, ACC, and FAS in fatty acid synthesis. OAA is oxaloacetic acid.
The enzymes ACC and FAS are transcriptionally regulated by sterol regulatory element binding protein-1c (SREBP-1c) (20) and by carbohydrate response element binding protein (21). ACL expression is also regulated at the transcription level, but by a mechanism other than SREPB-1 (22). It has been suggested that the activity of ACL is regulated by Akt-dependent phosphorylation, rather than at the level of protein expression (23;24). Since DGKδ activates Akt by promoting its phosphorylation (16) it would be anticipated that there is less ACL activity in DGKδ-KO cells. In addition, Akt promotes lipogenesis by stimulating the release of SREBP from the ER and cleavage of SREBP in the Golgi (25). This signal transduction pathway may be related to the observation that DGKδ suppresses ER-to-Golgi traffic (26). We also determined the amount of the phosphorylated form of ACL in these cells. We observed a significant decrease in the amount of phospho-ACL in the DGKδ-KO cells (Figure 8) confirming the lower activity for this enzyme in the DGKδ-KO MEFs. The finding that DGKδ up-regulates the activity of three different enzymes required for fatty acid synthesis implies an overall increase in lipogenesis from a combination of the three steps. In addition, modulating the synthesis at different steps would allow for lipid synthesis to be altered starting from different precursor metabolites.
DGKδ has a profound effect on lipid synthesis, which is required for cell division. In the present work we have shown that DGKδ knockout leads to down-regulation of enzymes responsible for fatty acid synthesis and lowers the amount of many lipid species within the cell. Enhanced synthesis of fatty acids is a fundamental metabolic perturbation in cancer due to up-regulation of key genes for lipid biosynthesis, and cancer cells are sensitive to the inhibition of fatty acid synthesis (27). Blockage of fatty acid synthesis induces ubiquitination and degradation of PI3K (28). Phospholipids are synthesized during the G1- and S-phase of the cell cycle. This synthesis is essential for cell cycle progression and disturbance of this process results in cell cycle arrest and apoptosis (29;30). Given these downstream effects could be impacted by DGKδ activity, we suggest that DGKδ may also be a target for cancer chemotherapy.
Supplementary Material
Acknowledgments
The authors wish to thank Dr. Fred Y. Xu for technical assistance.
Abbreviations
- AAC
acetyl-CoA carboxylase
- ACL
ATP citrate lyase
- ACOT8
acyl-coenzyme A thioesterase 8
- AGPAT2
sn-1-acylglycerol-3-phosphate acyltransferase 2
- BAT
brown adipose tissue
- CPT1
carnitinepalmitoyltransferase 1
- DAG
1,2-diacyl-sn-glycerol
- DGK
diacylglycerol kinase
- DMEM
Dulbecco’s Modified Eagle’s Medium
- FAS
fatty acid synthase
- GPAT3
glycerol-3-phosphate acyltransferase 3
- IRS-1
insulin receptor substrate 1
- KO
knockout
- LPtdCho
lysophosphatidylcholine
- LPtdEtn
lysophosphatidylethanolamine
- LPtdGro
lysophosphatidylglycerol
- LPtdIns
lysophosphatidylinositol
- MEF
mouse embryonic fibroblast
- P-ACL
phospho-ACL
- PtdOH
phosphatidic acid
- PtdCho
phosphatidylcholine
- PtdEtn
phosphatidylethanolamine
- PtdGro
phosphatidylglycerol
- PtdIns
phosphatidylinositol
- PtdSer
phosphatidylserine
- PKC
protein kinase C
- PPARγ2
peroxisome proliferator-activated receptor γ2
- Pref-1
pre-adipocyte factor-1
- Rps29
40S ribosomal protein S29
- SM
sphingomyelin
- SVF
stromal-vascular fraction
- TAG
1,2,3-triacyl-sn-glycerol
- TBP
TATA-box binding protein
- WAT
white adipose tissue
- WT
wild type
Footnotes
This work was partially supported by the Natural Sciences and Engineering Council of Canada, grant 9848 (to RME); NIH Grants PO1-ES013125 and U54 069338 (to HAB); NCI CA095463 (to MKT), the McDonnell Foundation for Brain Cancer Research (to HAB), the Heart and Stroke Foundation of Manitoba (to GMH) and Canadian Institutes of Health Research (to GRS). MDF is a CIHR Banting Postdoctoral Fellow, GRS is a Canada Research Chair in Meolism and Obesity and GMH is a Canada Research Chair in Molecular Cardiolipin Metabolism.
Supporting Information Available: The fold-change in mRNA expression of DGK isoforms in 3T3-L1 cells during adipocyte differentiation is shown as is mRNA expression in various organs of wild-type mice. This material is available free of charge via the Internet at http://pubs.acs.org.
References
- 1.Shulga YV, Topham MK, Epand RM. Regulation and functions of diacylglycerol kinases. Chem Rev. 2011;111:6186–6208. doi: 10.1021/cr1004106. [DOI] [PubMed] [Google Scholar]
- 2.Crotty T, Cai J, Sakane F, Taketomi A, Prescott SM, Topham MK. Diacylglycerol kinase delta regulates protein kinase C and epidermal growth factor receptor signaling. Proc Natl Acad Sci U S A. 2006;103:15485–15490. doi: 10.1073/pnas.0604104103. [DOI] [PMC free article] [PubMed] [Google Scholar]
- 3.Erickson RL, Hemati N, Ross SE, MacDougald OA. p300 coactivates the adipogenic transcription factor CCAAT/enhancer-binding protein alpha. J Biol Chem. 2001;276:16348–16355. doi: 10.1074/jbc.m100128200. [DOI] [PubMed] [Google Scholar]
- 4.Sakane F, Imai S, Yamada K, Murakami T, Tsushima S, Kanoh H. Alternative splicing of the human diacylglycerol kinase delta gene generates two isoforms differing in their expression patterns and in regulatory functions. J Biol Chem. 2002;277:43519–43526. doi: 10.1074/jbc.M206895200. [DOI] [PubMed] [Google Scholar]
- 5.Aarskog NK, Vedeler CA. Real-time quantitative polymerase chain reaction. A new method that detects both the peripheral myelin protein 22 duplication in Charcot-Marie-Tooth type 1A disease and the peripheral myelin protein 22 deletion in hereditary neuropathy with liability to pressure palsies. Hum Genet. 2000;107:494–498. doi: 10.1007/s004390000399. [DOI] [PubMed] [Google Scholar]
- 6.Bligh EG, Dyer WJ. A rapid method of total lipid extraction and purification. Can J Biochem Physiol. 1959;37:911–917. doi: 10.1139/o59-099. [DOI] [PubMed] [Google Scholar]
- 7.Ivanova PT, Milne SB, Byrne MO, Xiang Y, Brown HA. Glycerophospholipid identification and quantitation by electrospray ionization mass spectrometry. Methods Enzymol. 2007;432:21–57. doi: 10.1016/S0076-6879(07)32002-8. [DOI] [PubMed] [Google Scholar]
- 8.Myers DS, Ivanova PT, Milne SB, Brown HA. Quantitative analysis of glycerophospholipids by LC-MS: acquisition, data handling, and interpretation. Biochim Biophys Acta. 2011;1811:748–757. doi: 10.1016/j.bbalip.2011.05.015. [DOI] [PMC free article] [PubMed] [Google Scholar]
- 9.Callender HL, Forrester JS, Ivanova P, Preininger A, Milne S, Brown HA. Quantification of diacylglycerol species from cellular extracts by electrospray ionization mass spectrometry using a linear regression algorithm. Anal Chem. 2007;79:263–272. doi: 10.1021/ac061083q. [DOI] [PubMed] [Google Scholar]
- 10.Hatch GM, McClarty G. Regulation of cardiolipin biosynthesis in H9c2 cardiac myoblasts by cytidine 5′-triphosphate. J Biol Chem. 1996;271:25810–25816. doi: 10.1074/jbc.271.42.25810. [DOI] [PubMed] [Google Scholar]
- 11.Lowry OH, Rosebrough NJ, Farr AL, Randall RJ. Protein measurement with the Folin phenol reagent. J Biol Chem. 1951;193:265–275. [PubMed] [Google Scholar]
- 12.Ntambi JM, Young-Cheul K. Adipocyte differentiation and gene expression. J Nutr. 2000;130:3122S–3126S. doi: 10.1093/jn/130.12.3122S. [DOI] [PubMed] [Google Scholar]
- 13.Novikoff AB, Novikoff PM, Rosen OM, Rubin CS. Organelle relationships in cultured 3T3-L1 preadipocytes. J Cell Biol. 1980;87:180–196. doi: 10.1083/jcb.87.1.180. [DOI] [PMC free article] [PubMed] [Google Scholar]
- 14.Green H, Kehinde O. Formation of normally differentiated subcutaneous fat pads by an established preadipose cell line. J Cell Physiol. 1979;101:169–171. doi: 10.1002/jcp.1041010119. [DOI] [PubMed] [Google Scholar]
- 15.Milne SB, Ivanova PT, Armstrong MD, Myers DS, Lubarda J, Shulga YV, Topham MK, Brown HA, Epand RM. Dramatic differences in the roles in lipid metabolism of two isoforms of diacylglycerol kinase. Biochemistry. 2008;47:9372–9379. doi: 10.1021/bi800492c. [DOI] [PMC free article] [PubMed] [Google Scholar]
- 16.Crotty TM, Nakano T, Stafforini DM, Topham MK. Diacylglycerol Kinase delta Modulates Akt Phosphorylation through Pleckstrin Homology Domain Leucine-rich Repeat Protein Phosphatase 2 (PHLPP2) J Biol Chem. 2013;288:1439–1447. doi: 10.1074/jbc.M112.407379. [DOI] [PMC free article] [PubMed] [Google Scholar]
- 17.Lowe CE, Zhang Q, Dennis RJ, Aubry EM, O’Rahilly S, Wakelam MJ, Rochford JJ. Knockdown of diacylglycerol kinase delta inhibits adipocyte differentiation and alters lipid synthesis. Obesity (Silver Spring) 2013 doi: 10.1002/oby.20297. in press. [DOI] [PMC free article] [PubMed] [Google Scholar]
- 18.Chang SI, Hammes GG. Structure and mechanism of action of a multifunctional enzyme: Fatty acid synthase. Accounts of Chemical Research. 1990;23:363–369. [Google Scholar]
- 19.Rangan VS, Smith S. In: Biochemistry of Lipids. Lipoproteins and Membranes. Vance DE, Vance JE, editors. Vol. 36. 2002. pp. 151–179. Chapter 6 Fatty acid synthesis in eukaryotes. 36, 151–179. [Google Scholar]
- 20.Field FJ, Born E, Murthy S, Mathur SN. Polyunsaturated fatty acids decrease the expression of sterol regulatory element-binding protein–1 in CaCo-2 cells: effect on fatty acid synthesis and triacylglycerol transport. Biochem J. 2002;368:855–864. doi: 10.1042/BJ20020731. [DOI] [PMC free article] [PubMed] [Google Scholar]
- 21.Ishii S, Iizuka K, Miller BC, Uyeda K. Carbohydrate response element binding protein directly promotes lipogenic enzyme gene transcription. Proc Natl Acad Sci U S A. 2004;101:15597–15602. doi: 10.1073/pnas.0405238101. [DOI] [PMC free article] [PubMed] [Google Scholar]
- 22.Migita T, Narita T, Nomura K, Miyagi E, Inazuka F, Matsuura M, Ushijima M, Mashima T, Seimiya H, Satoh Y, Okumura S, Nakagawa K, Ishikawa Y. ATP citrate lyase: activation and therapeutic implications in non-small cell lung cancer. Cancer Res. 2008;68:8547–8554. doi: 10.1158/0008-5472.CAN-08-1235. [DOI] [PubMed] [Google Scholar]
- 23.Berwick DC, Hers I, Heesom KJ, Moule SK, Tavare JM. The identification of ATP-citrate lyase as a protein kinase B (Akt) substrate in primary adipocytes. J Biol Chem. 2002;277:33895–33900. doi: 10.1074/jbc.M204681200. [DOI] [PubMed] [Google Scholar]
- 24.Chypre M, Zaidi N, Smans K. ATP-citrate lyase: a mini-review. Biochem Biophys Res Commun. 2012;422:1–4. doi: 10.1016/j.bbrc.2012.04.144. [DOI] [PubMed] [Google Scholar]
- 25.Yamauchi Y, Furukawa K, Hamamura K, Furukawa K. Positive feedback loop between PI3K-Akt-mTORC1 signaling and the lipogenic pathway boosts Akt signaling: induction of the lipogenic pathway by a melanoma antigen. Cancer Res. 2011;71:4989–4997. doi: 10.1158/0008-5472.CAN-10-4108. [DOI] [PubMed] [Google Scholar]
- 26.Nagaya H, Wada I, Jia YJ, Kanoh H. Diacylglycerol kinase delta suppresses ER-to-Golgi traffic via its SAM and PH domains. Mol Biol Cell. 2002;13:302–316. doi: 10.1091/mbc.01-05-0255. [DOI] [PMC free article] [PubMed] [Google Scholar]
- 27.Ridgway ND. The role of phosphatidylcholine and choline metabolites to cell proliferation and survival. Crit Rev Biochem Mol Biol. 2013;48:20–38. doi: 10.3109/10409238.2012.735643. [DOI] [PubMed] [Google Scholar]
- 28.Tomek K, Wagner R, Varga F, Singer CF, Karlic H, Grunt TW. Blockade of fatty acid synthase induces ubiquitination and degradation of phosphoinositide-3-kinase signaling proteins in ovarian cancer. Mol Cancer Res. 2011;9:1767–1779. doi: 10.1158/1541-7786.MCR-10-0467. [DOI] [PubMed] [Google Scholar]
- 29.Hermansson M, Hokynar K, Somerharju P. Mechanisms of glycerophospholipid homeostasis in mammalian cells. Prog Lipid Res. 2011;50:240–257. doi: 10.1016/j.plipres.2011.02.004. [DOI] [PubMed] [Google Scholar]
- 30.Jackowski S. Cell cycle regulation of membrane phospholipid metabolism. J Biol Chem. 1996;271:20219–20222. doi: 10.1074/jbc.271.34.20219. [DOI] [PubMed] [Google Scholar]
- 31.Boney CM, Fiedorek FT, Jr, Paul SR, Gruppuso PA. Regulation of preadipocyte factor-1 gene expression during 3T3-L1 cell differentiation. Endocrinology. 1996;137:2923–2928. doi: 10.1210/endo.137.7.8770915. [DOI] [PubMed] [Google Scholar]
- 32.Austyn JM, Gordon S. F4/80, a monoclonal antibody directed specifically against the mouse macrophage. Eur J Immunol. 1981;11:805–815. doi: 10.1002/eji.1830111013. [DOI] [PubMed] [Google Scholar]
Associated Data
This section collects any data citations, data availability statements, or supplementary materials included in this article.


