

Abstract
Invariant natural killer T (iNKT) cells display characteristics of both adaptive and innate lymphoid cells (ILCs). Like other ILCs, iNKT cells constitutively express ID proteins, which antagonize the E protein transcription factors that are essential for adaptive lymphocyte development. However, unlike ILCs, ID2 is not essential for thymic iNKT cell development. Here we demonstrated that ID2 and ID3 redundantly promoted iNKT cell lineage specification involving the induction of the signature transcription factor PLZF and that ID3 was critical for development of TBET-dependent NKT1 cells. In contrast, both ID2 and ID3 limited iNKT cell numbers by enforcing the post-selection checkpoint in conventional thymocytes. Therefore, iNKT cells show both adaptive and innate-like requirements for ID proteins at distinct checkpoints during iNKT cell development.
Introduction
Natural killer T (NKT) cells are T lymphocytes that display characteristics of innate immune cells, including the use of invariant receptors to recognize pathogen and rapid activation without prior antigen exposure. NKT cells diverge from the conventional T cell program during positive-selection, after which their maturation is coupled with the ability to rapidly secrete cytokines when challenged (1). As a consequence of their “poised” effector state and ability to produce numerous cytokines, NKT cells can act as both positive and negative regulators of an immune response. They promote pathogen and tumor clearance but their activity can contribute to diseases such as autoimmunity, atherosclerosis, and asthma (2, 3). To harness the therapeutic potential of NKT cells a comprehensive understanding of the mechanisms controlling NKT cell selection, maturation and effector function is required.
Invariant (i)NKT cells, characterized by a Vα14-Jα18 T cell receptor alpha (TCRα) chain paired with TCR Vβ7, Vβ8 and Vβ2 chains (4), are the most abundant and well-characterized NKT cell population in mice. The Vα14 and Jα18 gene segments are located far apart in the Tcrα locus and are recombined through secondary rearrangements that occur late in the life of CD4+CD8+ (double positive/DP) thymocytes (5). Mice harboring mutations that decrease DP thymocyte survival, and mice with limited Tcrα recombination, lack iNKT cells (6–8). Positive selection of iNKT cells requires lipid antigen presentation by the non-classical MHC class I protein CD1d expressed on DP thymocytes, along with signals from the Signaling Lymphocyte Activation Molecule (SLAM) family receptors (9, 10). This selection pathway results in the TCR-dependent induction of the lineage-specifying transcription factor Promyelocytic Leukemia Zinc Finger (PLZF), which is essential for iNKT development and confers innate properties to conventional CD4 T cells when ectopically expressed (11–14).
iNKT cell maturation is divided into 4 stages, based on the surface expression of CD24, CD44 and NK1.1 (15, 16). Stage 0 (CD24+CD44−NK1.1−) represents rare iNKT cell precursors among post-selection (PS) DP thymocytes. Stage 1 cells down-regulate CD8 and CD24 and express low levels of the memory marker CD44. Stage 2 cells have increased CD44 and can progress to stage 3 in the thymus, where they express several NK cell receptors including NK1.1, or they can exit the thymus and mature further in the peripheral tissues. Stage 2 iNKT cells have been considered an immature stage although these cells can robustly produce both T helper 1 (Th1) and Th2 cytokines. However, a subset of Stage 2 iNKT cells are terminally differentiated cells that express the transcription factor GATA3 and these have recently been classified as NKT2 cells. Stage 3 iNKT cells preferentially produce the Th1 cytokine IFNγ with lower amounts of Th2 cytokines, and have been classified as NKT1 (17). TBET is critical for the maturation, survival, and Th1-like characteristics of NKT1 (18, 19). Therefore, acquisition of an iNKT cell TCR, induction of PLZF and TBET define three critical checkpoints during iNKT cell development that control their abundance and functional competence.
The E protein transcription factors are important regulators of conventional T cell development and selection and they control the lifespan and gene signature of DP thymocytes (20, 21). E protein function can be modulated through antagonistic interactions with any of the four members of the ID family (ID1-4) (22). TCR-dependent induction of ID3, and the consequent decrease in E protein activity, is critical for positive selection of conventional CD4 and CD8 T lymphocytes (23–25). However, a role for ID3 in the TCR-dependent selection of iNKT cells has not been demonstrated. Moreover, while development of all non-T cell lineage innate lymphoid cells (ILC) depends on the ID2 protein (26), thymic development of iNKT cells appears to be independent of ID2 (27). Why iNKT cells differ from other ILCs in their requirement for ID2 remains to be determined.
We, and others (28–31), recently demonstrated that ID3 restricts the development of αβ and γδ NKT-like cells. Here we showed that ID proteins were central regulators of the three major thymic iNKT cell developmental checkpoints. ID proteins limited selection into the iNKT cell pathway, at least in part, by extinguishing the potential for secondary Tcrα rearrangements in PS DP thymocytes. Once an appropriate TCR was acquired, ID2 and ID3 functioned redundantly in stage 0 iNKT cells to promote expression of PLZF and entry into the NKT cell lineage. Following iNKT cell specification, ID3 was required for the emergence of TBET+ NKT1 cells in the thymus. We have demonstrated critical functions for ID proteins in the temporal regulation of iNKT cell differentiation and in the control of their effector fates. Moreover, we revealed that ID proteins are universally required for development of innate lymphoid cells.
Material and Methods
Mice
Mice were housed at The University of Chicago Animal Resource Center and experiments were performed according to the guidelines of The University of Chicago Institutional Animal Care and Use Committee. Id3−/−, Id2f/f and Vα14Tg mice have been described previously (9, 32, 33). Tbx21−/− mice were purchased from Jackson Laboratories and CD4Cre mice were purchased from Taconic. Sh2d1a−/− mice were a kind gift from Cox Terhorst. All mice were on a C57Bl/6 background.
Flow Cytometry, Cell Sorting and Antibodies
Thymocyte suspensions from three-to-ten week old mice were incubated with anti-FcγR prior to staining with fluorochrome-conjugated antibodies. Cells were acquired in a LSRII Fortessa, or sorted in a FACSAria, and analyzed with FLOWjo. Enrichment of thymocytes for iNKT cells was performed by staining total thymocytes with APC-conjugated CD1dPBS57 tetramers, followed by anti-APC microbeads and subjected to autoMACS-based magnetic cell separation. Propidium Iodide was included in all samples to exclude dead cells from the analysis. Antibodies specific for the following antigens were purchased from BD Biosciences, eBiosciences, or Biolegend: CD4 (GK1.5), CD8α (53-6.7), TCRβ (H57-597), CD122 (5H4), CD44 (IM7), CD24 (M1/69), IFNγ (XMG1.2), IL4 (11B11), CD69 (H1.2F3), NK1.1 (PK136), NKG2D (CX5), CD45.1 (A20), CD45.2 (104), RORγt (AFKJS-9), T-BET (4B10), CXCR3 (CXCR3-173). The anti-PLZF antibody was purchased from Santa-Cruz (clone D9, Cat No: sc-28319) and conjugated with Pacific Blue using the Pacific Blue Monoclonal Antibody Labeling Kit (Invitrogen, P30013). Intracellular staining for PLZF, RORγt and T-BET was performed using the Foxp3/Transcription Factor Staining Buffer Set (eBiosciences, 00-5523-00) and Fixable Viability Dye eF506 (eBiosciences, 65-0866) was added to exclude dead cells. APC- or PE-conjugated Cd1d tetramers, loaded with PBS57, were obtained from the NIH Tetramer Facility at Emory University.
In vivo BrdU incorporation
Mice were injected i.p. with BrdU (1mg/6g) 12h prior to euthanasia. For pulse-chase experiments, BrdU was added to the drinking water for four days (0.8mg/ml). Water was changed daily. Subsequently, BrdU was removed for the indicated time and thymocytes were stained for surface markers and BrdU according to the manufacturer’s instructions (BD Biosciences).
Adoptive transfers of bone marrow
Bone marrow single-cell suspensions from Id3−/− CD45.2 mice were prepared from femur and tibiae and were mixed in 1:1 ratio with competitor WT CD45.1 bone marrow cells. Recipient mice were lethally irradiated (1000 rad) 5h prior to i.v. injection of total 5×10⁶ cells. Thymocytes were stained for flow cytometry 6–8 weeks post- transplantation.
Cell Culture, IFNγ/IL4 production and intracellular staining
Thymocytes were treated with 50ng phorbol 12-myristate 13-acetate (PMA), 1ug ionomycin and Brefeldin A for 5h, before harvesting and staining intracellularly for IFNγ and IL4 using the BD Biosciences Cytofix/Cytoperm kit.
RNA analysis and Real-time Quantitative (Q)PCR
Total RNA was extracted and DNAase-treated from sorted thymocytes using the RNAeasy mini kit (QIAGEN) and was reverse-transcribed using Superscript III (Invitrogen). QPCR was performed with gene-specific primers in an iCycler (BioRad), using the iQ SYBR Green Supermix (BioRad). Hprt was used to normalize expression levels of other transcripts.
Microarray analysis
10,000 stage 1 (CD24+CD44−NK1.1−) and stage 2 (CD24−CD44+NK1.1−) WT and Id3−/− iNKT cells from 3 independent experiments were sorted and subjected to microarray procedures as described previously (34). Normalized mRNA expression data from WT stage 1, 2 and 3 iNKT cells, obtained from the Immunological Genome Consortium (35), were analyzed to identify genes that are progressively upregulated 1.5- fold from stage 1 to stage 2 and 1.5-fold from stage 2 to stage 3. The gene list was then subjected to dChIP analysis to identify differentially regulated genes between WT and Id3−/− stage 2 iNKT cells. The data can be found at http://www.ncbi.nlm.nih.gov/geo/query/acc.cgi?acc using the accession number GSE50933.
Statistics
A standard Whittney-Mann unpaired test was used (unless otherwise stated) to determine the statistical probability of the differences observed between two populations of cells, using the GraphPad Prism software.
Results
ID3 limited the development of PLZF+ post-selection DP thymocytes
We, and others, previously showed that ID3 limits the number of PLZF+ innate αβ and γδ T lymphocytes in the thymus (28, 30, 31) Here we tested directly whether ID3 functions in the selection of NKT cells at the DP stage of T cell development. γδ T cells were electronically gated out from our analysis, to avoid potential cross-contamination of αβ T cells. We found an accumulation of Zbtb16 (encoding PLZF) mRNA in Id3−/− PS DP thymocytes as compared to WT cells, where Zbtb16 mRNA was below detection (Fig. 1A). There was a small but reproducible population of PLZF+ cells among Id3−/− PS DP thymocytes whereas no PLZF+ cells were observed in the WT population (Fig. 1B and C). Therefore, an increased frequency of Id3−/− DP cells underwent specification to the NKT cell lineages, as measured by PLZF expression.
Figure 1. ID3 limited the number of PLZF+ and Tet+ cells among PS DP thymocytes.
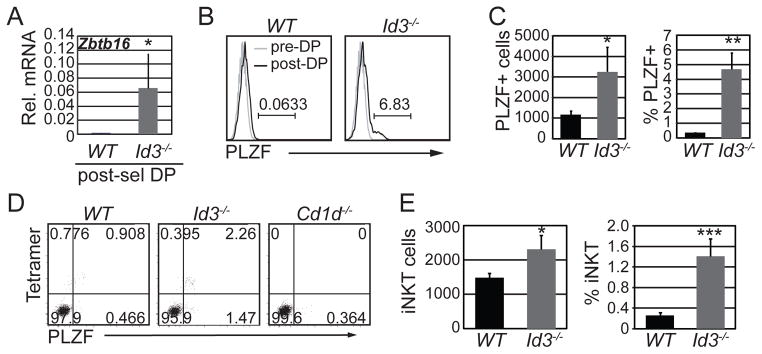
(A) Quantitative RT-PCR (qPCR) analysis for Zbtb16 (PLZF) mRNA in sorted WT and Id3−/− TCRγδ-CD4+CD8+TCRβ+CD69+ thymocytes. The y-axis indicates Zbtb16 mRNA relative to Hprt mRNA analyzed in the same samples. Graphs show the mean ± SD of 5 independent experiments. n=5, *p<0.05, two-tailed unpaired t test. (B) Histograms showing expression of PLZF in gated TCRγδ-CD4+CD8+TCRβ+CD69+ (black line, post-DP) or TCRγδ-CD4+CD8+TCRβ−CD69− cells (grey line, pre-DP) thymocytes from the indicated mouse strains. The number above the line shows percent of PLZF+ cells among PS DP cells. (C) Average number and percentage of of PLZF+ among TCRγδ-CD4+CD8+TCRβ+CD69+ thymocytes. Graphs show mean ± SD of 8 independent experiments. n=8, *p<0.05, **p<0.01, ***p<0.001. (D) Flow cytometry plots showing PLZF and Tet staining on TCRγδ-CD4+CD8+TCRβ+CD69+ thymocytes from mice of the indicated genotype. (E) Graphs show the average number and percentage of Tet+ PS DP cells among PS DP thymocytes in WT and Id3−/− mice. Graphs show mean ± SD of 10 independent experiments. n=10, *p<0.05, ***p<0.001, two-tailed paired t test.
NKT cells require SAP for their development (36). We found that the emergence of PLZF+ cells among Id3−/− PS DP thymocytes required SAP indicating that PLZF expression was a consequence of selection into the innate T lymphocyte lineage rather than being a consequence of deregulated PLZF expression (Supplemental Fig. 1A and B). The majority of Id3−/− PLZF+ PS DP thymocytes were detected with Cd1dPBS57-loaded tetramers (Tet) indicating that these cells were iNKT cell progenitors (Fig. 1D and E). Therefore, ID3 limited the number of DP thymocytes recognizing CD1d and undergoing SAP-dependent selection into the NKT cell pathway.
ID3 limited Vα14Jα18 recombination in PS DP thymocytes
Previous studies showed that E proteins maintain the DP gene “identity” (20, 37) and regulate genes involved in V(D)J recombination (Rag1 and Rag2) and cell survival (Rorc). Given that Id3 is induced by TCR signaling during positive selection (24), we hypothesized that ID3-deficient PS DP thymocytes maintained expression of these E protein target genes and therefore continued to rearrange their antigen receptors. To test this hypothesis, we examined Rorc, Rag1 and Rag2 mRNA in WT and Id3−/− PS DP thymocytes. Despite apparent TCR signaling, Rorc, Rag1 and Rag2 mRNAs were expressed more abundantly in Id3−/− than in WT cells (Fig. 2A). At the single cell level, RORγt was detected in a subset of Id3−/− PS DP thymocytes (Fig. 2B and C). Unlike PLZF, however, RORγt+ cells persisted in the absence of SAP indicating that Rorc was not induced as a consequence of NKT cell selection (Supplemental Fig. 1C). Our results indicated that a subset of Id3−/− PS DP thymocytes maintained expression of the E protein target genes Rorc, Rag1 and Rag2.
Figure 2. Id3−/− PS DP thymocytes had an increased number of Vα14Jα18 recombination events.

(A) qPCR analysis of Rorc, Rag1 and Rag2 mRNA in sorted CD4+CD8+TCRβ+CD69+ thymocytes from WT and Id3−/− mice. Graphs show mean ± SD of 5 independent experiments. n=5, *p<0.05, two-tailed unpaired t test. (B) RORγt in gated post-selection (black line) or preselection (grey line) DP thymocytes from WT and Id3−/− mice. The shaded histogram shows RORγt expression in CD8+TCRβ+ cells, as a negative control. The number above the line shows percent of RORγt+ cells among PS DP cells. (C) Graph shows the average percentage of RORγt+ cells among PS DP cells in WT and Id3−/− mice. n=8, ***p<0.001. qPCR analysis of (D) Vα14Jα18 mRNA and (E) Vα14Jα18 DNA rearrangements in sorted CD4+CD8+TCRβ+CD69+ thymocytes from WT and Id3−/− mice. Numbers change in detection relative to WT. Graphs show the mean ± SD from 5 independent experiments. n=5 *p<0.05, **p<0.01, two-tailed unpaired t test. (F) qPCR analysis of Jα transcripts containing Jα gene segments that are proximal and distal to Vα in TCRγδ-CD4+CD8+TCRβ+CD69+ thymocytes cells sorted from WT and Id3−/− mice. Numbers show change in detection relative to WT for each Jα transcript. Graphs show the mean ± SD from 3 independent experiments. n=3 *p<0.05, **p<0.01, two-tailed unpaired t test. (G) Flow cytometry plots of total thymocytes from Id3+/+;Vα14Tg and Id3−/−;Vα14Tg mice showing the percentage of Tet+TCRβ+ iNKT cells. (H) Average number and percentage of iNKT cells in the indicated mouse strains. Graphs show the mean ± SD from 10 independent experiments, n=10.
We hypothesized that sustained RAG1 and RAG2 expression in Id3−/− PS DP thymocytes increased the probability of secondary rearrangements including the Vα14-Jα18 rearrangement used in the iNKT cell TCR. Consistent with this hypothesis, there was a 4.5-fold increase in Vα14Jα18 mRNA in Id3−/− PS DP thymocytes compared to WT littermates (Fig 2D). Additionally, Id3−/− PS DP cells had a 2.5-fold increase in the frequency of cells with a Vα14-Jα18 rearrangement (Fig 2E). We detected increased usage of distal Jα transcripts and decreased usage of proximal Jα transcripts suggesting that ID3 limited the V(D)J recombination process (Fig. 2F). ID3 deficiency could have prolonged the survival of DP thymocytes resulting in increased distal rearrangements. However, we did not detect an increase in Vα14-Jα18 rearrangement in pre-selection DP cells and Id3−/− pre- and post-selection DP cells did not show prolonged survival in vivo, as measured by BrdU dilution (Supplemental Fig. 1D and E). Moreover, mRNA encoding pro-survival proteins such as Bclxl or Bcl2, which are targets of RORγt, were similar in WT and Id3−/− pre- and post-selection DP thymocytes (data not shown).
To assess whether the increased frequency of cells with a Vα14-Jα18 rearrangement could contribute to the increased number of iNKT cells, we introduced a CD4 promoter-driven, pre-rearranged Vα14Jα18 TCR (Vα14 transgene (9)) into the ID3-deficient background. By removing the need for recombination of the TCRα chain we should have overcome any bias in iNKT cell development provided by altered Vα14-Jα18 rearrangement. We found that Id3+/+ and Id3−/− Vα14 transgenic mice had a similar frequency and absolute number of iNKT cells in the thymus (Fig 2G and H). These data support the hypothesis that the increased number of iNKT cells in Id3−/− mice was a consequence, at least in part, of extended Vα14-Jα18 recombination.
ID3 limited the number of iNKT cells
Our data indicated that Id3−/− PS DP thymocytes continued to rearrange the Jα locus and thereby produced more cells with a TCR capable of selection into the NKT cell lineages. Consistent with this conclusion, there was a 3-fold increase in the frequency and 1.8-fold increase in the number of iNKT cells in Id3−/− mice compared to wild-type (WT) littermates (Fig. 3A and B). The increased number of iNKT cells was an intrinsic consequence of ID3-deficiency as revealed in mixed bone marrow (BM) chimeras (Fig. 3C and D). Relative to DP thymocytes, Id3−/− iNKT cells were increased by approximately 1.6-fold whereas WT iNKT cells decreased by 40% in the same chimera (Fig. 3E and Supplemental Fig. 1F). As expected (23), Id3−/− CD4 and CD8 thymocytes decreased by 35% and 55%, respectively, with a concomitant increase in WT CD4 and CD8 thymocytes (Fig. 3F and Supplemental Fig. 1F). Therefore, Id3−/− DP thymocytes produced more iNKT cells and fewer conventional thymocytes than their WT counterparts in mixed BM chimeras. The increased frequency of Id3−/− iNKT cells was not a consequence of altered expression of the selection-associated proteins CD1d, SLAM, LY108 or SAP (Fig. 3F and G). Therefore, ID3 deficiency led to an intrinsic enhancement of iNKT cell numbers.
Figure 3. Id3−/− mice had increased iNKT cell numbers.

(A) Flow cytometry plots of total thymocytes from WT and Id3−/− mice showing the percentage of iNKT cells indentified by CD1dPBS57-tetramer and TCRβ staining. (B) Average percentage and number of total iNKT thymocytes in the indicated mouse strains. n=20 for each genotype *p<0.05, ***p<0.001. Graphs show the average of >15 independent experiments. Bars indicate standard deviation (SD). (C) Flow cytometry plots showing the percentage of Tet+TCRβ+ iNKT cells among CD45.1+ (WT) and CD45.2+ (Id3−/−) cells in competitive bone marrow (BM) chimeras. (D) Average percentage of Tet+Tcrβ+ iNKT cells among CD45.1+ (WT) and CD45.2+ (Id3−/−) cells. n=8 chimeric mice, *p<0.05, two-tailed paired t test. Bars indicate SD. (E) Analysis of DP, iNKT, CD4 and CD8 cells in competitive bone marrow chimeras shown as the percent of WT or Id3−/− DP cells. n=8, ***p<0.001, two-tailed paired t test. Bars indicate SD. (F) Histograms showing expression of CD150, LY108 and CD1d in DP thymocytes from WT and Id3−/− mice. (G) RT-QPCR analysis of Sh2d1a mRNA (encoding for the adaptor protein SAP), in CD4−CD8− and CD4+CD8+ sorted thymocytes from WT and Id3−/− mice. Solid grey histogram indicates isotype control.
ID3 was required for normal development of Stage 3 iNKT cells
Our data indicated that ID3 limited iNKT cell selection; however, we questioned whether ID3 might also have functioned in iNKT cell maturation or effector fate determination. When stimulated with PMA and ionomycin, a subset of WT iNKTs produced interferon gamma (IFNγ) or IFNγ plus interleukin 4 (IL4), whereas only a few cells produced IL4 without IFNγ. In contrast, a lower frequency of Id3−/− iNKT cells produced IFNγ alone and an increased frequency of cells produced only IL4 (Fig. 4A and B). Consistent with the decline in IFNγ only producing cells, there was a decrease in stage 3 iNKT cell number and frequency, as measured by multiple surface markers, which are the major IFNγ-only producing iNKT cells in WT mice (Fig. 4C, D and Supplemental Fig. 2A). By contrast, the frequency of Id3−/− stage 1 and stage 2 cells increased (Fig. 4C and D). The reduction of stage 3 iNKT cells and the accumulation of stage 1 and 2 iNKT cells was also apparent in mixed BM chimeras (Fig. 4E and F). Id3−/− stage 3 cells did not stain with annexin V and they expressed the chemokine receptor CXCR3, which functions in thymic retention (38) (Supplemental fig. 2B and 2C) indicating that these cells are not apoptotic and they should be retained in the thymus. Conversely, stage 2 iNKT cells did not express CXCR3, which could have lead to their thymic retention. Indeed, Id3−/− Stage 2 iNKT cells were capable of exiting the thymus since iNKT cells were present in the periphery of Id3−/− mice, although their numbers were decreased (Fig. 5A and B). Moreover, there were few peripheral NK1.1+ stage 3 cells indicating that maturation may also be impaired in the periphery (Fig. 5C and D). We conclude that ID3 was required intrinsically for the development of stage 3 iNKT cells. We note that the decreased frequency of IFNγ-only producing iNKT cells is less severe than the decreased frequency of stage 3 iNKT cells, which could be a consequence of increased expression of EOMES in stage 2 iNKT cells (Supplemental Fig. 2D).
Figure 4. ID3 was required for iNKT cell maturation.

(A) Intracellular staining for IFNγ and IL4 in gated Tet+CD24− cells after in vitro culture with (lower panel) or without (upper panel) PMA and ionomycin for 5 hours. Numbers indicate percent of cells in each quadrant. (B) Average percentage and number of iNKT thymocytes expressing the indicated cytokines from WT and Id3−/− mice. Graphs show the mean ± SD from 4 independent experiments. n=4 for each genotype, *p<0.05, **p<0.01. (C) WT and Id3−/− thymocytes were analyzed for Tet+CD24− iNKT cells (upper panel) and CD44 and NK1.1 expression is shown in gated Tet+CD24− iNKT cells (lower panel). Numbers in plots indicate percent of cell subsets in the respective gates. (D) Average percentage and number of stage 1, stage 2 and stage 3 iNKT cells in WT and Id3−/− thymi. Graphs show the mean ± SD from >15 independent experiments. n=19, ***p<0.001. (E) Chimeric mice shown in Figure 1 were analyzed for Tet+CD24− thymocytes (upper panel) and surface expression of CD44 and NK1.1 (lower panel). (F) Average percentage of stage 1, stage 2 and stage 3 iNKT cells in CD45.1+(WT) and CD45.2+(Id3−/−) cells from the competitive bone marrow chimeras. Graphs show the mean ± SD from 8 independent experiments. n=8, *p<0.05, ***p<0.001, two-tailed paired t test.
Figure 5. Id3−/− peripheral iNKT cells failed to mature.

(A) Flow cytometry plots showing the percentage of Tet+TCRβ+ iNKT cells in the spleen and liver from WT and Id3−/− mice. (B) Graphs show average number and percentage of iNKT cells in the spleen and liver of the indicated mouse strains. Graphs show mean ± SD from 8–10 independent experiments. *p<0.05, **p<0.01. (C) Histograms showing the expression of NK1.1 on total iNKT cells in the spleen and liver of WT and Id3−/− mice. Shaded histogram is the isotype control. Numbers indicate percent of NK1.1+ cells among iNKT cells. (D) Graphs show average percentage of NK1.1+ cells among the iNKT population in the spleen and liver of the indicated mouse strains. Graphs show mean ± SD from 8–10 independent experiments. *p<0.05, **p<0.01.
Proliferation of iNKT cells occurs primarily at the immature stages. Therefore, the increased iNKT cell frequency or the decline in Stage 3 iNKT cells could be due to increased proliferation of these cells. However, WT and Id3−/− stage 1 and 2 iNKT cells labeled similarly with BrdU during a 12 hour pulse suggesting that these cells have an equivalent rate of proliferation (Supplemental Fig. 2E and F). We also considered the possibility that arrested maturation contributed to the increased number of stage 1 and stage 2 iNKT cells. However, Tbx21−/− iNKT cells, which also fail to generate stage 3 iNKT cells (18, 19), did not have an increased number of total iNKT cells (Supplemental Fig. 2G and H) arguing that arrested maturation per se does not augment iNKT cell numbers. Therefore, in addition to preventing post-selection recombination of the iNKT TCR, ID3 promoted iNKT cell maturation to stage 3 but had little impact on NKT cell proliferation.
ID3 supported the progenitors of TBET+ stage 3 iNKT (NKT1) cells
PLZF and TBET are critical regulators of iNKT cell specification and maturation (11, 12, 39). Intracellular staining and flow cytometry revealed higher PLZF (Fig. 6A, left panel) and lower TBET expression in Id3−/− iNKT cells as compared to WT (Fig. 6B). However, PLZF was expressed similarly in WT and Id3−/− stage 1 and stage 2 iNKT cells (Fig. 6A). Therefore, the increased PLZF was a consequence of the loss of stage 3 iNKT cells, which typically express lower PLZF (12). In contrast to PLZF, TBET expression at stage 2 was severely reduced in the absence of ID3 (Fig. 6B). Overall, we detected a 3.5-fold decrease in the number of TBET+ cells (Fig. 6C), consistent with the reduction of stage 3 cells. Importantly, Tbx21 (encoding TBET) mRNA could be detected in WT stage 1 iNKTs and was increased at stage 2. In contrast, there was a 2- and a 4-fold reduction of Tbx21 mRNA in ID3-deficient stage 1 and 2 iNKTs, respectively (Fig. 6D) suggesting that Tbx21 expression is perturbed at the earliest stages of iNKT maturation. Tbx21 is part of a broader gene expression program that is implemented over the course of the stage 1 to 3 transition (40). Microarray analysis revealed that over 70% of the genes that are progressively upregulated from stage 1 to stage 3 failed to initiate expression during the stage 1 to 2 transition in Id3−/− iNKT cells (Fig. 6E). Given that Id3 is expressed more highly in stage 1 and 2 iNKT cells than in stage 3 cells (Supplemental Fig. 3A), we concluded that iNKT cells rely on ID3 to support the emergence of the stage 3-associated gene expression program at the earliest stages of iNKT cell maturation.
Figure 6. Id3−/− iNKT cells failed to induce the stage 3-associated transcriptional program.

Histograms showing (A) PLZF or (B) TBET in total (left), stage 1 (middle) and stage 2 (right) iNKT cells from WT (grey line) and Id3−/− (black line) mice. Shaded histogram is expression of the respective protein in conventional CD4+ thymocytes, which are a negative control. (C) Average number of TBET+ iNKT cells in the thymus. The graph shows the mean ± SD from 12 independent experiments. n=12, ***p<0.001. (D) qPCR analysis of Tbx21 mRNA in sorted stage 1 and 2 iNKT thymocytes from WT and Id3−/− mice. The y-axis indicates change relative to expression in WT stage 1. The graph shows the mean ± SD from 3 independent experiments. Two mice for each mouse strain were pooled for each experiment. n=3, **p<0.01, ***p,0.001, two-tailed unpaired t test. (E) A set of 70 genes that are progressively upregulated during the transition from WT stage 1 through stage 3 was identified by analyzing normalized data from the Immunological Genome Consortium. The expression of each gene in WT and Id3−/− stage 1 and stage 2 iNKT cells is shown as a heatmap.
ID2 and ID3 cooperated to limit iNKT cell selection
ID3 was required for the initiation of the stage 3-gene program early during iNKT cell maturation. However, Id2 and Id3 mRNA were co-expressed in stage 1 and stage 2 iNKT cells (Supplemental Fig. 3A). Although ID2-deficiency has no effect on thymic iNKT cell development (27 and Supplemental Fig 3B and C), we hypothesized that ID2 may have compensated for some ID3 functions. Additionally, ID3 may have compensated for the loss of ID2 thereby masking the requirements for ID proteins in iNKT cells. To address this possibility, we created CD4-Cre;Id2f/f;Id3−/− (Id2Δ/Δ;Id3−/−) mice that lacked both Id2 and Id3 starting in DP thymocytes. Analysis of Id2Δ/Δ;Id3−/− mice revealed a reduced number of CD4 and CD8 T cells, consistent with published results (21). However, greater than 30% of Id2Δ/Δ;Id3−/− CD4 T cells were iNKT cells, compared to only 2% of their littermate controls (LMC) (Supplemental Fig. 3D). The frequency and absolute number of iNKT cells among total thymocytes was increased by an average of 7-and 5-fold, respectively, in Id2Δ/Δ;Id3−/− mice compared to LMC (Fig. 7A and B). This increase was significantly larger than the increase observed in Id3−/− mice (Fig. 7C).
Figure 7. Increased iNKT cell development in the absence of both Id2 and Id3.

(A) Flow cytometry plots of total thymocytes from Id2f/f and CD4Cre;Id2f/f;Id3−/− (Id2Δ/Δ;Id3−/−) mice showing the percentage of Tet+TCRβ+ iNKTs. (B) Average percentage and number of total iNKT thymocytes in the indicated mouse strains. (C) Fold change in iNKT percentage (left) and cell numbers (right) of Id3−/− and Id2Δ/Δ;Id3−/− relative to littermate controls (LMC). Graphs show the mean ± SD of 10 independent experiments. n=10, *p<0.05, **p<0.01. (D) TCRβ+CD69+ (post-selection) thymocytes from the indicated mouse strains were analyzed for CD4 and CD8 expression (upper panel) and DP cells were then analyzed for CD1dPBS57-tetramer staining. Numbers in the plots indicate percent of DP cells among PS thymocytes (upper panel), and percent of Tet+ cells among PS DP cells (lower panel). (E) Average number of CD4+CD8+TCRβ+CD69+Tet+ (upper graph) and percentage of Tet+ thymocytes among PS DP cells (lower graph). Graphs show the mean ± SD of 10 independent experiments. n=10, *p<0.05, **p<0.01. (F) qPCR analysis of Vα14Jα18 mRNA (in sorted CD4+CD8+TCRβ+CD69+ thymocytes from LMC and Id2Δ/Δ;Id3−/− mice. Graphs show the mean ± SD of 3 independent experiments. n=3, *p<0.05, two-tailed unpaired t test.
In Id2Δ/Δ;Id3−/− thymi there was a substantial increase in the frequency of PS DP cells (Fig. 7D). Moreover, there was a 6-fold increase in the percentage and a 4-fold increase in the number of Tet+ PS DP thymocytes in Id2Δ/Δ;Id3−/− mice (Fig. 7E). Consistent with these results, we observed a 9-fold increase in the canonical Vα14Jα18 mRNA transcripts in Id2Δ/Δ;Id3−/− PS DP thymocytes, compared to the LMC control mice (Fig. 7F). Our results demonstrated that the failure to express ID2 and ID3 during positive selection altered the TCR repertoire allowing for accumulation of iNKT cells.
Redundant functions for ID2 and ID3 during NKT cell lineage specification
We next examined the consequences of Id2 and Id3 deletion on iNKT cell maturation. Remarkably, whereas Id3−/− iNKT cells were arrested at stage 2, Id2Δ/Δ;Id3−/− iNKT cells lacked CD44hi stage 2 and stage 3 cells (Fig. 8A). The total number and frequency of stage 1 iNKT cells was increased by 85- and 10-fold, respectively in Id2Δ/Δ;Id3−/− compared to LMC mice (Fig. 8B). In vitro stimulation of Id2Δ/Δ;Id3−/− iNKT cells revealed impaired IFNγ but normal IL4 production and the cells failed to co-produce IFNγ and IL4 (Fig. 8C), a trait of iNKT cells that is conferred by PLZF. Consistent with this, PLZF protein expression was reduced at least two-fold in Id2Δ/Δ;Id3−/− stage 0 and stage 1 iNKT cells relative to LMC (Fig. 8D and E), whereas it was expressed in stage 1 Id2Δ/Δ and Id3−/− iNKT cells (Fig. 6 and Supplemental Fig. 4A). Importantly, Id2Δ/Δ;Id3−/− stage 0 and stage 1 iNKT cells showed a 5- and 2.5-fold decrease, respectively, in Zbtb16 mRNA compared to their LMC controls (Fig. 8D and E). Therefore, ID proteins are required to support expression of Zbtb16 in iNKT cell progenitors and to allow their specification to the NKT cell fate (Fig 8E). These data are in accordance with previous studies showing that haploinsufficiency of PLZF leads to a naïve-like iNKT phenotype (41). Importantly, Tet+ cells failed to accumulate in the spleen and the liver of Id2Δ/Δ;Id3−/− mice and the few cells that were present completely lacked NK1.1 (Fig. 8F, G and Supplemental Fig. 4B). In contrast, Tet+ cells were detected in higher frequency in the lymph nodes of the compound mutant mice (Supplemental Fig. 4C and D); however, the majority showed a CD44loCD62L+ phenotype, indicative of a naïve state. The failure to induce PLZF appeared to be independent of EGR2, a direct transcriptional regulator of Zbtb16, since Egr2 mRNA and EGR2 protein were increased in Id2Δ/Δ;Id3−/− iNKT cells (Supplemental Fig. 4E and F). Moreover, Id2Δ/Δ;Id3−/− stage 1 iNKT cells incorporated less BrdU during a 12 hour pulse than their LMC (Supplemental Fig. 4G), indicating that these cells were not increased as a consequence of increased proliferation. These data revealed that deletion of Id2 and Id3 in DP thymocytes resulted in an increased number of PS DP thymocytes with a CD1dPBS57-tetramer binding TCR; however, these cells failed to induce sufficient PLZF to progress beyond stage 1 or to acquire innate-like characteristics. Moreover, these cells resembled conventional CD4 T cells in that they accumulated in lymph nodes rather than the liver and had a naïve phenotype. Therefore, ID2 and ID3 functioned redundantly to specify the iNKT cell fate.
Figure 8. Id2 and Id3 regulate iNKT cell specification.

(A) Id2f/f and Id2Δ/Δ;Id3−/− thymocytes were analyzed for Tet+CD24− iNKT cells (upper panel). The percentage of Tet+CD24− cells is indicated. CD44 and NK1.1 expression is shown in gated Tet+CD24− iNKT cells (lower panel). Numbers indicate percent of cells in the respective quadrants. (B) Average cell number and percentage of stage 1 iNKT cells in the indicated mouse strains. Graphs show the mean ± SD of 8 independent experiments. n=8, ***p<0.001. (C) Total thymocytes from Id2f/f and Id2Δ/Δ;Id3−/− mice were cultured in vitro with (lower panel) or without (upper panel) PMA and ionomycin for 5 hours. Intracellular staining of IFNγ and IL4 in gated Tet+CD24− cells is shown. Numbers indicate percent of cells in each quadrant. (D) Histogram (left panel) showing PLZF expression in stage 1 iNKT cells from Id2f/f (grey line) and Id2Δ/Δ;Id3−/− (black line) mice. Solid grey indicates PLZF expression from conventional CD4 thymocytes from littermate control mice. Graph (middle panel) shows the average mean fluorescence intensity (MFI) from 10 independent experiments. n=12, *p<0.05. Graph (right panel) shows qPCR analysis of Zbtb16 mRNA in sorted stage 1 (Tet+CD24−CD44−NK1.1−,) iNKT thymocytes from LMC and Id2Δ/Δ;Id3−/− mice. Numbers in the y-axis indicate fold change relative to LMC stage 1 expression. Graphs show the mean ± SD from 3 independent experiments. n=3, **p<0.01, two-tailed unpaired t test. (E) Histogram (left panel) showing PLZF expression in stage 0 (Tet+CD24+CD69+CD44−) iNKT cells from Id2f/f (grey line) and Id2Δ/Δ;Id3−/− (black line) mice. Solid grey indicates PLZF expression from conventional CD4 thymocytes from littermate control mice. Histogram is representative of two independent experiments. Graph (right panel) shows qPCR analysis of Zbtb16 mRNA in sorted stage 0 (Tet+CD24+CD69+CD44−) iNKT thymocytes from LMC and Id2Δ/Δ;Id3−/− mice. Numbers in the y-axis indicate fold change relative to LMC stage 1 expression. Graphs show the mean ± SD from 3 independent experiments. n=3, **p<0.01, two-tailed unpaired t test. Flow cytometry plots showing lymphocytes from the (F) spleen and (G) liver of the indicated mouse strains analyzed for Tet+TCRβ+ cells (upper panel). The percent of Tet+TCRβ+ cells is indicated. Histograms showing the percent of NK1.1+ iNKTs (lower panel). Solid grey indicates the isotype control.
Discussion
We have shown that ID proteins are major regulators of at least three critical checkpoints in iNKT cell development. ID proteins limited selection into the iNKT cell pathway and total iNKT cell numbers by extinguishing the potential for secondary rearrangements at Tcrα during conventional T cell positive-selection. In contrast, post-positive-selection, ID proteins were essential for iNKT cell lineage specification and maturation in the thymus. ID2 and ID3 redundantly promoted expression of PLZF and entry of Tet+ DP cells into the iNKT cell lineage. After iNKT cell lineage specification, ID3 was required for the emergence of TBET+ stage 3 iNKT cells. Our data demonstrated that ID protein dependency is a common requirement for all innate lymphoid lineages and revealed that alteration of ID protein dose modulates the effector subset composition within the iNKT cell lineage.
The development of iNKT cells depends on the lifespan of DP thymocytes. RORγt− or HEB-deficiency, which leads to decreased Rorc expression and DP survival, results in a loss of iNKT cells due to a failure to rearrange Vα14 and Jα18, a phenotype that is rescued by transgenic expression of the survival proteins BCLxL or BCL2 or a rearranged Vα14Jα18 TCR (6, 7). We observed that RORγt was maintained in a subset of Id3−/− PS DP thymocytes. Nonetheless, Bclxl and Bcl2 were not expressed and we found no evidence for increased survival of DP thymocytes in Id3−/− mice. Therefore, we propose that the increased number of iNKT cells in Id3−/− and Id2Δ/Δ;Id3−/− mice was largely a consequence of the failure of PS DP thymocytes to extinguish expression of Rag1 and Rag2. These cells continued to rearrange Tcrα until a TCRα chain was generated, such as Vα14Jα18, that allowed selection into the iNKT cell lineage. Consistent with this hypothesis, Vα14Jα18 TCR rearrangements and Tet+ cells were increased among Id3−/− and Id2Δ/Δ;Id3−/− PS DP thymocytes. Moreover, expression of a Vα14Jα18 TCR extinguished the advantage of Id3−/− T cells to generate iNKT cells as compared to Vα14Jα18 transgenic Id3+/+ T cells. The accumulation of iNKT cells in Id3−/− or Id2Δ/Δ;Id3−/− mice is unlikely to be a consequence of arrested maturation since both PLZF-deficient and TBET-deficient mice, which show altered maturation similar to Id2Δ/Δ;Id3−/− and Id3−/− iNKT cells respectively, do not have an increased number of thymic iNKT cells. Although we cannot exclude additional roles for ID proteins during the NKT lineage selection, our results are consistent with the conclusion that ID proteins limited the ability of DP thymocytes with a functional TCR to undergo secondary recombination events that increased the number of iNKT cells.
One implication of our findings is that ID3 is not required for positive selection of cells with an iNKT cell receptor. Consistent with this, Id3 mRNA showed significantly less induction in stage 0 iNKT cells than in conventional PS DP thymocytes (Supplemental Fig. 3A). ID3 is a target of the ITK/RAS/ERK Kinase signaling pathway that is activated during positive selection into both the conventional and the iNKT cell pathway (42). Why the signals initiated during iNKT cell selection fail to strongly induce Id3 mRNA remains to be determined. Although Itk−/− and Id3−/− mice have similar alterations in iNKT cell maturation, Itk−/− mice do not have an increased number of iNKT cells (43) suggesting that ITK is not required for ID3 induction during positive selection. However, whether attenuation of ITK activation limits Id3 mRNA induction during iNKT cell specification remains to be determined. An alternative possibility is that the SLAM/SAP signaling pathway attenuates Id3 expression in the face of strong TCR signaling during iNKT cell lineage specification. β-catenin, which is activated by TCR signaling and can inhibit expression of both Id2 and Id3 mRNA in thymocytes (44), may play a role in Id3 attenuation during iNKT cell lineage specification since mice expressing an activated form of β-catenin in T lymphocytes phenocopy Id3−/− mice (45). However it remains to be determined whether the increased number of iNKT cells in these mice is a consequence of decreased ID3 expression in PS DP thymocytes. Regardless, ID proteins may serve as integrators of multiple signaling pathways to regulate the output of thymic selection.
Specification of DP thymocytes into the iNKT cell lineage is regulated by PLZF (11, 12). We showed here that induction of PLZF in iNKT cells requires either ID2 or ID3. ID2 is tightly associated with innate lymphoid lineages and is absolutely required for development of all non-T lineage ILC subsets (26). Nonetheless, ID2-deficiency had little effect on thymic iNKT cell development (27), suggesting that iNKT cells differ significantly from other ILC populations in their requirement for ID2. In contrast to this view, we propose that ID2 is a critical driver of the iNKT cell fate but that ID3 compensates for the loss of ID2 during iNKT cell lineage specification. Previous studies demonstrated that Id3 mRNA is induced by E proteins and is increased in many instances of ID2-deficiency (46, 47), raising the possibility that ID3 is critical for iNKT cell specification only when ID2 fails to be expressed. Consistent with the hypothesis that ID2 is the critical regulator of iNKT cell specification, EGR2 directly regulates the transcription of both Id2 and Zbtb16 in developing iNKT cells (48). In Id2Δ/Δ;Id3−/− Tet+ cells, EGR2 protein was present even though Zbtb16 failed to be induced, indicating that ID proteins were required for additional components of the transcriptional program leading to Zbtb16 induction. Furthermore, Id2Δ/Δ;Id3−/− Tet+ cells were present in the lymph nodes rather than the liver and spleen, a phenotype consistent with the loss of PLZF and the innate T cell identity. Collectively, our results indicate that ID proteins control the transcriptional network required for entry into the iNKT cell lineage.
After specification to the iNKT cell lineage Id3 mRNA declines, whereas Id2 mRNA increases. Given that baseline Id3 mRNA expression is a gauge for E protein activity, we propose that E protein activity also declines during iNKT cell maturation. Surprisingly, despite the decline of Id3 mRNA in stage 3 iNKT cells, ID3 is required for the emergence of this population. The lack of Id3 mRNA expression in these cells indicates that ID3 does not directly support the survival of these cells or the maintenance of their transcriptional program. It seems unlikely that the increase in stage 2 iNKTs in the thymus of Id3−/− mice was due to defective thymic egress because iNKT cells were readily detected in the periphery, and CXCR3 was expressed on the appropriate iNKT cell subsets. Nonetheless, Id3−/− iNKT cells failed to initiate expression of a cohort of genes associated with stage 3 including multiple NK cell receptors. Moreover, the transcription factor TBET, which controls the transcriptional program of stage 3 iNKT cells (18), was severely reduced in stage 1 and stage 2 Id3−/− iNKT cells. Therefore, ID3 may support the development of a precursor to stage 3 or it may promote a critical regulator of the stage 3 gene program.
Surprisingly, the requirement for ID3 is not absolute in peripheral iNKT cells, where there was only a modest reduction of NK1.1+ cells. However, Id2 expression is higher in splenic and liver iNKT cells than in thymic iNKT, whereas Id3 expression is low in peripheral iNKT cells. These findings raise the possibility that in the periphery ID2 performs the functions attributed to ID3 in the thymus. Consistent with this idea, ID2 has been implicated in the survival of hepatic iNKT cells (27). Therefore, we propose that the requirements for ID2 and ID3 differ in the thymus and the periphery due to their pattern of expression but that ID proteins are necessary for NKT cell specification and effector fate determination. Indeed, in the absence of both ID proteins, thymic iNKT cells lose their innate properties the peripheral iNKT cell pool is severely diminished and functionally compromised.
We demonstrated that ID2 and ID3 play a critical role in controlling the number of iNKT cells and their effector repertoire. Our results imply that E protein function needs to be tightly regulated during iNKT cell development since deletion of both Id2 and Id3 relaxes the constraints on E protein activity. Whether E proteins are required for any functions in iNKT cells remains to be determined; however, it seems likely that ID proteins restrain but do not totally ablate E protein function. Therefore, an increase in E protein function could augment expression of genes that are normally regulated by E protein homodimers in NKT cells. Alternatively, an increase in E protein concentration could deregulate genes with low affinity E-boxes. For example, E protein homodimers could antagonize expression of genes that are regulated by class II bHLH transcription factors since these proteins have subtly different consensus binding sequences and therefore may have distinct gene target specificity when present at low doses (22). E proteins have been proposed to interact with the HLH protein BHLHE40, a transcriptional repressor that is part of the core effector program of iNKT cells and therefore increased E protein concentration may augment or compete for BHLHE40 functions (40, 49). Regardless of the mechanism, our results demonstrate that tight regulation of E protein dose is critical for iNKT cell development and effector differentiation.
We, and others, have shown previously that cytokine production by PLZFhi NKT cells can influence the fate of bystander CD8 T cells and the production of IgE (31, 50, 51, 52). Therefore, a minor difference in the number and effector composition of NKT cells can have widespread effects on the immune response. Our results show that ID proteins have multiple roles in determining the iNKT cell number and effector fate and further reveal a global role for the ID family of proteins in shaping the composition of the innate immune system.
Supplementary Material
Acknowledgments
Barbara L. Kee is a Scholar of the Leukemia and Lymphoma Society. This work was supported by a grant from the NIH (CA099978) to Barbara L. Kee.
We thank Dr. Albert Bendelac for helpful discussions, comments on the manuscript, and numerous reagents including the Vα14 transgenic mice, Liselotte Lenner for performing the microarray, and members of the Kee laboratory for helpful discussions. This work benefited from data assembled by the Immunological Genome Consortium.
Abbreviations
- iNKT
Invariant Natural Killer T cells
- ILC
Innate lymphoid cells
- DP
Double positive
- PS
post-selection
- TCR
T cell receptor
- HLH
Helix-Loop-Helix
- WT
wild type
- LMC
Littermate control
- BM
Bone marrow
Footnotes
Disclosure
The authors declare no competing financial interests.
References
- 1.Bendelac A, Savage PB, Teyton L. The biology of NKT cells. Annu Rev Immunol. 2007;25:297–336. doi: 10.1146/annurev.immunol.25.022106.141711. [DOI] [PubMed] [Google Scholar]
- 2.Van Kaer L, V, Parekh V, Wu L. Invariant natural killer T cells as sensors and managers of inflammation. Trends Immunol. 2013;34:50–58. doi: 10.1016/j.it.2012.08.009. [DOI] [PMC free article] [PubMed] [Google Scholar]
- 3.Berzins SP, Smyth MJ, Baxter AG. Presumed guilty: natural killer T cell defects and human disease. Nat Rev Immunol. 2011;11:131–142. doi: 10.1038/nri2904. [DOI] [PubMed] [Google Scholar]
- 4.Park SH, Weiss A, Benlagha K, Kyin T, Teyton L, Bendelac A. The mouse CD1d-restricted repertoire is dominated by a few autoreactive T cell receptor families. J Exp Med. 2001;193:893–904. doi: 10.1084/jem.193.8.893. [DOI] [PMC free article] [PubMed] [Google Scholar]
- 5.Engel I, Kronenberg M. Making memory at birth: understanding the differentiation of natural killer T cells. Curr Opin Immunol. 2012;24:184–190. doi: 10.1016/j.coi.2012.01.012. [DOI] [PMC free article] [PubMed] [Google Scholar]
- 6.Egawa T, Eberl G, Taniuchi I, Benlagha K, Geissmann F, Hennighausen L, Bendelac A, Littman DR. Genetic evidence supporting selection of the Valpha14i NKT cell lineage from double-positive thymocyte precursors. Immunity. 2005;22:705–716. doi: 10.1016/j.immuni.2005.03.011. [DOI] [PubMed] [Google Scholar]
- 7.D’Cruz LM, Knell J, Fujimoto JK, Goldrath AW. An essential role for the transcription factor HEB in thymocyte survival, Tcra rearrangement and the development of natural killer T cells. Nat Immunol. 2010;11:240–249. doi: 10.1038/ni.1845. [DOI] [PMC free article] [PubMed] [Google Scholar]
- 8.Callen E, Faryabi RB, Luckey M, Hao B, Daniel JA, Yang W, Sun HW, Dressler G, Peng W, Chi H, Ge K, Krangel MS, Park JH, Nussenzweig A. The DNA damage- and transcription-associated protein paxip1 controls thymocyte development and emigration. Immunity. 2012;37:971–985. doi: 10.1016/j.immuni.2012.10.007. [DOI] [PMC free article] [PubMed] [Google Scholar]
- 9.Griewank K, Borowski C, Rietdijk S, Wang N, Julien A, Wei DG, Mamchak AA, Terhorst C, Bendelac A. Homotypic interactions mediated by Slamf1 and Slamf6 receptors control NKT cell lineage development. Immunity. 2007;27:751–762. doi: 10.1016/j.immuni.2007.08.020. [DOI] [PMC free article] [PubMed] [Google Scholar]
- 10.Wei DG, Lee H, Park SH, Beaudoin L, Teyton L, Lehuen A, Bendelac A. Expansion and long-range differentiation of the NKT cell lineage in mice expressing CD1d exclusively on cortical thymocytes. J Exp Med. 2005;202:239–248. doi: 10.1084/jem.20050413. [DOI] [PMC free article] [PubMed] [Google Scholar]
- 11.Kovalovsky D, Uche OU, Eladad S, Hobbs RM, Yi W, Alonzo E, Chua K, Eidson M, Kim HJ, Im JS, Pandolfi PP, Sant’Angelo DB. The BTB-zinc finger transcriptional regulator PLZF controls the development of invariant natural killer T cell effector functions. Nat Immunol. 2008;9:1055–1064. doi: 10.1038/ni.1641. [DOI] [PMC free article] [PubMed] [Google Scholar]
- 12.Savage AK, Constantinides MG, Han J, Picard D, Martin E, Li B, Lantz O, Bendelac A. The transcription factor PLZF directs the effector program of the NKT cell lineage. Immunity. 2008;29:391–403. doi: 10.1016/j.immuni.2008.07.011. [DOI] [PMC free article] [PubMed] [Google Scholar]
- 13.Savage AK, Constantinides MG, Bendelac A. Promyelocytic leukemia zinc finger turns on the effector T cell program without requirement for agonist TCR signaling. J Immunol. 2011;186:5801–5806. doi: 10.4049/jimmunol.1100119. [DOI] [PMC free article] [PubMed] [Google Scholar]
- 14.Kovalovsky D, Alonzo ES, Uche OU, Eidson M, Nichols KE, Sant’Angelo DB. PLZF induces the spontaneous acquisition of memory/effector functions in T cells independently of NKT cell-related signals. J Immunol. 2010;184:6746–6755. doi: 10.4049/jimmunol.1000776. [DOI] [PubMed] [Google Scholar]
- 15.Benlagha K, Kyin T, Beavis A, Teyton L, Bendelac A. A thymic precursor to the NK T cell lineage. Science. 2002;296:553–555. doi: 10.1126/science.1069017. [DOI] [PubMed] [Google Scholar]
- 16.Benlagha K, Wei DG, Veiga J, Teyton L, Bendelac A. Characterization of the early stages of thymic NKT cell development. J Exp Med. 2005;202:485–492. doi: 10.1084/jem.20050456. [DOI] [PMC free article] [PubMed] [Google Scholar]
- 17.Constantinides MG, Bendelac A. Transcriptional regulation of the NKT cell lineage. Curr Opin Immunol. 2013 doi: 10.1016/j.coi.2013.01.003. [DOI] [PMC free article] [PubMed]
- 18.Matsuda JL, Zhang Q, Ndonye R, Richardson SK, Howell AR, Gapin L. T-bet concomitantly controls migration, survival, and effector functions during the development of Valpha14i NKT cells. Blood. 2006;107:2797–2805. doi: 10.1182/blood-2005-08-3103. [DOI] [PMC free article] [PubMed] [Google Scholar]
- 19.Townsend MJ, Weinmann AS, Matsuda JL, Salomon R, Farnham PJ, Biron CA, Gapin L, Glimcher LH. T-bet regulates the terminal maturation and homeostasis of NK and Valpha14i NKT cells. Immunity. 2004;20:477–494. doi: 10.1016/s1074-7613(04)00076-7. [DOI] [PubMed] [Google Scholar]
- 20.Jones ME, Zhuang Y. Acquisition of a functional T cell receptor during T lymphocyte development is enforced by HEB and E2A transcription factors. Immunity. 2007;27:860–870. doi: 10.1016/j.immuni.2007.10.014. [DOI] [PMC free article] [PubMed] [Google Scholar]
- 21.Jones-Mason ME, Zhao X, Kappes D, Lasorella A, Iavarone A, Zhuang Y. E protein transcription factors are required for the development of CD4(+) lineage T cells. Immunity. 2012;36:348–361. doi: 10.1016/j.immuni.2012.02.010. [DOI] [PMC free article] [PubMed] [Google Scholar]
- 22.Kee BL. E and ID proteins branch out. Nat Rev Immunol. 2009;9:175–184. doi: 10.1038/nri2507. [DOI] [PubMed] [Google Scholar]
- 23.Rivera RR, Johns CP, Quan J, Johnson RS, Murre C. Thymocyte selection is regulated by the helix-loop-helix inhibitor protein, Id3. Immunity. 2000;12:17–26. doi: 10.1016/s1074-7613(00)80155-7. [DOI] [PubMed] [Google Scholar]
- 24.Bain G, Cravatt CB, Loomans C, Alberola-Ila J, Hedrick SM, Murre C. Regulation of the helix-loop-helix proteins, E2A and Id3, by the Ras-ERK MAPK cascade. Nat Immunol. 2001;2:165–171. doi: 10.1038/84273. [DOI] [PubMed] [Google Scholar]
- 25.Engel I, Johns C, Bain G, Rivera RR, Murre C. Early thymocyte development is regulated by modulation of E2A protein activity. J Exp Med. 2001;194:733–745. doi: 10.1084/jem.194.6.733. [DOI] [PMC free article] [PubMed] [Google Scholar]
- 26.Walker JA, Barlow JL, McKenzie AN. Innate lymphoid cells - how did we miss them? Nat Rev Immunol. 2013;13:75–87. doi: 10.1038/nri3349. [DOI] [PubMed] [Google Scholar]
- 27.Monticelli LA, Yang Y, Knell J, D’Cruz LM, Cannarile MA, Engel I, Kronenberg M, Goldrath AW. Transcriptional regulator Id2 controls survival of hepatic NKT cells. Proc Natl Acad Sci U S A. 2009;106:19461–19466. doi: 10.1073/pnas.0908249106. [DOI] [PMC free article] [PubMed] [Google Scholar]
- 28.Alonzo ES, Gottschalk RA, Das J, Egawa T, Hobbs RM, Pandolfi PP, Pereira P, Nichols KE, Koretzky GA, Jordan MS, Sant’Angelo DB. Development of promyelocytic zinc finger and ThPOK-expressing innate gamma delta T cells is controlled by strength of TCR signaling and Id3. J Immunol. 2010;184:1268–1279. doi: 10.4049/jimmunol.0903218. [DOI] [PMC free article] [PubMed] [Google Scholar]
- 29.Ueda-Hayakawa I, Mahlios J, Zhuang Y. Id3 restricts the developmental potential of gamma delta lineage during thymopoiesis. J Immunol. 2009;182:5306–5316. doi: 10.4049/jimmunol.0804249. [DOI] [PMC free article] [PubMed] [Google Scholar]
- 30.Verykokakis M, Boos MD, Bendelac A, Adams EJ, Pereira P, Kee BL. Inhibitor of DNA binding 3 limits development of murine slam-associated adaptor protein-dependent “innate” gammadelta T cells. PLoS One. 2010;5:e9303. doi: 10.1371/journal.pone.0009303. [DOI] [PMC free article] [PubMed] [Google Scholar]
- 31.Verykokakis M, Boos MD, Bendelac A, Kee BL. SAP protein-dependent natural killer T-like cells regulate the development of CD8(+) T cells with innate lymphocyte characteristics. Immunity. 2010;33:203–215. doi: 10.1016/j.immuni.2010.07.013. [DOI] [PMC free article] [PubMed] [Google Scholar]
- 32.Niola F, Zhao X, Singh D, Castano A, Sullivan R, Lauria M, Nam HS, Zhuang Y, Benezra R, Di Bernardo D, Iavarone A, Lasorella A. Id proteins synchronize stemness and anchorage to the niche of neural stem cells. Nat Cell Biol. 2012;14:477–487. doi: 10.1038/ncb2490. [DOI] [PMC free article] [PubMed] [Google Scholar]
- 33.Pan L, Sato S, Frederick JP, Sun XH, Zhuang Y. Impaired immune responses and B-cell proliferation in mice lacking the Id3 gene. Mol Cell Biol. 1999;19:5969–5980. doi: 10.1128/mcb.19.9.5969. [DOI] [PMC free article] [PubMed] [Google Scholar]
- 34.Dias S, Månsson R, Gurbuxani S, Sigvardsson M, Kee BL. E2A proteins promote development of lymphoid-primed multipotent progenitors. Immunity. 2008;29:217–227. doi: 10.1016/j.immuni.2008.05.015. [DOI] [PMC free article] [PubMed] [Google Scholar]
- 35.Heng TS, Painter MW, Consortium IGP. The Immunological Genome Project: networks of gene expression in immune cells. Nat Immunol. 2008;9:1091–1094. doi: 10.1038/ni1008-1091. [DOI] [PubMed] [Google Scholar]
- 36.Nichols KE, Hom J, Gong SY, Ganguly A, Ma CS, Cannons JL, Tangye SG, Schwartzberg PL, Koretzky GA, Stein PL. Regulation of NKT cell development by SAP, the protein defective in XLP. Nat Med. 2005;11:340–345. doi: 10.1038/nm1189. [DOI] [PMC free article] [PubMed] [Google Scholar]
- 37.Bain G, Quong MW, Soloff RS, Hedrick SM, Murre C. Thymocyte maturation is regulated by the activity of the helix-loop-helix protein, E47. J Exp Med. 1999;190:1605–1616. doi: 10.1084/jem.190.11.1605. [DOI] [PMC free article] [PubMed] [Google Scholar]
- 38.Drennan MB, Franki AS, Dewint P, Van Beneden K, Seeuws S, van de Pavert SA, Reilly EC, Verbruggen G, Lane TE, Mebius RE, Deforce D, Elewaut D. Cutting edge: the chemokine receptor CXCR3 retains invariant NK T cells in the thymus. J Immunol. 2009;183:2213–2216. doi: 10.4049/jimmunol.0901213. [DOI] [PubMed] [Google Scholar]
- 39.Raberger J, Schebesta A, Sakaguchi S, Boucheron N, Blomberg KE, Berglöf A, Kolbe T, Smith CI, Rülicke T, Ellmeier W. The transcriptional regulator PLZF induces the development of CD44 high memory phenotype T cells. Proc Natl Acad Sci U S A. 2008;105:17919–17924. doi: 10.1073/pnas.0805733105. [DOI] [PMC free article] [PubMed] [Google Scholar]
- 40.Cohen NR, Brennan PJ, Shay T, Watts GF, Brigl M, Kang J, Brenner MB, Monach P, Shinton SA, Hardy RR, Jianu R, Koller D, Collins J, Gazit R, Garrison BS, Rossi DJ, Narayan K, Sylvia K, Fletcher A, Elpek K, Bellemare-Pelletier A, Malhotra D, Turley S, Best AJ, Knell J, Goldrath A, Jojic V, Regev A, Cohen N, Brennan P, Brenner M, Kreslavsky T, Bezman NA, Sun JC, Kim CC, Lanier LL, Miller J, Brown B, Merad M, Gautier EL, Jakubzick C, Randolph GJ, Kim F, Rao TN, Wagers A, Heng T, Painter M, Ericson J, Davis S, Ergun A, Mingueneau M, Mathis D, Benoist C, Consortium IP. Shared and distinct transcriptional programs underlie the hybrid nature of iNKT cells. Nat Immunol. 2013;14:90–99. doi: 10.1038/ni.2490. [DOI] [PMC free article] [PubMed] [Google Scholar]
- 41.Constantinides MG, Picard D, Savage AK, Bendelac A. A naive-like population of human CD1d-restricted T cells expressing intermediate levels of promyelocytic leukemia zinc finger. J Immunol. 2011;187:309–315. doi: 10.4049/jimmunol.1100761. [DOI] [PMC free article] [PubMed] [Google Scholar]
- 42.Qi Q, Kannan AK, August A. Tec family kinases: Itk signaling and the development of NKT αβ and γδ T cells. FEBS J. 2011;278:1970–1979. doi: 10.1111/j.1742-4658.2011.08074.x. [DOI] [PubMed] [Google Scholar]
- 43.Felices M, Berg LJ. The Tec kinases Itk and Rlk regulate NKT cell maturation, cytokine production, and survival. J Immunol. 2008;180:3007–3018. doi: 10.4049/jimmunol.180.5.3007. [DOI] [PubMed] [Google Scholar]
- 44.Guo Z, Dose M, Kovalovsky D, Chang R, O’Neil J, Look AT, von Boehmer H, Khazaie K, Gounari F. Beta-catenin stabilization stalls the transition from double-positive to single-positive stage and predisposes thymocytes to malignant transformation. Blood. 2007;109:5463–5472. doi: 10.1182/blood-2006-11-059071. [DOI] [PMC free article] [PubMed] [Google Scholar]
- 45.Sharma A, Chen Q, Nguyen T, Yu Q, Sen JM. T cell factor-1 and β-catenin control the development of memory-like CD8 thymocytes. J Immunol. 2012;188:3859–3868. doi: 10.4049/jimmunol.1103729. [DOI] [PMC free article] [PubMed] [Google Scholar]
- 46.Boos MD, Yokota Y, Eberl G, Kee BL. Mature natural killer cell and lymphoid tissue-inducing cell development requires Id2-mediated suppression of E protein activity. J Exp Med. 2007;204:1119–1130. doi: 10.1084/jem.20061959. [DOI] [PMC free article] [PubMed] [Google Scholar]
- 47.Yang CY, Best JA, Knell J, Yang E, Sheridan AD, Jesionek AK, Li HS, Rivera RR, Lind KC, D’Cruz LM, Watowich SS, Murre C, Goldrath AW. The transcriptional regulators Id2 and Id3 control the formation of distinct memory CD8+ T cell subsets. Nat Immunol. 2011;12:1221–1229. doi: 10.1038/ni.2158. [DOI] [PMC free article] [PubMed] [Google Scholar]
- 48.Seiler MP, Mathew R, Liszewski MK, Spooner C, Barr K, Meng F, Singh H, Bendelac A. Elevated and sustained expression of the transcription factors Egr1 and Egr2 controls NKT lineage differentiation in response to TCR signaling. Nat Immunol. 2012;13:264–271. doi: 10.1038/ni.2230. [DOI] [PMC free article] [PubMed] [Google Scholar]
- 49.Dear TN, Hainzl T, Follo M, Nehls M, Wilmore H, Matena K, Boehm T. Identification of interaction partners for the basic-helix-loop-helix protein E47. Oncogene. 1997;14:891–898. doi: 10.1038/sj.onc.1200912. [DOI] [PubMed] [Google Scholar]
- 50.Lai D, Zhu J, Wang T, Hu-Li J, Terabe M, Berzofsky JA, Clayberger C, Krensky AM. KLF13 sustains thymic memory-like CD8(+) T cells in BALB/c mice by regulating IL-4-generating invariant natural killer T cells. J Exp Med. 2011;208:1093–1103. doi: 10.1084/jem.20101527. [DOI] [PMC free article] [PubMed] [Google Scholar]
- 51.Weinreich MA, Odumade OA, Jameson SC, Hogquist KA. T cells expressing the transcription factor PLZF regulate the development of memory-like CD8+ T cells. Nat Immunol. 2010;11:709–716. doi: 10.1038/ni.1898. [DOI] [PMC free article] [PubMed] [Google Scholar]
- 52.Felices M, Yin CC, Kosaka Y, Kang J, Berg LJ. Tec kinase Itk in gammadeltaT cells is pivotal for controlling IgE production in vivo. Proc Natl Acad Sci U S A. 2009;106:8308–8313. doi: 10.1073/pnas.0808459106. [DOI] [PMC free article] [PubMed] [Google Scholar]
Associated Data
This section collects any data citations, data availability statements, or supplementary materials included in this article.