

Abstract
Objectives
It can be clinically difficult to distinguish depressed individuals with bipolar disorder (BD) and major depressive disorder (MDD). To examine potential biomarkers of difference between the two disorders, the current study examined differences in the functioning of emotion processing neural regions during a dynamic emotional faces task.
Methods
During functional magnetic resonance imaging, healthy control adults (HC) (n = 29) and depressed adults with MDD (n = 30) and BD (n = 22) performed an implicit emotional-faces task in which they identified a color label superimposed on neutral faces that dynamically morphed into one of four emotional faces (angry, fearful, sad, happy). We compared neural activation between the groups in an amygdala region-of-interest and at the whole brain level.
Results
Adults with MDD showed significantly greater activity than adults with BD in the left amygdala to the anger condition (p = 0.01). Results of whole brain analyses (at p < 0.005, k ≥ 20) revealed that adults with BD showed greater activity to sad faces in temporoparietal regions, primarily in the left hemisphere, whereas individuals with MDD demonstrated greater activity than those with BD to displays of anger, fear, and happiness. Many of the observed BD–MDD differences represented abnormalities in functioning compared to HC.
Conclusions
We observed a dissociation between depressed adults with BD and MDD in the processing of emerging emotional faces. Those with BD showed greater activity during mood-congruent (i.e., sad) faces, whereas, those with MDD showed greater activity for mood-incongruent (i.e., fear, anger, and happy) faces. Such findings may reflect markers of differences between BD and MDD depression in underlying pathophysiological processes.
Keywords: amygdala, bipolar disorder, brain imaging, emotion processing, major depressive disorder, whole brain
Major depressive disorder (MDD) and bipolar disorder (BD) can be difficult to distinguish clinically, particularly during depressive episodes. Indeed, up to 12.5% of individuals initially diagnosed with MDD will develop a manic or hypomanic episode during the 11-year period following diagnoses (1), and up to 19% of patients hospitalized with MDD experience at least one full manic episode within 15 years (2). Given that individuals with an underlying bipolar illness have, by definition, a trait-like propensity to experience a future manic episode whereas individuals with unipolar depression do not, there are likely to be identifiable differences between these sets of individuals in the underlying pathophysiology of their illnesses. As such, this propensity may be present regardless of the individual’s current illness state. If markers of this propensity can be identified during a depressive episode, e.g., by identifying differences in brain function, such markers could be expected to have enormous clinical utility given the difficulty in distinguishing between the two disorders when an individual presents in a depressed state.
Both the research agenda for DSM-V and the National Institute of Mental Health’s Research Domain Criteria initiative emphasize a need to translate clinical neuroscience research into a new classification system for psychiatric disorders based upon pathophysiologic processes (3, 4). Identifying reliable biomarkers associated with bipolarity is a first step towards this goal and would help to identify individuals with BD as early as possible in illness course. In order to advance this aim, neuroimaging techniques can be used to examine distinctions between MDD and BD in the functioning of neural circuitry supporting key processes (e.g., emotion processing) that are known to be dysfunctional in the two conditions. Identifying reliable neuroimaging-derived markers of differences in the functioning of emotion regulation systems between those with BD and MDD would provide important information about the ways in which emotional stimuli are processed in these two disorders. Delvecchio and colleagues (5) recently conducted a meta-analysis of functional magnetic resonance imaging (fMRI) studies of emotion processing in individuals with MDD and BD. The mood states of the patient samples in the studies (i.e., depressed, remitted, or manic) varied across the reviewed papers, and of the 20 studies reviewed, only two directly compared patients with each diagnosis. The remaining studies compared one of the diagnostic groups with healthy control participants (HC). The authors estimated that BD showed greater activity than MDD patients in the parahippocampal gyrus extending to the amygdala, the ventral anterior cingulate gyrus, and the left pulivnar nucleus of the thalamus, while MDD patients showed greater activity in the dorsal anterior cingulate gyrus.
The Delvecchio et al. study (5) highlights the dearth of research directly comparing MDD and BD groups regarding neural activity to stimuli depicting facial displays of emotion [see (6) for a comprehensive review of structural and functional studies comparing MDD and BD]. To our knowledge, only four studies have examined this issue (7–10). One study of patients with BD who were in remission (7) focused on between-group differences in effective connectivity to happy and sad facial expressions, however, exploratory analyses revealed group differences in amygdala activity during the sad emotional condition. This finding was corroborated in a subsequent study (8) that examined amygdala activity to static emotional faces of varying intensity. Greater activity was shown by depressed BD than by depressed MDD individuals in the left amygdala to mild sad faces only. This effect was not obtained for intense sad faces. Another study (9) examined differences in whole brain neural activity in depressed MDD and remitted BD individuals who had elevated subsyndromal depressive symptoms. Remitted BD had greater activity than MDD depressed individuals to fearful, happy, and sad expressions in several subcortical regions, as well as in the ventral prefrontal cortex (Brodmann’s area 47). By contrast, MDD depressed showed greater activity than remitted BD individuals only in the right putamen to sad faces. Finally, a recent study (10) used a machine learning approach to distinguish the two groups and reported accuracies of up to 90% in distinguishing the groups on the basis of neural activity in emotion processing regions during a passive face viewing paradigm. Several regions of the emotion-processing network contributed to classification accuracy, but one of the clearest findings from this study concerned differential activity in the amygdala. Patients with unipolar depression displayed greater activity to negative facial expressions than to positive expressions, whereas the reverse was true for individuals with bipolar depression.
Although unipolar and bipolar depression both involve dysregulations in emotion, there have been remarkably few prior studies that have directly compared the two conditions during emotion processing. Taken together, the studies that have been conducted suggest greater activity in BD relative to MDD individuals in subcortical limbic regions, with some convergence of findings showing greater response to sad facial expressions in BD than in MDD depressed individuals. In the present study, we aimed to replicate and extend earlier findings in the following ways. First, previous studies used static images of facial displays that varied in intensity of emotion. In the present study, we employed more ecologically valid stimuli in which a video of facial display dynamically morphed over a one-second interval from 0% emotion (neutral) to 100% emotional intensity. These stimuli mimic more closely the real-world experience of witnessing changes in facial displays of emotion during a social encounter. In addition, we examined neural activity in BD and MDD depressed individuals (all in a depressive episode), and HC participants, to facial displays of anger, as well as displays of happiness, fear and sadness. To our knowledge, this is the first such study to compare neural activity to angry facial displays in BD and MDD individuals. In two prior reports (11, 12) we used a subsample of the data analyzed below (from the HC and MDD groups) to examine individual differences in neural activity as a function of lifetime levels of threshold and subthreshold psychopathology and to examine patterns of cortical–subcortical connectivity. To date, no study has directly compared MDD and BD depressed individuals using dynamic emotional faces.
Given the difficulties in distinguishing between BD and MDD depressed individuals when they present in a depressive episode, the primary aim of this study was to examine differences between BD and MDD depressed individuals in neural activity to emotional facial displays. Any observed differences, if replicated, could have important implications for understanding pathophysiologic processes underlying each depression type, regardless of whether the neural activity observed in the groups differs from what is expected from healthy controls. Following both Almeida et al. (8) and Lawrence et al. (9), we focused the analyses on between group differences in amygdala and whole brain activity. We hypothesized that BD depressed individuals would show significantly greater activity than would MDD depressed individuals in amygdala, other subcortical limbic, and ventral prefrontal cortical regions, predominantly to emerging sad facial displays. Given the lack of prior studies examining neural activity to angry faces, we did not make any a priori hypotheses for this condition. As a secondary aim, we examined which of the observed BD/MDD differences represented abnormalities in function compared to HC.
Materials and methods
Participants
We recruited 91 right-handed, native English-speaking individuals: 36 currently depressed adults diagnosed with MDD, 24 currently depressed adults diagnosed with BD, and 31 healthy control participants (HC) with no personal or family history of psychiatric illness. Adults with MDD were carefully screened to ensure that they did not meet diagnostic criteria for BD. Psychiatric diagnoses were made using the Structured Clinical Interview for Psychiatric Disorders (SCID-P) (13). Exclusion criteria were: history of head injury (from medical records and participant report), systemic medical illness, cognitive impairment (score < 24 Mini-Mental State Examination) (14), premorbid IQ estimate < 85 (National Adult Reading Test) (15), Axis-II borderline personality disorder, standard magnetic resonance imaging (MRI) exclusion criteria (e.g., presence of metallic objects in the body), and having met criteria for an alcohol/substance use disorder within two months before the scan. For HC, additional exclusion criteria included current/previous alcohol or substance abuse/dependence (determined by SCID-P, saliva and urine screen), and any personal or family history of Axis I disorder. Six depressed participants were excluded (three for movement spikes > 2 mm; two for < 75% color labeling accuracy; one for scoring 2.5 standard deviations above the mean level of depression severity); two BD participants and two HC were excluded because of movement spikes > 2 mm. The final sample included 30 adults with MDD, 22 adults with BD, and 29 HC (Table 1). The study protocol was approved by the University of Pittsburgh Institutional Review Board (Pittsburgh, PA, USA). After complete description of the study to participants, written informed consent was obtained.
Table 1.
Demographic and clinical characteristics
| Variable | BD (n = 22) | MDD (n = 30) | Statistic | p-value | HC (n = 29) | Effect of group | Contrasts |
|---|---|---|---|---|---|---|---|
| Sex, female (%) | 86 | 73 | χ2 = 1.29 | 0.26 | 59 | X = 4.81, p = 0.09 | |
| Education (% degree)a | 41 | 60 | χ2 = 1.85 | 0.17 | 66 | X = 3.29, p = 0.19 | |
| Age, mean (SD) | 34.0 (8.2) | 30.3 (7.6) | t = 1.71 | 0.09 | 32.5 (6.3) | F = 1.74, p= 0.18 | |
| HRSD score, mean (SD) | 19.7 (6.1) | 21.1 (3.7) | t = 1.01 | 0.32 | 1.4 (2.2) | F = 200.44, p < 0.001 | BD > HCb MDD > HCb |
| YMRS score, mean (SD) | 4.0 (2.6) | 3.9 (2.3) | t = 0.26 | 0.79 | 0.5 (1.2) | F = 25.42, p < 0.001 | BD > HCb MDD > HCb |
| State anxiety, mean (SD) | 55.8 (11.0) | 56.6 (8.0) | t = 0.31 | 0.76 | 25.9 (6.9) | F = 116.95, p < 0.001 | BD > HCb MDD > HCb |
| Behavioral | |||||||
| Accuracy | 92.6% (7.3%) | 94.5% (5.3%) | t = 1.08 | 0.29 | 95.9% (3.2%) | F = 2.35, p = 0.10 | |
| Reaction time | 991.1 (153.2) | 953.4 (147.9) | t = 0.89 | 0.38 | 933.4 (103.5) | F = 1.15, p = 0.32 | |
| History of substance abuse/dependence (%) | 50 | 30 | χ2 = 2.15 | 0.14 | n/a | ||
| History of anxiety disorder (%) | 73 | 63 | χ2 = 0.51 | 0.48 | n/a | ||
| Medications (%) | |||||||
| Antidepressant | 45 | 67 | χ2 = 2.34 | 0.13 | n/a | ||
| Antipsychotic | 55 | 7 | χ2 = 14.79 | < 0.001 | n/a | ||
| Mood stabilizer | 64 | 10 | χ2 = 16.59 | < 0.001 | n/a | ||
| Benzodiazepine | 14 | 23 | χ2 = 0.77 | 0.38 | n/a | ||
| Duration, years, mean (SD) | 16.2 (7.5) | 12.8 (7.7) | t = 1.61 | 0.12 | n/a | ||
| No. of episodes, mean (SD) | 5.3 (2.3) | 3.0 (1.1) | t = 4.83 | < 0.001 | n/a | ||
BD = bipolar disorder; MDD = major depressive disorder; HC = healthy controls; HRSD = Hamilton Rating Scale for Depression; YMRS = Young Mania Rating Scale; SD = standard deviation.
Post-secondary degree.
p < 0.001.
Clinical measures
Depression symptom severity was assessed using the 17-item Hamilton Rating Scale for Depression (HRSD) (16). Manic symptoms were assessed using the Young Mania Rating Scale (YMRS) (17). Clinical and demographic information was collected through self-report questionnaires and clinical interview using the SCID-P. Participants also completed the Spielberger State Anxiety Inventory (18).
Paradigm
Participants completed a 12.5-minute emotional dynamic faces task during fMRI. Stimuli comprised faces from the NimStim set (19) that were morphed in 5% increments, from neutral (0% emotion) to 100% emotion for four emotions: happy, sad, angry, and fear (Fig. 1). Morphed faces were collated into one-sec movies progressing from 0% to 100% emotional display. In control trials, movies comprised a simple shape (dark oval) superimposed on a light-grey oval, with similar structural characteristics to the face stimuli, which subsequently morphed into a larger shape, approximating the movement of the morphed faces. There were three blocks for each of the four emotional conditions, with twelve stimuli per block, and six control blocks with six stimuli per block. Emotional and control blocks were presented in a pseudorandomized order so that no two blocks of any condition were presented sequentially. Participants were asked to use one of three fingers to press a button indicating the color of a semi-transparent foreground color flash (orange, blue, or yellow) that appeared during the mid-200–650 msec of the one-sec presentation of the dynamically-changing face. The emotional faces were task-irrelevant and, thus, were processed implicitly.
Fig. 1.

The top panel presents a fear trial of the dynamic emotional faces task. Over a one-sec duration, the participants viewed a movie of a face that changed in 5% increments from neutral (0% emotion) to a happy, sad, angry, or fearful (100% emotion) face. The bottom panel represents the changing shape condition, which was used as the baseline condition. In both cases, participants were asked to identify the color flash presented in the middle of the dynamic change.
Data acquisition
Neuroimaging data were collected using a 3.0 Tesla Siemens Trio MRI scanner at the Magnetic Resonance Research Center in the University of Pittsburgh Medical Center. Structural three-dimensional axial MPRAGE images were acquired in the same session [repetition time (TR)/echo time (TE) = 2200/3.29 msec, flip angle = 9°, field of view (FOV) = 256 × 192 mm2, slice thickness = 1 mm, matrix = 256 × 256, 192 continuous slices]. BOLD images were then acquired with a gradient echo EPI sequence during approximately thirteen minutes (378 successive brain volumes) covering 39 axial slices (3.2 mm thick, TR/TE = 2000/28 msec, FOV = 205 × 205 mm2, matrix = 64 × 64, flip angle = 90°).
Behavioral data analyses
Behavioral, demographic, and clinical variable data were analyzed in two stages. To address the primary aim of the paper, variables were first compared between BD and MDD groups (using t-test and chi-squared statistics). To assess deviation from what would be expected from HC, values on each variable were subsequently compared among the three groups (BD, MDD, HC).
Functional neuroimaging data preprocessing
Data were preprocessed and analyzed with statistical parametric mapping software (SPM8; http://www.fil.ion.ucl.ac.uk/spm). During preprocessing, data were corrected for differences in acquisition time between slices, co-registered, realigned, resampled to 2 × 2 × 2 mm3 voxels, spatially normalized into standard stereotactic space [Montreal Neurologic Institute (MNI)], and spatially smoothed using a 6-mm FWHM Gaussian kernel. A first-level fixed-effect model was constructed in which each of the four emotion conditions (anger, fear, sad, happy) were entered as separate conditions in a block design, and the shape condition, which served as the baseline in the design matrix, was subtracted from each. Movement parameters from the preprocessing procedure were entered as covariates of no interest to control for subject movement. Trials were modeled with the Canonical Hemodynamic Response Function. The four emotion contrasts (i.e., anger–minus–shape, fear–minus–shape, sad–minus–shape, and happy–minus–shape) were entered into second-level analyses.
Statistical analyses
The primary analyses consisted of voxelwise, 2 (group: MDD, BD) × 4 (emotion) ANOVAs in left and right amygdala ROIs and at the whole brain level. These analyses were conducted using SPM8 software. In the event of significant interaction effects, data were extracted from the activated clusters, and post-hoc between-group tests were performed using SAS 9.3 (SAS Institute Inc., Cary, NC, USA) to determine the specific emotional conditions for which there were significant between-group differences in neural activity. All contrasts reported below were two-tailed unless otherwise noted.
Region-of-interest analyses (ROI)
We estimated a second-level, voxelwise, group-by-emotion ANOVA to identify neural activity in right and left a-priori amygdala ROIs, as defined in the Wake Forest Toolbox PickAtlas Talairach Daemon template (20). To control for multiple statistical testing we maintained a cluster-level false positive detection rate at p < 0.05 by using a voxel threshold of p < 0.05 with a cluster (k) extent empirically determined by Monte Carlo simulations implemented in AlphaSim of 26 voxels, computed separately for left and right amygdalae. This well-validated technique accounts for spatial correlations between blood oxygen level dependent (BOLD) signal changes in neighboring voxels (21).
Whole brain analyses
We estimated a second-level, voxelwise group-by-emotion ANOVA at the whole brain level. To control for multiple voxelwise tests, we followed the recommendations of Lieberman and Cunningham (22) and set a threshold of p < 0.005 and a minimum cluster (k) extent of 20 voxels.
Exploratory comparisons with healthy controls
The primary aim of this study was the comparison between the two depressed patient samples, and our primary hypothesis concerned differences between these two groups. In order to provide information regarding the extent to which observed MDD and BD differences represented abnormal neural functioning, in a second series of analyses, we included data from HC. We focused only on those conditions to which there were significant differences in activity between MDD and BD individuals. Here, for each region demonstrating a significant difference in activity between MDD and BD individuals, we extracted data from the same clusters in the HC individuals, and conducted one-tailed t-tests to determine which of the two patient groups (MDD or BD) demonstrated differences relative to HC.
Results
Demographics
Demographic information for the BD, MDD, and HC groups are reported in Table 1. The two patient groups differed from one another at p < 0.10 on four demographic/clinical characteristics. Participants with BD were older, experienced a greater number of previous episodes of illness, and a higher proportion were taking antipsychotic and mood stabilizing medications (Table 1). As expected, HC reported significantly fewer symptoms of depression, mania/hypomania, and anxiety than did the two patient groups (Table 1). The ratio of males to females was more balanced in the HC compared to the MDD and BD groups. Regarding history of alcohol and substance abuse among the patient samples, although the minimum duration of remission required for study entry was two months, the minimum observed in the patient sample was three months, and the median was 57 months (4.75 years).
Task performance
Mean color labeling accuracy and mean reaction time were calculated for each participant across all conditions. Overall, task accuracy was high (MDD = 95%, BD = 93%, HC = 96%). There were no significant effects of group with regard to accuracy or reaction times (Table 1).
Activity
ROI analysis
There was a significant group-by-emotion interaction in the left amygdala, k = 28 voxels, peak voxel F(3,200) = 3.97, p = 0.009 (Fig. 2). Post-hoc contrasts of extracted data from the activated cluster revealed that the interaction effect resulted from significantly greater activity for adults with MDD than for those with BD during the anger condition [t(31.6) = 2.72, p = 0.01; the Satterthwaite method was used due to inequality of variances]. None of the other emotion contrasts were significant (all |t|s < 1.82, all p > 0.07).
Fig. 2.
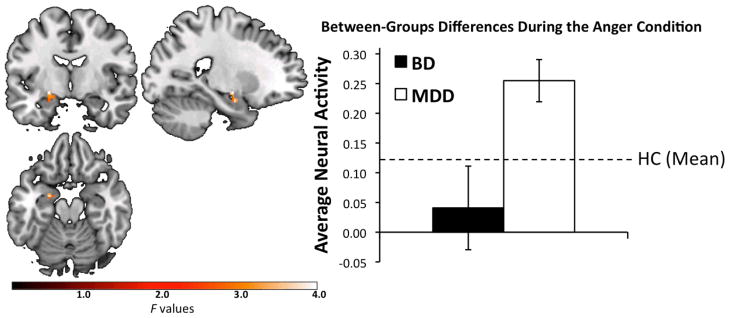
Significant group [depressed bipolar disorder (BD), depressed major depressive disorder (MDD)]-by-emotion (anger, fear, sad, happy) interaction in left amygdala, F(3,200) = 3.97, p = 0.009; k = 28 voxels, peak voxel (Montreal Neurologic Institute): x = −22, y = −8, z = −10. Plotted values represent F-statistics. The bar graph represents average activity to the anger condition, extracted from significant clusters. Error bars represent +/−1 standard error. The difference between the two groups is significant, t(31.6) = 2.72, p = 0.01; The Satterthwaite method was used due to inequality of variances. The dashed line is provided for reference, and represents mean left amygdala activity to the anger condition for healthy control (HC) participants.
We conducted two types of secondary analyses regarding activity in the left amygdala. First, we evaluated whether the four variables that differed between the two conditions at p < 0.10, age, number of prior episodes, antipsychotic medications, mood stabilizers, see Table 1, could account for the observed effects. After entering all four of these variables into the second-level, voxelwise model, the group-by-emotion interaction effect remained significant in the left amygdala, k = 29 voxels, peak voxel F(3,196) = 4.00, p = 0.009. Again, this effect was driven by greater activity in the MDD than the BD group to the anger condition. None of the four covariates in this model were significantly associated with activity in the amygdala (all k ≤ 10).
Second, to understand whether the MDD-BD difference in amygdala activity to the anger condition reflected abnormality in function, we extracted data from the HC participants in the 28-voxel region of the left amygdala described above. The MDD group displayed greater activity to the anger condition than did HC, t(57) = 2.44, p = 0.009 (one-tailed). The HC and BD groups did not differ, t(49) = 1.05, p = 0.15 (one-tailed). Controlling for the effect of gender did not change the pattern of significant results.
Whole brain analysis
Twelve regions from the voxelwise whole brain analyses displayed a significant group-by-emotion interaction effect (Table 2). These were located in bilateral regions involved, predominantly, in visuospatial processing: left fusiform, right occipital, parietal, and anterior cingulate cortices, as well as bilateral insula and bilateral temporal cortical regions. Analysis of extracted data from these twelve regions revealed that these interactions resulted from significantly greater activity in the BD than the MDD group to the sad condition (Table 2, Fig. 3), and from significantly greater activity in the MDD than the BD group during the anger, fear and happy conditions. Regions in which the BD group displayed greater activity than the MDD group to the sad condition comprised mainly left-sided middle and superior temporal, parietal cortices, and insula, in addition to smaller clusters in right-sided anterior cingulate, temporal and parietal cortices, and insula. In each of these regions, the MDD group showed significantly greater activity than the BD group to one or more of the other emotional conditions.
Table 2.
Whole brain results
| Peak voxel | K | Kc | MNI space | Location | BD > MDD | MDD > BD | ||||||
|---|---|---|---|---|---|---|---|---|---|---|---|---|
|
|
|
|
||||||||||
| F | p-value | x | y | z | Sad | Anger | Fear | Happy | ||||
| 8.61 | < 0.001 | 128 | 121 | −58 | −52 | 2 | L MTG, STG | BA 21/22/39 | 2.94** | 2.90** | ||
| 6.35 | < 0.001 | 90 | 87 | −46 | −16 | −4 | L MTG, STG | BA 21/22 | 2.75** | 2.11* | 2.13* | |
| 5.71 | 0.001 | 20 | 15 | −56 | −30 | 0 | L MTG | BA 22 | 2.33* | 2.58* | ||
| 7.78 | < 0.001 | 118 | 108 | −40 | −40 | 22 | L parietal, supramarginal, insula, STG | BA 22/40 | 2.80** | 2.60* | 2.81** | |
| 8.13 | < 0.001 | 26 | 25 | 12 | 32 | −6 | R anterior cingulate | BA 32 | 2.59* | 2.80** | ||
| 7.01 | < 0.001 | 64 | 55 | 56 | −38 | 22 | R inferior pareital lobule, supramarginal gyrus, STG, insula | BA 40 | 2.43* | |||
| 6.87 | < 0.001 | 54 | 48 | 42 | −52 | 4 | R MTG, STG | BA 39 | 2.52* | 2.43* | ||
| 5.72 | 0.001 | 22 | 18 | −38 | −40 | −18 | L fusiform | BA 37 | 2.11* | 3.72*** | ||
| 5.89 | 0.001 | 27 | 26 | −56 | −12 | 4 | L superior temporal gyrus | BA 22 | 2.39* | 2.10* | ||
| 6.91 | < 0.001 | 38 | 38 | 48 | −30 | 32 | R inferior parietal lobule, supramarginal gyrus | BA 40 | 2.85** | 2.14* | ||
| 6.76 | < 0.001 | 48 | 36 | 44 | −50 | 22 | R. inferior parietal lobule, angular, supramarginal, STG, MTG | BA 39/40 | 2.02* | 2.85** | ||
| 6.50 | < 0.001 | 65 | 49 | 22 | −84 | 2 | R calcarine, lingual, cuneus | BA 17 | 3.43** | 2.05* | ||
F-values refer to the group-by-emotion interaction. Values for the BD > MDD and MDD > BD comparisons represent t contrasts of average extracted activity. BD = bipolar disorder; MDD = major depressive disorder; MNI = Montreal Neurologic Institute; K = voxel extent; Kc = voxel extent after controlling for the four variables that differed between the two groups at p < 0.10 (age, number of prior illness episodes, antipsychotic medications, and mood stabilizers); MTG = middle temporal gyrus; STG = superior temporal gyrus; BA = Brodmann’s area.
p < 0.05,
p < 0.01,
p < 0.001.
Fig. 3.

Panel A displays areas demonstrating significant group [depressed bipolar disorder (BD), depressed major depressive disorder (MDD)]-by-emotion (anger, fear, sad, happy) interactions in left temporoparietal regions in which individuals with BD displayed greater activity than individuals with MDD to sad faces. Plotted values represent F-statistics. Panel B displays bar graphs representing average activity for the sad condition, extracted from the clusters presented in Panel A. Peak values (Montreal Neurologic Institute) from each of the regions are as follows: Region a: x = −58, y = −52, z = 2; Region b: x = −56, y = −30, z = 0; Region c: x = −46, y = −16, z = −4; Region d: x = −40, y = −40, z=22. Error bars represent +/−1 standard error.
In addition to the regions noted above, Table 2 also reports several other areas in which the MDD group showed significantly greater activity to the anger, fear, and/or happy conditions, including bilateral occipital and temporal, and right-sided parietal, cortical regions.
When the four variables differing at p < 0.10 between depressed groups were entered as covariates in a second-level, voxelwise ANCOVA model, the group-by-condition interaction remained significant, using the pre-specified criteria, for 10 of the 12 regions. The cluster size for the remaining two regions dropped to k = 18 and k = 15, respectively (Table 2). None of the covariates was significantly associated with activity in any of the twelve regions (all k ≤ 15).
Secondary analyses with HC were conducted on extracted data from the three groups in each of the 12 regions described above. Comparisons are displayed in Supplementary Table 1. The BD group showed greater activity relative to the HC group to the sad condition in left middle and superior temporal regions and in the right anterior cingulate. The BD group also displayed significantly reduced activity than HC in right temporal-parietal regions to the anger condition, in left temporal and right occipital regions to the fear condition, and in the left fusiform to happy faces. The MDD group showed greater activity than HC in bilateral temporoparietal regions and in right anterior cingulate cortex to the anger condition, and in left middle and superior temporal gyri and right parietal regions to the happy condition. The pattern of results did not change substantially when controlling for gender in the analyses.
Discussion
The goal of the current study was to examine differences in neural activity between depressed adults with BD and MDD during an emotion-processing task. One of the strengths of the study is that the stimuli incorporated naturalistic, dynamically changing displays of facial emotion. Contrary to our hypothesis, we did not observe greater amygdala activity to emerging displays of sadness in BD than in MDD individuals. We did, however, observe greater activity in BD individuals to sad faces in several temporoparietal regions, primarily in the left hemisphere. By contrast, we observed that MDD individuals displayed greater left amygdala activity to the anger condition than did those with BD. We also observed greater activity in MDD relative to BD depressed adults to anger, fearful, and happy faces in bilateral temporopareital areas, occipital regions, and right cingulate cortex. Taken together, these results indicate a dissociation between BD and MDD groups on the basis of neural response to emotional faces.
Our findings with regard to increased activity to sad facial displays among adults with BD are generally consistent with two prior studies from our laboratory (7, 8). Although we did not observe these findings in the amygdala, we did observe hyperactivations to sad facial stimuli in BD compared to MDD individuals in several regions supporting visuospatial processing (23, 24) and face perception (25–27). Several prior studies have similarly observed increased activity in visuospatial regions during the processing of emotional stimuli in both healthy controls and in patient samples (28–30). In fact, evidence from imaging (29) and lesion studies (30) suggests that the amygdala plays a crucial role in modulating activity in more distant visual and visuospatial regions. Taken together, these findings suggest that visuospatial and limbic regions may operate as an integrated network. The fact that we did not observe greater amygdala activity to sad faces in the present study may not be surprising. Almeida and colleagues (8) observed this relationship only for mild displays of sadness, but not for intense displays. The authors interpreted this discrepancy as representing differing levels of ambiguity, and they suggested that the amygdala might have responded more to mild over intense displays of sadness due to its role in processing ambiguous information. The stimuli used in the current study represented potentially less ambiguous, dynamically morphing faces that changed quickly from neutral to intense emotional displays.
In prior published work, individuals with MDD have been found to demonstrate increased attentional biases to angry faces, relative to healthy individuals (31). In the present study, we found that adults with MDD demonstrated greater amygdala activity to angry faces, as well as in several regions supporting visuo-spatial processing (relative both to BD and HC). Anger is a unique emotion in that it is negative and it is associated with approach motivation (32). Summers and colleagues (33) have reported that increased depression severity in BD is associated with a reduced ability to recognize dynamically changing facial displays of anger; however, unipolar and bipolar depressed individuals may not differ in their ability to recognize such stimuli (34). Given the amygdala’s role in processing salient emotional signals, which include potential threats (35, 36), our results may suggest that adults with MDD perceive these displays as more threatening than do BD individuals. As this was the first study to examine differences between BD and MDD in neural activity to angry faces, additional work will be needed to examine this effect more thoroughly. A previous study (37) reported that in comparison with healthy individuals, adults with MDD displayed reduced activity in lateral and medial orbitofrontal cortical regions to angry faces. A separate study (38) did not observe differences in orbitofrontal cortical activity between adults with MDD and HC to angry faces; however, it did report that individuals with a history of both MDD and suicide attempt displayed greater activity in lateral orbitofrontal regions relative to individuals with a history of MDD alone (38). In the current study, we did not observe differential activity in the orbitofrontal cortex. Given the importance of adequately accounting for individual differences in prior suicidality among depressed adults when examining activity in this region, the lack of observed differences in activity in this region may have been due to the design of the current study, which did not stratify on the basis of prior suicide attempt.
In their meta-analysis, Delvecchio and colleagues identified the ventral anterior cingulate cortex (vACC) as one of the regions that differs between MDD and BD individuals during emotion processing. In whole brain analyses, we identified a significant dissociation between the two groups in the processing of emotional information in a region of the vACC, however, the cluster of activity in the vACC observed in the current study is substantially more ventral (Talairach z = −6) compared to that identified by Delvecchio (Talairach z = 24), and is closer in proximity to regions that have been implicated as makers of response to treatments for MDD (39, 40). Future work might examine the role of activity in this region in the treatment of depression occurring in the context of BD.
The collection of results from the current and previous studies suggests that BD individuals may show increased neural activity (relative to MDD) in response to mood-congruent (sad) emotional information. By contrast individuals with MDD may show increased activity to mood-incongruent emotional displays of anger, and to a lesser extent, fear and happiness. Cognitive theories of depression (41) predict that depressed individuals will display biased information processing towards negatively valenced, mood congruent emotional stimuli in the environment. Indeed, behavioral studies of attentional biases tend to find that individuals with MDD show a biased allocation of attentional resources to stimuli representing negative emotions like sadness (42–44). Findings from fMRI studies are somewhat more equivocal, however. Whereas much prior work has reported increased activity to stimuli representing sadness in MDD (45–49) and decreased activity to displays of happiness (46, 49, 50), other studies have found the opposite and reported decreased activity to sadness (45, 51) and increased activity to happiness (45, 52, 53). There are at least two competing hypotheses regarding these results. One hypothesis holds that there is a direct correspondence between an increase in brain activation during stimulus presentation and a bias towards processing the kind of information contained in that stimulus. This view would predict increased neural activity to sad faces in unipolar depression given behavioral findings suggesting attentional and information processing biases to these kinds of stimuli. The alternative hypothesis holds that abnormally elevated brain activity represents inefficient processing of a stimulus, perhaps due to an incongruency with mood state or with expectations. This view would predict, for example, that representations of sad faces may be easier to process than those of happy faces for unipolar depressed participants, and thus would predict reduced brain activity for these stimuli in visuospatial and emotion processing regions. It is currently unclear from the state of the literature which of these two hypotheses is more accurate. The results of the current study clearly indicate a dissociation in the processing of emotional stimuli between unipolar and bipolar depressed participants. These differences in processing likely reflect differences in the pathophysiology of the two illnesses, however, more work will be needed to fully determine precisely how the observed patterns of neural activity relate to clinical, information processing, and treatment related measures.
Finally, for each emotional condition to which one of the depressed groups showed significantly greater neural activity compared to the other, secondary analyses showed comparable patterns of significantly different activity compared to HC. Observing differences in activity relative to HC (particularly when behavioral performance is unimpaired) suggests that the brain regions of the patient samples are functioning differently than those of HC in order to perform the same task. Thus, the present findings suggest that patterns of neural activity that differentiated the two depressed groups also reflected functional abnormalities in these regions.
Limitations
Features of the current study may limit the generalizability of some of the findings. First, we did not examine data from remitted MDD or BD participants. As such, we were unable to determine whether observed group differences persist once the depressive episodes have remitted, and whether the observed results represent state or trait effects of the respective illnesses. On the other hand, we did not observe any differences between the two patient groups regarding the severity of depressive symptoms. It would be difficult, therefore, to account for the observed between group differences on the basis of pure depression state effects. Second, many of the MDD and BD adults in the samples were taking psychotropic medications, and indeed the two groups differed in the proportion of participants taking antipsychotic and mood stabilizing medication. We observed no effects of these two medications on neural activity in the current report, and the observed group differences were similar regardless of whether or not variables representing these medications were included in the statistical analyses [see (54, 55) for a discussion of neuroimaging research with actively medicated participants]. Third, there were relatively few male participants included in either patient sample. Future studies with larger and more evenly matched samples of men and women with affective disorders should examine possible gender differences in neural responses to emotional facial displays. Finally, because of the high comorbidity rates between mood and substance use disorders, we opted to increase the generalizability of the study by including those individuals with a prior history of a substance use disorder. It is possible that prior substance abuse/dependence may have altered brain function. We note, however, that the median duration of remission of substance use disorders was nearly five years, and the two diagnostic groups did not differ in the proportion of patients who met criteria for an alcohol/substance use disorder. As such, it is unlikely that any lingering effects of substance abuse/dependence could explain the effects reported above.
Conclusions
The present findings suggested a dissociation in neural activity during the processing of mood-congruent (sad) and mood-incongruent (fear, anger, and happy) facial displays of emotion between depressed individuals on the basis of whether they meet criteria for BD or MDD. These findings parallel previous studies of neural activity during processing of emotional stimuli in BD and MDD depressed individuals. Together, findings from the present and previous studies suggest that differences in activity in emotion processing neural circuitry between BD and MDD individuals may represent biomarkers that more closely reflect underlying pathophysiological processes than do conventional diagnostic criteria. Future work should focus on determining the extent to which this dissociation in the functional integrity of emotion processing neural circuitry between BD and MDD depression has clinical and treatment implications for these two debilitating psychiatric disorders.
Supplementary Material
Acknowledgments
All work for this study was carried out within the Department of Psychiatry, University of Pittsburgh, (Pittsburgh, PA, USA). Neuroimaging data were collected at the Magnetic Resonance Research Center, University of Pittsburgh. We thank Dr. Fernando Boada and his staff for their help in acquiring the neuroimaging data. This research was supported by MH076971 (MLP) and T32 MH018269 (JCF) from the National Institute of Mental Health (Bethesda, MD, USA) and by the Michael and Morven Heller Research Fellowship (DMK).
Footnotes
Disclosures
The authors of this paper report no financial conflicts of interest in relation to this study.
References
- 1.Akiskal H, Maser J, Zeller P, et al. Switching from ‘unipolar’ to bipolar II: An 11-year prospective study of clinical and temperamental predictors in 559 patients. Arch Gen Psychiatry. 1995;52:114–123. doi: 10.1001/archpsyc.1995.03950140032004. [DOI] [PubMed] [Google Scholar]
- 2.Goldberg J, Harrow M, Whiteside J. Risk for bipolar illness in patients initially hospitalized for unipolar depression. Am J Psychiatry. 2001;158:1265–1270. doi: 10.1176/appi.ajp.158.8.1265. [DOI] [PubMed] [Google Scholar]
- 3.Charney D, Barlow D, Botteron K, et al. Neuroscience research agenda to guide development of a pathophysiologically based classification system. In: Kupfer D, First M, Regier D, editors. A Research Agenda for DSM-V. Washington, DC: American Psychiatric Association; 2002. pp. 31–83. [Google Scholar]
- 4.Phillips ML, Frank E. Redefining bipolar disorder: toward DSM-V. Am J Psychiatry. 2006;163:1135–1136. doi: 10.1176/ajp.2006.163.7.1135. [DOI] [PubMed] [Google Scholar]
- 5.Delvecchio G, Fossati P, Boyer P, et al. Common and distinct neural correlates of emotional processing in bipolar disorder and major depressive disorder: a voxel-based meta-analysis of functional magnetic resonance imaging studies. Eur Neuropsychopharmacol. 2012;22:100–113. doi: 10.1016/j.euroneuro.2011.07.003. [DOI] [PubMed] [Google Scholar]
- 6.Almeida JRC, Phillips ML. Distinguishing between unipolar depression and bipolar depression: current and future clinical and neuroimaging perspectives. Biol Psychiatry. 2013;73:111–118. doi: 10.1016/j.biopsych.2012.06.010. [DOI] [PMC free article] [PubMed] [Google Scholar]
- 7.Almeida JRC, Mechelli A, Hassel S, Versace A, Kupfer DJ, Phillips ML. Abnormally increased effective connectivity between parahippocampal gyrus and ventromedial prefrontal regions during emotion labeling in bipolar disorder. Psychiatry Res. 2009;174:195–201. doi: 10.1016/j.pscychresns.2009.04.015. [DOI] [PMC free article] [PubMed] [Google Scholar]
- 8.Almeida JRC, Versace A, Hassel S, Kupfer DJ, Phillips ML. Elevated amygdala activity to sad facial expressions: A state marker of bipolar but not unipolar depression. Biol Psychiatry. 2010;67:414–421. doi: 10.1016/j.biopsych.2009.09.027. [DOI] [PMC free article] [PubMed] [Google Scholar]
- 9.Lawrence NS, Williams AM, Surguladze S, et al. Subcortical and ventral prefrontal cortical neural responses to facial expressions distinguish patients with bipolar disorder and major depression. Biol Psychiatry. 2004;55:578–587. doi: 10.1016/j.biopsych.2003.11.017. [DOI] [PubMed] [Google Scholar]
- 10.Grotegerd D, Suslow T, Bauer J, et al. Discriminating unipolar and bipolar depression by means of fMRI and pattern classification: a pilot study. Eur Arch Psychiatry Clin Neurosci. 2013;263:119–131. doi: 10.1007/s00406-012-0329-4. [DOI] [PubMed] [Google Scholar]
- 11.Fournier J, Keener M, Mullin B, et al. Heterogeneity of amygdala response to happy faces in major depressive disorder: The impact of lifetime sub-threshold mania. Psychological Med. doi: 10.1017/S0033291712000918. in press. [DOI] [PMC free article] [PubMed] [Google Scholar]
- 12.Almeida JRC, Kronhaus DM, Sibille EL, et al. Abnormal left-sided orbitomedial prefrontal cortical-amygdala connectivity during happy and fear face processing: a potential neural mechanism of female MDD. Frontiers in Psychiatry. 2011;2:69. doi: 10.3389/fpsyt.2011.00069. [DOI] [PMC free article] [PubMed] [Google Scholar]
- 13.First M, Spitzer R, Gibbon M, Willians J, Benjamin L. Structured Clinical Interview for DSM-IV Axis I Disorders (SCID, version 2.0) New York: Biometric Research Department, New York State Psychiatric Institute; 1995. [Google Scholar]
- 14.Folstein MF, Folstein SE, McHugh PR. “Mini-mental state”. A practical method for grading the cognitive state of patients for the clinician. J Psychiatr Res. 1975;12:189–198. doi: 10.1016/0022-3956(75)90026-6. [DOI] [PubMed] [Google Scholar]
- 15.Blair J, Spreen O. Predicting premorbid IQ: A revision of the National Adult Reading Test. Clin Neuropsychologist. 1989;3:129–136. [Google Scholar]
- 16.Hamilton MA. A rating scale for depression. J Neurol Neurosurg Psychiatry. 1960;23:56–62. doi: 10.1136/jnnp.23.1.56. [DOI] [PMC free article] [PubMed] [Google Scholar]
- 17.Young RC, Biggs JT, Ziegler VE, Meyer DA. A rating scale for mania: reliability, validity and sensitivity. Br J Psychiatry. 1978;133:429–435. doi: 10.1192/bjp.133.5.429. [DOI] [PubMed] [Google Scholar]
- 18.Spielberger C, Gorsuch R, Lushene R, Vagg P, Jacobs G. Manual for the State-Trait Anxiety Inventory (Form Y) Palo Alto: Consulting Psychologists Press, Inc; 1983. [Google Scholar]
- 19.Tottenham N, Tanaka J, Leon A, et al. The NimStim set of facial expressions: judgments from untrained research participants. Psychiatry Res. 2009;168:242–249. doi: 10.1016/j.psychres.2008.05.006. [DOI] [PMC free article] [PubMed] [Google Scholar]
- 20.Maldjian J, Laurienti P, Kraft R, Burdette J. An automated method for neuroanatomic and cytoarchitectonic atlas-based interrogation of fMRI datasets. Neuroimage. 2003;19:1233–1239. doi: 10.1016/s1053-8119(03)00169-1. [DOI] [PubMed] [Google Scholar]
- 21.Ward B. AlphaSim. National Institute of Mental Health; 2002. [Google Scholar]
- 22.Lieberman MD, Cunningham WA. Type I and type II error concerns in fMRI research: re-balancing the scale. Soc Cogn Affect Neurosci. 2009;4:423–428. doi: 10.1093/scan/nsp052. [DOI] [PMC free article] [PubMed] [Google Scholar]
- 23.McIntosh AR, Grady CL, Ungerleider LG, Haxby JV, Rapoport SI, Horwitz B. Network analysis of cortical visual pathways mapped with PET. J Neurosci. 1994;14:655–666. doi: 10.1523/JNEUROSCI.14-02-00655.1994. [DOI] [PMC free article] [PubMed] [Google Scholar]
- 24.Courtney SM, Ungerleider LG, Keil K, Haxby JV. Object and spatial visual working memory activate separate neural systems in human cortex. Cereb Cortex. 1996;6:39–49. doi: 10.1093/cercor/6.1.39. [DOI] [PubMed] [Google Scholar]
- 25.Foley E, Rippon G, Thai NJ, Longe O, Senior C. Dynamic facial expressions evoke distinct activation in the face perception network: a connectivity analysis study. J Cogn Neurosci. 2012;24:507–520. doi: 10.1162/jocn_a_00120. [DOI] [PubMed] [Google Scholar]
- 26.Haxby J, Hoffman E, Gobbini M. The distributed human neural system for face perception. Trends Cogn Sci. 2000;4:223–233. doi: 10.1016/s1364-6613(00)01482-0. [DOI] [PubMed] [Google Scholar]
- 27.Batty M, Taylor MJ. Early processing of the six basic facial emotional expressions. Brain Res Cogn Brain Res. 2003;17:613–620. doi: 10.1016/s0926-6410(03)00174-5. [DOI] [PubMed] [Google Scholar]
- 28.Doehrmann O, Ghosh SS, Polli FE, et al. Predicting treatment response in social anxiety disorder from functional magnetic resonance imaging. JAMA. 2013;70:87–97. doi: 10.1001/2013.jamapsychiatry.5. [DOI] [PMC free article] [PubMed] [Google Scholar]
- 29.Morris JS, Friston KJ, Büchel C, et al. A neuromodulatory role for the human amygdala in processing emotional facial expressions. Brain. 1998;121:47–57. doi: 10.1093/brain/121.1.47. [DOI] [PubMed] [Google Scholar]
- 30.Vuilleumier P, Richardson MP, Armony JL, Driver J, Dolan RJ. Distant influences of amygdala lesion on visual cortical activation during emotional face processing. Nat Neurosci. 2004;7:1271–1278. doi: 10.1038/nn1341. [DOI] [PubMed] [Google Scholar]
- 31.Leyman L, De Raedt R, Schacht R, Koster EHW. Attentional biases for angry faces in unipolar depression. Psychol Med. 2007;37:393–402. doi: 10.1017/S003329170600910X. [DOI] [PubMed] [Google Scholar]
- 32.Harmon-Jones C, Schmeichel BJ, Mennitt E, Harmon-Jones E. The expression of determination: similarities between anger and approach-related positive affect. J Pers Soc Psychol. 2011;100:172–181. doi: 10.1037/a0020966. [DOI] [PubMed] [Google Scholar]
- 33.Summers M, Papadopoulou K, Bruno S, Cipolotti L, Ron MA. Bipolar I and bipolar II disorder: cognition and emotion processing. Psychol Med. 2006;36:1799–1809. doi: 10.1017/S0033291706008804. [DOI] [PubMed] [Google Scholar]
- 34.Schaefer KL, Baumann J, Rich BA, Luckenbaugh DA, Zarate CA. Perception of facial emotion in adults with bipolar or unipolar depression and controls. J Psychiatr Res. 2010;44:1229–1235. doi: 10.1016/j.jpsychires.2010.04.024. [DOI] [PMC free article] [PubMed] [Google Scholar]
- 35.Davis M, Whalen PJ. The amygdala: vigilance and emotion. Mol Psychiatry. 2001;6:13–34. doi: 10.1038/sj.mp.4000812. [DOI] [PubMed] [Google Scholar]
- 36.Phillips ML, Drevets WC, Rauch SL, Lane R. Neurobiology of emotion perception II: implications for major psychiatric disorders. Biol Psychiatry. 2003;54:515–528. doi: 10.1016/s0006-3223(03)00171-9. [DOI] [PubMed] [Google Scholar]
- 37.Lee B-T, Seok J-H, Lee B-C, et al. Neural correlates of affective processing in response to sad and angry facial stimuli in patients with major depressive disorder. Prog Neuropsychopharmacol Bol Psychiatry. 2008;32:778–785. doi: 10.1016/j.pnpbp.2007.12.009. [DOI] [PubMed] [Google Scholar]
- 38.Jollant F, Lawrence NS, Giampietro V, et al. Orbitofrontal cortex response to angry faces in men with histories of suicide attempts. Am J Psychiatry. 2008;165:740–748. doi: 10.1176/appi.ajp.2008.07081239. [DOI] [PubMed] [Google Scholar]
- 39.Mayberg HS, Brannan SK, Mahurin RK, et al. Cingulate function in depression: a potential predictor of treatment response. Neuroreport. 1997;8:1057–1061. doi: 10.1097/00001756-199703030-00048. [DOI] [PubMed] [Google Scholar]
- 40.Pizzagalli DA. Frontocingulate dysfunction in depression: Toward biomarkers of treatment response. Neuropsychopharmacol. 2010;36:183–206. doi: 10.1038/npp.2010.166. [DOI] [PMC free article] [PubMed] [Google Scholar]
- 41.Beck AT, Rush AJ, Shaw BF, Emery G. Cognitive Therapy of Depression. New York: The Guilford Press; 1979. [Google Scholar]
- 42.Gotlib IH, Krasnoperova E, Yue DN, Joormann J. Attentional biases for negative interpersonal stimuli in clinical depression. J Abnorm Psychol. 2004;113:121–135. doi: 10.1037/0021-843X.113.1.121. [DOI] [PubMed] [Google Scholar]
- 43.Joormann J, Gotlib IH. Selective attention to emotional faces following recovery from depression. J Abnorm Psychol. 2007;116:80–85. doi: 10.1037/0021-843X.116.1.80. [DOI] [PubMed] [Google Scholar]
- 44.Peckham AD, McHugh RK, Otto MW. A meta-analysis of the magnitude of biased attention in depression. Depress Anxiety. 2010;27:1135–1142. doi: 10.1002/da.20755. [DOI] [PubMed] [Google Scholar]
- 45.Keedwell PA, Andrew C, Williams SCR, Brammer MJ, Phillips ML. A double dissociation of ventromedial prefrontal cortical responses to sad and happy stimuli in depressed and healthy individuals. Biol Psychiatry. 2005;58:495–503. doi: 10.1016/j.biopsych.2005.04.035. [DOI] [PubMed] [Google Scholar]
- 46.Surguladze S, Brammer MJ, Keedwell P, et al. A differential pattern of neural response toward sad versus happy facial expressions in major depressive disorder. Biol Psychiatry. 2005;57:201–209. doi: 10.1016/j.biopsych.2004.10.028. [DOI] [PubMed] [Google Scholar]
- 47.Fu CHY, Williams SCR, Cleare AJ, et al. Attenuation of the neural response to sad faces in major depression by antidepressant treatment: a prospective, event-related functional magnetic resonance imaging study. Arch Gen Psychiatry. 2004;61:877–889. doi: 10.1001/archpsyc.61.9.877. [DOI] [PubMed] [Google Scholar]
- 48.Victor T, Furey M, Fromm S, Öhman A, Drevets W. Relationship between amygdala responses to masked faces and mood state and treatment in major depressive disorder. Arch Gen Psychiatry. 2010;67:1128–1138. doi: 10.1001/archgenpsychiatry.2010.144. [DOI] [PMC free article] [PubMed] [Google Scholar]
- 49.Suslow T, Konrad C, Kugel H, et al. Automatic mood-congruent amygdala responses to masked facial expressions in major depression. Biol Psychiatry. 2010;67:155–160. doi: 10.1016/j.biopsych.2009.07.023. [DOI] [PubMed] [Google Scholar]
- 50.Fu CHY, Williams SCR, Brammer MJ, et al. Neural responses to happy facial expressions in major depression following antidepressant treatment. Am J Psychiatry. 2007;164:599–607. doi: 10.1176/ajp.2007.164.4.599. [DOI] [PubMed] [Google Scholar]
- 51.Wang L, LaBar KS, Smoski M, et al. Prefrontal mechanisms for executive control over emotional distraction are altered in major depression. Psychiatry Res. 2008;163:143–155. doi: 10.1016/j.pscychresns.2007.10.004. [DOI] [PMC free article] [PubMed] [Google Scholar]
- 52.Gotlib IH, Sivers H, Gabrieli JDE, et al. Subgenual anterior cingulate activation to valenced emotional stimuli in major depression. Neuroreport. 2005;16:1731–1734. doi: 10.1097/01.wnr.0000183901.70030.82. [DOI] [PubMed] [Google Scholar]
- 53.Sheline YI, Barch DM, Donnelly JM, Ollinger JM, Snyder AZ, Mintun MA. Increased amygdala response to masked emotional faces in depressed subjects resolves with antidepressant treatment: An fMRI study. Biol Psychiatry. 2001;50:651–658. doi: 10.1016/s0006-3223(01)01263-x. [DOI] [PubMed] [Google Scholar]
- 54.Phillips ML, Travis MJ, Fagiolini A, Kupfer DJ. Medication effects in neuroimaging studies of bipolar disorder. Am J Psychiatry. 2008;165:313–320. doi: 10.1176/appi.ajp.2007.07071066. [DOI] [PMC free article] [PubMed] [Google Scholar]
- 55.Hafeman DM, Chang KD, Garrett AS, Sanders EM, Phillips ML. Effects of medication on neuroimaging findings in bipolar disorder: an updated review. Bipolar Disord. 2012;14:375–410. doi: 10.1111/j.1399-5618.2012.01023.x. [DOI] [PubMed] [Google Scholar]
Associated Data
This section collects any data citations, data availability statements, or supplementary materials included in this article.