Abstract
We present a very simple procedure yielding high-contrast images of adherent, confluent cells such as human neuroblastoma (SH-EP) cells by ordinary bright-field microscopy. Cells are illuminated through a color filter and a pinhole aperture placed between the condenser and the cell culture surface. Refraction by each cell body generates a sharp, bright spot when the image is defocused. The technique allows robust, automatic cell counting from a single bright-field image in a wide range of focal positions; it does this via free, readily available image-analysis tools. Contrast may be enhanced by swelling cell bodies by brief incubation in PBS. The procedure was benchmarked against manual counting and automated counting of fluorescently labeled cell nuclei.. Counts from day-old and freshly seeded plates were compared in a range of densities, from sparse to densely overgrown. On average bright-field images produced the same counts as fluorescent images, with less than 5% error. This method will allow routine cell counting using a plain bright-field microscope, absent cell-line modification or cell staining.
Keywords: Brightfield, microscopy, fluorescence, cell culture, counting, pinhole, monochomatic, PBS, defocusing
Introduction
In cell culture experiments where one or more chemicals' effect on cell number must be assessed, often it would be ideal to know precisely how many cells have been plated into a well or a sub-region of a well at the beginning of an experiment and to know how many cells were alive days later before addition of a chemical and how many were present at the experiment’s end. This is especially true when subject chemicals affect cell proliferation, yet the experiment aims to quantitate a different parameter such as metabolic activity, which then needs to be normalized against cell number.
Counting cells is required when adherent mammalian cells are cultivated for numerous other experimental applications such as measuring protein overexpression or RNAi gene silencing. Each such procedure may affect cellular growth, skewing measurement of the substances’ effects. When cells must be harvested and replated one or more times, traditional cell counting with a hemocytometer [1] can be time-consuming and error-prone.
Fluorescence microscopy is the most widely used method to visualize and quantitate cellular proteins. When cell proteins are quantitated, usually it is necessary to normalize the data as a ratio of cell number against total protein content. Cell counting from fluorescence images may readily be achieved [2]. However, when common nuclear dyes such as Hoechst 33342 or DAPI are used, counts may be less than precise if these dyes themselves reduce cell viability or affect growth rates [2]. Hence, such methods can impinge on data and thus skew results.
Alternately, cells may be engineered to express a nuclear protein such as histone protein H2B that is fused to the green fluorescent protein (GFP) in order to provide highly accurate cell counts [3]. However, in this approach creating new stable cell lines before every experiment. may be required. Moreover, because GFP fluorescence microscopy uses one fluorescent channel, this approach may limit analysis of other proteins through immunofluorescence.
Such difficulties have prompted a search for alternative methods of cell counting which use bright-field microscopy. Generally, however, bright field microscopy of flat, adherent cells suffers from the defect that cultured cells are transparent. As a result contrast is very poor particularly when imaging is done in the growth plane itself. Several software-based algorithms have recently been developed to improve contrast in bright-field images [4–6]. Counting cells is relatively easy in naturally round, individually growing cells such as yeast [7]. However, when flat, adherent cells must be quantitated, digital holography [8], z-projection of multiple z-stacked images [9] or intensity derivation [10] may all be required to improve contrast and allow cell counting. These methods require acquisition of multiple images followed by application of an image analysis algorithm, making them best suited to automated, high content screening microscopy.
Here we present here a quite simple procedure to generate high-contrast images of flat, adherent and possibly confluent cells. Resulting images can be analyzed with free, readily available software tools, such as the ITCN plugin for ImageJ [11] or the CellC analysis software [12]; cells may be counted directly from single bright field images. Our approach allows users to count cells using a simple, standard stand-alone microscope as is present in most cell culture laboratories. Furthermore, it does not necessitate tagging of cell lines with fluorescent dyes or any other method of nuclear staining.
Methods
Cell culture
Cell culture plates were pretreated with 0.1% Poly-L-Lysine solution for 15 min, washed four times and stored at 4°C. Human neuroblastoma (SH-EP) cells expressing the green fluorescent protein (GFP)-tagged nuclear histone H2B protein (SHEP-GFP) were cultured in DMEM supplemented with 4.5 g/l D-glucose, 10% fetal bovine serum, 100 IU/ml penicillin and 100 µg/ml streptomycin at 37 °C/5 % CO2. SHEP-GFP cells were plated at densities of 50k – 5000k / well in 12-well plates and grown overnight. Live cells were imaged directly in culture media. Alternatively, the culture media was suctioned and replaced by PBS for 10 min prior to imaging to induce swelling of cells.
Imaging
Images were acquired on an Olympus IX70 inverted fluorescent microscope (Olympus America Inc., Center Valley, NJ), using a 4× / 0.13 NA Uplan air objective and a 2 megapixel Olympus MicroFire CCD camera. Parallel GFP fluorescence and pinhole illumination images were recorded for each growth region. Fluorescence images were recorded in-focus at exposure times of 300 ms, using the Fluorescin / GFP filter cube (U-MNIB). For pinhole illumination cells were illuminated by the tungsten halogen lamp at full power with the condenser fully open, without phase rings or filters in the illumination path.
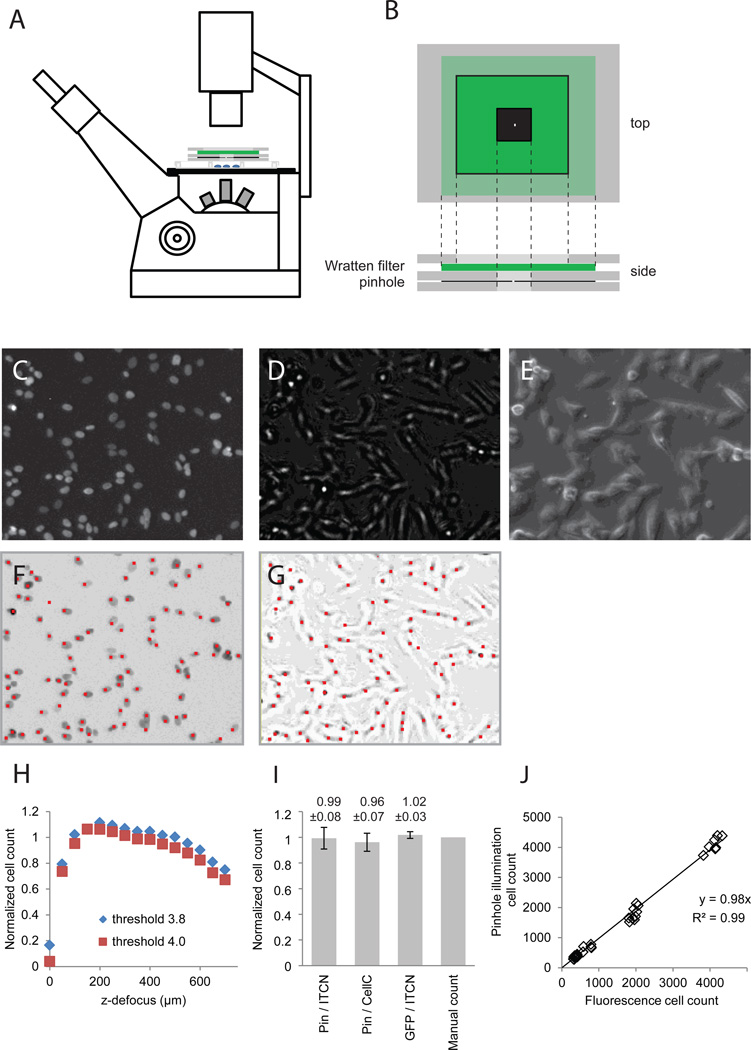
A green Kodak Wratten filter #58 and a 130 µm pinhole were affixed to a stabilizing cardboard frame. These were placed directly on the cell culture plate and positioned to achieve an even illumination of the viewing field (Fig 1 A, B).
Figure 1. Cell counting from pinhole illuminated microscopy.
(A) A pinhole aperture and a green Wratten filter were placed on top of the cell culture plate and positioned to ensure an even illumination of the viewing field; (B) enlarged view of the filter-pinhole assembly. SHEP-GFP cells were seeded at 50 – 500k / well in a 12-well plate and grown for 2 days with a media switch after 24 hours. Panels (C–G) show enlarged sections of images recorded in parallel at 4× magnification: (C) GFP fluorescence, (E) Pinhole illuminated bright field image, (F) phase contrast image. (G) Cell identification from fluorescence images and pinhole illuminated bright-field images calculated by the ImageJ ITCN plugin; red sports mark identified cells. Cell markers were enlarged 400% to improve readability. (H) Cell counts from pinhole images recorded at different focal positions normalized against counts from fluorescence images. (I) Comparison of cell counts from fluorescence and pinhole images analyzed by manual and automated counting (means ± SD, n = 9). (J) Pinhole cell counts plotted against counts from GFP fluorescence fitted by linear regression.
The image was then de-focused by lowering the objective until image contrast was maximal. Best results were achieved by lowering the focus by 50–200 µm, corresponding to 0.5 – 2 turns of the fine z-focus drive (Fig. 1C). Then, an image was recorded with an exposure time of 80 ms. Exposure times for fluorescence and pinhole images were respectively kept constant throughout the measurements.
The pinhole aperture was formed by punching a hole into heavy-duty (0.9 mils) aluminum foil with the point of a fine needle. The size of the pinhole was determined to be 130 ± 10 µm by placing the aperture on the bed of an optical scanner (MFC 7460, Brother, Bridgewater, NJ) and scanning the pinhole at 9600 dpi (n = 4).
Cell counting
Cells were counted using the ITCN (Image-based tool for counting nuclei) Plugin for ImageJ developed by Thomas Kuo and Jiyun Byun at the Center for Bio-image Informatics at UC Santa Barbara [11]. Its algorithm assumes nuclei to be blob-like structures with roughly convex local intensity distributions whose iso-level contour is approximately ellipsoidal; nuclei are fitted by an inverted Laplacian of Gaussian filter [11]. The plugin can be downloaded without charge from: http://www.bioimage.ucsb.edu/automatic-nuclei-counter-plug-in-for-imagej. Images were converted to 8-bit greyscale and inverted before using ITCN. Cell detection was performed by detecting dark peaks with the following parameters: cell width = 7, minimum distance = 7, threshold = 2, mask image: use selected ROI.
Alternatively, cells were counted using the CellC image analysis software, which identifies cells by global thresholding combined with a watershed segmentation algorithm [12]. Eight-bit images were loaded into the CellC software. The Automatic Intensity Threshold was adjusted to between 0.4 and 0.5. The number of cells is evaluated by counting the number of isolated pixel groups that exceed the intensity threshold. As a reference, cells were also counted manually from brightfield images using the ImageJ cell counter plugin.
Image contrast and brightness have been optimized for publication in panels shown in Figs. 1–3, but all cell counting data were calculated from unprocessed microscopy images.
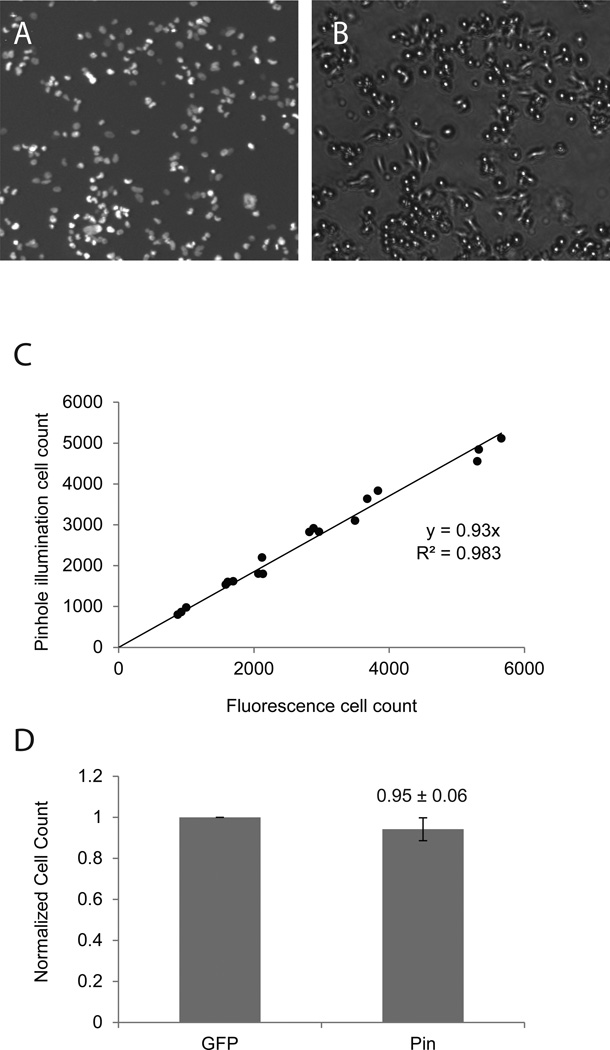
Figure 3. Counting of freshly seeded cells.
SHEP-GFP cells were seeded at 100k – 1000k / well and were allowed to attach to the bottom of a 12-well plate for approximately 3 hours. Fluorescence- (A) and pinhole-illuminated bright field images (B) were taken in identical viewing fields of the freshly seeded cells. (C) Fluorescent and pinhole counts were plotted against one another and fitted by linear regression. (C) Normalized cell counts for corresponding fluorescent and pinhole images (means ± SD, n = 18).
Results
Counting of neuroblastoma cells respectively by pinhole illumination and by fluorescence microscopy
Bright-field images, particularly those of adherent cells, lack contrast; therefore, resulting images are ill-suited to automated cell counting algorithms. By placing a tiny pinhole aperture directly between the condenser lamp and experimental surface (Fig. 1A, B) and by defocussing the image, bright-field images of very high contrast could be generated since each cell body produced a bright spot in a plane below the cells. We found contrast could be yet increased by placing a monochromatic filter in the beam path (Fig. 1C). Image contrast was largely unchanged by altering the z-position of either the condenser or the pinhole assembly (not shown).
Human neuroblastoma (SH-EP) cells expressing the green fluorescent protein (GFP)-tagged nuclear histone H2B protein (SHEP-GFP) were imaged using the identical fields under pinhole illumination, GFP fluorescence, and conventional phase-contrast bright-field microscopy (Fig. 1C, D, E). Three different regions in three independent wells were examined and cells were identified from fluorescence images and from pinhole illuminated images using the ITCN plugin (Fig. 1F, G).
We found that uniform ITCN variable settings (width, minimum distance, and threshold) could be used for all fluorescent images, while threshold values varying between 2 and 4 optimized imaging in the pinhole method. The latter effect resulted from slight differences in the overall brightness of images gathered from different microscope sessions. Width and minimum distance variables were kept constant for all pinhole images. We tested the influence of the z-focus position on counting accuracy by recording a stack of images while lowering the focal plane from −50µm to −700µm (Fig. 1H). Cell counts were stable over a wide range of focus positions. While defocussing by ~50 µm produced the highest contrast, focal positions of −100 – 400 µm were more tolerant against variations in thickness of the cell culture plates and produced robust counting results (Fig. 1H).
We compared counts obtained through several cell counting procedures. First, we automatically counted cells in identical pinhole-illuminated images using ITCN and CellC cell-counting software; then we compared those results with automated counts of fluorescence images; finally we compared these results with manual cell counts (Fig. 1I). Average counts in all methods diverged by less than 5%. Cells counted from fluorescence microscopy matched the manual count most closely (3% variation at 50k cells / well), whereas pinhole illumination resulted in somewhat higher standard deviation (7–8%). This is likely due to the presence of highly elongated cells that lowered contrast in pinhole images. In these images diminished contrast sometimes prevented correct cell identification or led to double-counting of cells. Analysis of cells plated at a widely divergent densities (50k – 500k per well) confirmed that pinhole-based counts and counts generated from fluorescent images were highly correlated (R2 > 0.98; Fig. 1 J); likewise these counts on average differed by less than 5 %.
Brief cell swelling in PBS improves contrast and counting accuracy
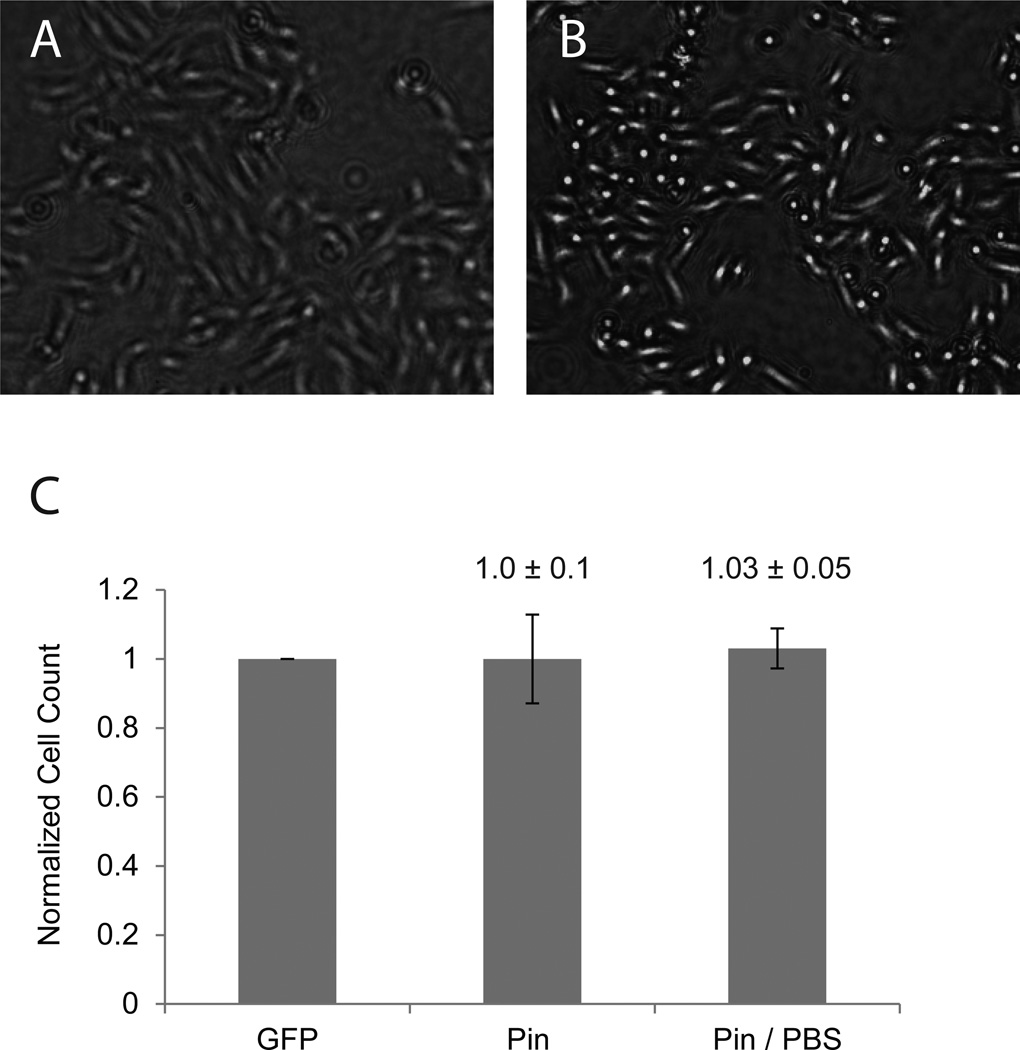
We found that variability of cell counts from pinhole-illumination images could be reduced by briefly removing growth media from the wells and replacing it with 1× PBS. Cells incubated in PBS for 15 min experienced overall swelling of the cell body, resulting in increased contrast during pinhole imaging (Fig. 2A, B). After imaging, growth media was returned to the cell cultures. Re-counting cells after 24 h did not reveal any differences in cell number between PBS-treated and untreated cells; that is, the PBS treatment did not affect SH-EP cell viability. The increased contrast of PBS-treated cells resulted in substantially more accurate cell detection by the ITCN ImageJ plugin, decreasing the average standard deviation of cells counts from 10% in untreated cells to 5% after PBS treatment when benchmarked against fluorescence-based counting (Fig. 2C).
Figure 2. Cell counting after swelling by PBS treatment.
SHEP-GFP cells were seeded at 1500k in a 12 well plate and grown for 2 days with a media switch after 24 hours. Pinhole illuminated bright-field images were recorded in cell media (A). In order to increase contrast in images complete media was exchanged for PBS. Cells were immersed in PBS for 15 minutes before imaging (B). Cells were counted as described in Fig. 1. Cell counts of pinhole illuminated images with and without PBS incubation were normalized against fluorescence images of the same viewing field (means ± SD, n = 9).
Counting of freshly seeded cells
Often it is desirable to control for inhomogeneous cell densities when cells are grown under different conditions (e.g. siRNA treatment) and are then re-seeded onto a new culture plate. Inasmuch as such cells have not fully spread out and are rounded, they should be particularly good targets for pinhole illumination cell counting. To test the accuracy of the method under these conditions, we plated cells at different densities (50k – 500k per well). Freshly seeded cells were permitted to settle for three hours. Fluorescence and pinhole images from three independent wells were taken for each density (Fig. 3A, B). Cells were imaged in their original growth media. Counts from fluorescent and pinhole images show a strong correlation (R2 > 0.98) (Fig. 3C). Cell counts from pinhole images are almost identical to those from nucleus fluorescence (95 ± 6%, Fig. 3D). Cells were slightly undercounted in pinhole-illuminated images at higher densities, likely due to clumping of cells under these conditions.
Counting of dense cell layers
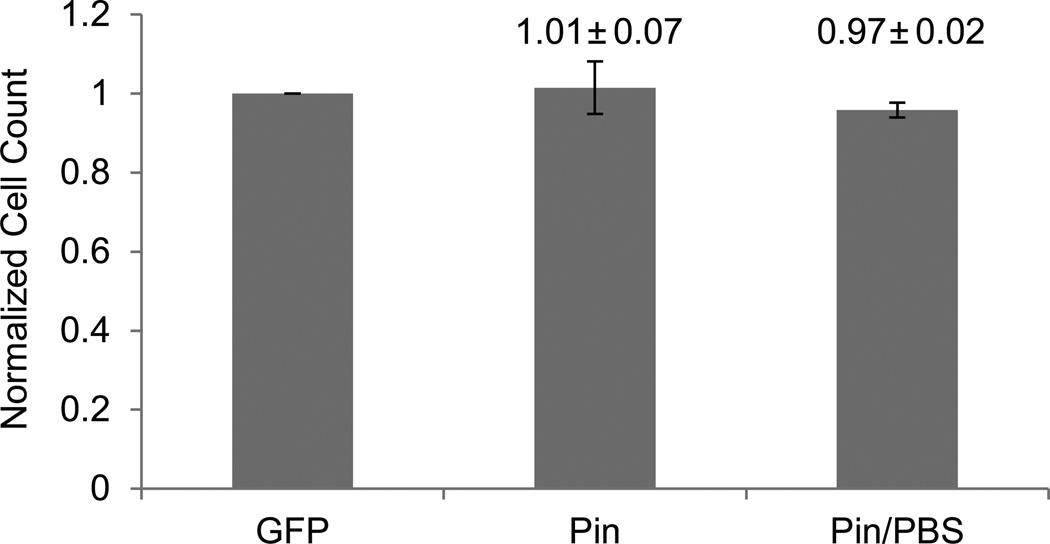
To test the limitation of the pinhole illumination method when analyzing dense-to-overgrown cell layers, cells from the prior experiment were allowed to grow for an additional 24 – 48 h. This resulted in confluent, and in the case of densely plated cells, overgrown cell cultures in which cells started to form a second overlapping layer. Overgrowth poses a challenge for automated cell counting under this method, as it is not possible to get all cells simultaneously into focus. Fluorescent and pinhole images were taken with and without treating the cells with PBS for 15 min. Cell counts were normalized against fluorescence imaging (Fig. 4). Under these conditions, cell counts from pinhole images with and without PBS treatment were virtually identical to those obtained by fluorescent imaging, 101 ± 7% and 97 ± 2%, respectively. PBS treatment of cells substantially decreased counting error, as had previously been observed at lower cell densities.
Figure 4. Counting of dense confluent cell layers.
SHEP-GFP cells were seeded at very high cell densities of ~5000k / well and allowed to grow for one day, resulting in a fully confluent cell layer. Cells were imaged with fluorescence, pinhole, and pinhole + PBS techniques. Cell counts of pinhole-illuminated images with and without PBS incubation were normalized against fluorescence images of the same viewing field (means ± SD, n = 6).
Conclusions
Generally, brightfield can visualize differences in opacity (amplitude objects) while failing to resolve transparent objects that differ only in refractive index (phase objects) that can better be visualized by phase contrast microscopy [13]. However, phase objects can be made visible in brightfield by defocusing the microscope [14]. Defocusing translates phase differences into intensity differences in microscopic imaging, which can be quantitatively described by the Transport of Intensity equation [15]. However, phase information deteriorates with decreasing spatial coherence of the light source [16]. The combination of pinhole and monochromatic filter produces a quasi-coherent wave front and thereby strongly improves phase contrast in defocused images. Our results show that pinhole illumination combined with defocussed image acquisition results in bright-field images that have very high contrast. This can be conceptualized as each cell body acting as a miniature lens to produce a bright, central spot below the cell layer. Such spots can easily be identified through threshold analysis and thus can be used for cell counting.
Adding a narrow-spectrum color filter to the light path improves coherence and did improve contrast in our images. This could be seen as preventing chromatic dispersion from the “cell-body lenses.” Although initially a green filter was used to enhance contrast with the pink cell-culture medium, experiments with a red monochromatic filter (Kodak Wratten filter #61) yielded equally good results (not shown).
Swelling cell bodies by treating with PBS enhanced cell curvature and thus enhanced the lensing effect, substantially increasing cell counting accuracy. Under our experimental conditions, short-term incubation in PBS had no measurable effect on growth parameters, permitting two or more independent counts over the course of an experiment. While counting accuracy was improved at high cell densities, the technique reaches its limit when imaging cells had grown into multiple layers. Therefore, more accurate counts than those obtained here should be obtainable when cell lines that never grow past confluency, such as Madin-Darby Canine Kidney (MDCK), are analyzed.
Previously published strategies to enhance image contrast in bright-field microscopy have used contrast differentials from multiple z-stacked images [9, 10], or they have determined cell density through measuring the size of confluent areas and multiplying by a calculated density factor [17]; these strategies are best suited for automated image acquisition. The method presented here permits cell counting by use of a simple bright-field microscope with very minor hardware modification. Further it allows repeated, quick and simple counting in routine cell culture environments and should be a versatile quality-control tool in a variety of mammalian cell culture applications.
Acknowledgements
The SH-EP cell line was a kind gift from R. König, F Westermann and M. Schwab (DKFZ, Heidelberg, Germany). We gratefully acknowledge the use of the fluorescence microscope of S. Sakiyama-Elbert, BME Washington University in St. Louis. This research was in part financially supported by the DRC at Washington University (NIH Grant No. 5 P30 DK020579), the German Science Foundation (DFG, BI 1409/1-1) and by the German Ministry for Science and Education (BMBF, NGFN-Plus 01GS08132, GERAMY 01GM1107C).
References
- 1.Ricardo R, Phelan K. Counting and determining the viability of cultured cells. J Vis Exp. 2008 doi: 10.3791/752. [DOI] [PMC free article] [PubMed] [Google Scholar]
- 2.Park CH, Kimler BF, Smith TK. Comparison of the supravital DNA dyes Hoechst 33342 and DAPI for flow cytometry and clonogenicity studies of human leukemic marrow cells. Exp Hematol. 1985;13:1039–1043. [PubMed] [Google Scholar]
- 3.Batra R, Harder N, Gogolin S, Diessl N, Soons Z, Jager-Schmidt C, Lawerenz C, Eils R, et al. Time-lapse imaging of neuroblastoma cells to determine cell fate upon gene knockdown. PLoS One. 2012;7:e50988. doi: 10.1371/journal.pone.0050988. [DOI] [PMC free article] [PubMed] [Google Scholar]
- 4.Curl CL, Bellair CJ, Harris T, Allman BE, Harris PJ, Stewart AG, Roberts A, Nugent KA, Delbridge LM. Refractive index measurement in viable cells using quantitative phase-amplitude microscopy and confocal microscopy. Cytometry A. 2005;65:88–92. doi: 10.1002/cyto.a.20134. [DOI] [PubMed] [Google Scholar]
- 5.Ali R, Gooding M, Szilágyi T, Christlieb M, Brady M. Automatic segmentation of adherent biological cell boundaries and nuclei from brightfield microscopy images. Machine Vision and Applications: online publication. 2011 [Google Scholar]
- 6.Tscherepanow M, Jensen N, Kummert F. An incremental approach to automated protein localisation. BMC Bioinformatics. 2008;9:445. doi: 10.1186/1471-2105-9-445. [DOI] [PMC free article] [PubMed] [Google Scholar]
- 7.Kvarnstrom M, Logg K, Diez A, Bodvard K, Kall M. Image analysis algorithms for cell contour recognition in budding yeast. Opt Express. 2008;16:12943–12957. doi: 10.1364/oe.16.012943. [DOI] [PubMed] [Google Scholar]
- 8.Molder A, Sebesta M, Gustafsson M, Gisselson L, Wingren AG, Alm K. Non-invasive, label-free cell counting and quantitative analysis of adherent cells using digital holography. J Microsc. 2008;232:240–247. doi: 10.1111/j.1365-2818.2008.02095.x. [DOI] [PubMed] [Google Scholar]
- 9.Selinummi J, Ruusuvuori P, Podolsky I, Ozinsky A, Gold E, Yli-Harja O, Aderem A, Shmulevich I. Bright field microscopy as an alternative to whole cell fluorescence in automated analysis of macrophage images. PLoS One. 2009;4:e7497. doi: 10.1371/journal.pone.0007497. [DOI] [PMC free article] [PubMed] [Google Scholar]
- 10.Dehlinger D, Suer L, Elsheikh M, Pena J, Naraghi-Arani P. Dye free automated cell counting and analysis. Biotechnol Bioeng. 2013;110:838–847. doi: 10.1002/bit.24757. [DOI] [PubMed] [Google Scholar]
- 11.Byun J, Verardo MR, Sumengen B, Lewis GP, Manjunath BS, Fisher SK. Automated tool for the detection of cell nuclei in digital microscopic images: application to retinal images. Mol Vis. 2006;12:949–960. [PubMed] [Google Scholar]
- 12.Selinummi J, Seppala J, Yli-Harja O, Puhakka JA. Software for quantification of labeled bacteria from digital microscope images by automated image analysis. Biotechniques. 2005;39:859–863. doi: 10.2144/000112018. [DOI] [PubMed] [Google Scholar]
- 13.Zernicke F. Das Phasenkontrastverfahren bei der mikroskopischen Beobachtung. Zeitschrift für Technische Physik. 1935;16:454–457. [Google Scholar]
- 14.Agero U, Monken CH, Ropert C, Gazzinelli RT, Mesquita ON. Cell surface fluctuations studied with defocusing microscopy. Phys Rev E Stat Nonlin Soft Matter Phys. 2003;67:051904. doi: 10.1103/PhysRevE.67.051904. [DOI] [PubMed] [Google Scholar]
- 15.Reed Teague M. Deterministic phase retrieval: a Green’s function solution. JOSA. 1983;73:1434–1441. [Google Scholar]
- 16.Waller L. SPIE BiOS. International Society for Optics and Photonics; 2013. Phase imaging with partially coherent light. [Google Scholar]
- 17.Topman G, Sharabani-Yosef O, Gefen A. A method for quick, low-cost automated confluency measurements. Microsc Microanal. 2011;17:915–922. doi: 10.1017/S1431927611012153. [DOI] [PubMed] [Google Scholar]


