

Abstract
Translation arrest occurs in neurons following focal cerebral ischemia and is irreversible in penumbral neurons destined to die. Following global cerebral ischemia, mRNA is sequestered away from 40S ribosomal subunits as mRNA granules, precluding translation. Here, we investigated mRNA granule formation using fluorescence in situ histochemistry out to 8 h permanent focal cerebral ischemia using middle cerebral artery occlusion in Long Evans rats with and without diabetes. Neuronal mRNA granules colocalized with PABP, HuR, and NeuN, but not 40S or 60S ribosomal subunits, or organelle markers. The volume of brain with mRNA granule-containing neurons decreased exponentially with ischemia duration, and was zero after 8 h permanent focal cerebral ischemia or any duration of ischemia in diabetic rats. These results show that neuronal mRNA granule response has a limited range of insult intensity over which it is expressed. Identifying the limits of effective neuronal stress response to ischemia will be important for developing effective stroke therapies.
Keywords: Focal cerebral ischemia, HSP70, HuR, Middle cerebral artery occlusion, mRNA granules, Protein synthesis inhibition, Stress granules, Translation arrest
Introduction
The cessation of protein synthesis is a general response of cells to the application of exogenous stressors such as heat shock [1], osmotic stress [2], heavy metal poison [3], and nutrient deprivation [4]. This translation arrest (TA) is a marker of the temporary genetic reprogramming of the injured cells to a stress response phenotype [5]. Successful recovery from the injury results in cessation of TA and eventual reset of the cell to its pre-injury state, whereas persistence of the TA precedes cell death after a lethal injury.
Such a stress-induced TA occurs in brain neurons following both focal and global cerebral ischemia and reperfusion (I/R) [6]. TA during ischemia is due to loss of energy charge [7]. However, during reperfusion, polysomes dissociate [8] and TA persists. Transient changes in translation initiation factors occur during reperfusion [9], but these do not correlate with prolonged TA in either global [10] or focal [11] ischemia. A novel mechanism of prolonged TA was discovered by Hu et al. who demonstrated that the sequestration of ribosomes in insoluble protein aggregates after global [12] and focal brain I/R [13] indeed correlated with prolonged TA.
In addition to pathological ribosome sequestration, there are multiple cell physiologic forms of ribosome sequestration. Examples include stress granules [14], processing bodies [15, 16], and HuR complexes [17, 18]. Each of these structures may contribute in an incidental way to the general TA following cell stress by sequestering translation components. However, the primary function of such structures is to regulate mRNA in the service of the orderly progression of stress-induced genetic reprogramming [19, 20].
In this context, we previously showed a histologically quantitative sequestration of polyadenylated (pA) mRNAs into structures we termed “mRNA granules” in neurons following global cerebral I/R [21]. These structures were neither stress granules nor processing bodies, but were a form of HuR granule [20]. Like protein aggregates, mRNA granules formed reversibly in surviving neurons and irreversibly in dying neurons [21]. Additionally, their presence correlated precisely with decreased rates of in vivo translation. We previously presented brief observations of mRNA granules in neurons following focal brain ischemia [22]. Here, we systematically studied mRNA granulation out to 8 h permanent focal cerebral ischemia in the rats with and without streptozocin-induced diabetes. The non-diabetic rats formed copious neuronal mRNA granules after 2 h ischemia, and the numbers of mRNA granule-containing neurons decreased to zero by 8 h ischemia. The mRNA granules observed in cerebral cortex and basal ganglia possessed the same colocalization properties as those previously reported in hippocampal neurons [21, 23]. Diabetic rats failed to form mRNA granules at any duration of ischemia. These results provide the therapeutically relevant insight that mRNA granule formation occurs only over a limited range of insult intensity.
Materials and Methods
Materials
Antisera for α-tubulin (T6199) and neurofilament (NF) H/M (N2912) were purchased from Sigma-Aldrich (St. Louis, MO, USA). Antiserum for cytochrome c oxidase subunit 4, a mitochondrial marker (COX IV; ab16056), was purchased from Abcam (San Francisco, CA, USA). Antisera for protein disulfide isomerase, a marker of the endoplasmic reticulum (PDI; MA3-019), and the trans-Golgi marker TGN38 (MA3-063) were purchased from Thermo Scientific (Rockford, IL, USA). A marker of the cis-Golgi, GM130 (610822), was purchased from BD Biosciences (Sparks, MD, USA). Antisera for HuR (sc-5261), TIA-1 (sc-1751), a marker of stress granules, and TTP (sc-8458), a marker of processing bodes, were purchased from Santa Cruz Biotechnology, Inc. (Santa Cruz, CA, USA). Anti-NeuN, used here as a marker for neuronal nuclei (MAB377), was purchased from Millipore (Billerica, MA, USA). Antiserum for pp32, a HuR accessory protein (ADI-905-234-100), was purchased from Enzo Life Sciences (Farmingdale, NY, USA). Polyclonal S6 ribosomal protein antiserum (2217) was purchased from Cell Signaling Technology, Inc. (Danvers, MA, USA). Ribosomal P antigen (RPA; HPO-0100), a marker of the 60S ribosomal subunit [24], was purchased from ImmunoVision (Springdale, Arkansas, USA). Alexa FluorR 488 donkey anti-goat IgG, Alexa FluorR 555 donkey anti-rabbit IgG, and Alexa FluorR 555 anti-mouse IgG, used for immunofluorescence histochemistry (IF), were purchased from Molecular Probes (Eugene, OR, USA). A 5′-biotinylated 50-mer oligo-dT probe used for fluorescent in situ hybridization (FISH) was made by Integrated DNA Technologies, Inc. (Coralville, IA, USA). Prehybridization and hybridization buffers were obtained from the mRNA locator In Situ Hybridization Kit (Ambion, Austin, TX, USA). Streptozocin (STZ) was purchased from Sigma Chemical Co. (St. Louis, MO, USA). All other chemicals were reagent grade.
Focal Brain Ischemia by Middle Cerebral Artery Occlusion
All animal experimental protocols were approved by the Wayne State University Animal Investigation Committee and were conducted following the Guide for the Care and Use of Laboratory Animals (National Research Council, revised 1996). All efforts were made to reduce animal suffering and minimize the total number of animals used.
Unilateral permanent focal brain ischemia was induced in male Long Evans rats (weight 275–300 g; age 10–12 weeks; Harlan, Indianapolis, IN, USA) using the middle cerebral artery occlusion (MCAO) intraluminal suture model of Hatashita et al. [25], as previously described [26–29]. Anesthesia was initiated with 5 % halothane and maintained with 1.5 % halothane via facemask for the duration of the surgery. Animals were supine, and core body temperature was maintained at 37±0.5 °C during the entire surgery period by a homeostatic blanket system (Harvard Apparatus) using a rectal thermometer.
Laser Doppler flowmetry was used to monitor cerebral blood flow as an indicator of successful MCA occlusion. The scalp was shaved, and a dental drill was used to manually produce a ~3-mm burr hole to expose intact Dura over ipsilateral cerebral cortex, at a coronal level approximately 1 mm anterior to Bregma in the main MCA territory. A micromanipulator was used to position the laser Doppler probe just above the dura, and 30–60 min was provided for the probe signal to stabilize.
After shaving the cervical region and cleansing the area with Betadine, a midline cervical incision was made in order to expose the omohyoid and sternomastoid muscles, which were separated using a retractor to expose the right common carotid artery (CCA) and its bifurcation. The right CCA was dissected free of surrounding tissue and nerves. All branches of the external carotid artery were isolated and coagulated. The CCA was clamped using a vascular clip, and the internal carotid artery was isolated and also clamped. Under a dissecting microscope, a small cut was made in the external carotid artery, and a nylon filament ~18.5 mm in length was inserted into the CCA and secured. The vascular clip was then removed from the internal carotid artery, and the stump of the external carotid artery was transected in order to facilitate maneuvering of the nylon filament into the internal carotid artery. The filament was carefully passed up into the lumen of the internal carotid artery, blocking the MCA at its origin.
The vascular clip was removed from the CCA, and all incisions were closed. The laser Doppler access hole was filled with dental cement. Rats were then returned to their cages and allowed to recover. Upon regaining consciousness, some rats displayed paresis of the left forelimb and unilateral circling. At the end of the ischemic periods, animals were re-anesthetized with 5 % halothane and sacrificed by perfusion fixation. Experimental groups were sham-operated, nonischemic controls (NIC), and 2, 4, 6, and 8 h (2I, 4I, 6I, and 8I, respectively) of unilateral pMCAO. Five animals per group were used for fluorescent in situ hybridization studies, and four animals per group were used for TTC staining.
An additional group of four animals was subjected to 2 h transient MCAO followed by 24 h reperfusion (2I/24R) for TTC staining. After 2 h MCAO ischemia as described above, the animals were re-anesthetized with 5 % halothane, and the nylon filament carefully withdrawn. Reperfusion was confirmed by laser Doppler flowmetry. Surgical sites were sutured as above, and rats were returned to their cages and sacrificed by perfusion fixation at 24 h of reperfusion.
Induction of Diabetes
As previously described [27–29], an insulinopenic model of diabetes was induced in 8-week-old male Long Evans rats by a single intraperitoneal (IP) injection of STZ (50 mg/kg dissolved in 0.1 mM sodium citrate, pH 4.5). Left hind limb saphenous vein blood samples were collected 1 week after STZ injection, and plasma glucose was determined using an Accu-Chek® Advantage glucometer (Roche Diagnostics, Indianapolis, IN, USA). Diabetes was defined by a blood glucose >300 mg/dl, with animals being used 4–6 weeks later without insulin supplements. Average blood glucose for the STZ-treated rats at the time of MCAO was 437±49.5 mg/dL. Unilateral focal brain ischemia was induced as described above. Diabetic experimental groups were 0.5, 1, 4, and 6 h (0.5ID, 1ID, 4ID, and 6ID, respectively) pMCAO.
2,3,5-Triphenyltetrazolium Chloride Staining
Immersion staining of 2-mm brain slices with 2,3,5-triphenyl-tetrazolium chloride (TTC) was used to measure tissue viability and evaluate infarct size as previously described [26–29]. Briefly, at the appropriate time following MCAO, rats were anesthetized with 5 % halothane and decapitated. Brains were immediately and carefully dissected and placed in ice-cold saline for 5 min, then placed in a brain matrix and cut into 2-mm coronal slices. Slices were immediately immersed in 2 % TTC solution (in saline) at 37 °C for 30 min. At the end of the incubation period, the sections were removed and placed in 4 % paraformaldehyde (PFA) at 4 °C for post-fixing. Digital images of the brain sections were taken 48 h later.
Immunofluorescence (IF) and Fluorescent In Situ Hybridization (FISH)
At appropriate times, animals were transcardially perfused first with 50 ml ice-cold saline washout, and then with 300 ml ice-cold 4 % PFA. Fixed brains were carefully dissected and immersion fixed overnight. The following day, 50-μm coronal slices through the entire forebrain were obtained via vibratome and stored at −20 °C in cryostat solution until used, as previously described [21, 30, 31].
Double IF/FISH was performed exactly as described previously [21, 23] with poly-T probe at 50 ng/ml. Antisera dilutions for Double IF/FISH were α-tubulin (1:100); COX IV (1:50); GM130 (1:100); HuR (1:25); NeuN (1:500); NF H/M (1:300); PABP (1:250); PDI (1:200); pp32 (1:250); RPA (1:5,000); S6 (1:25); TGN38 (1:200); TIA-1 (1:150); and TTP (1:25). Validation of antisera stainings were previously described: RPA, S6, and TIA-1 [30]; HuR, PABP, pA mRNA, and TTP [21]; and α-tubulin, COX IV, GM130, NeuN, NF H/M, PDI, pp32, and TGN38 [23].
Slides were examined on an Axioplan 2 Imaging System (Carl Zeiss, Oberkochen, Germany) equipped with an ApoTome. Excitation at 488 and 568 nm, and emission at 518 and 600 nm were used for Alexa 488 (green) and Alexa 555 (red), respectively. Optical sectioning was performed using the ×63 oil immersion objective to generate z-stacks as previously described [21–23, 30, 31]. Fluorescent micrographs shown in the figures are orthographic projections of 2.45-μm z-stacks (7×0.35 μ optical sections), unless otherwise stated.
Figure 1a provides a schematic of the brain areas evaluated. There were three post-injury brain areas: (1) the area that corresponds to core in the ipsilateral MCA territory, which included somatomotor cortex and lateral striatum (“SN area,” Fig. 1a), (2) areas adjacent to the core area (“GC area,” Fig. 1a), and (3) the non-ischemic contralateral hemisphere. In each area, we studied four histological regions: (1) cerebral cortex layers II/III, (2) layer V, (3) layer VI, and (4) striatum. For regional histology and colocalization studies, coronal section at 1 mm anterior to Bregma, representative of MCA territory, were evaluated. Twelve z-stacks, one for each histological region in each of the three areas, were acquired at this coronal level (gray dots, Fig. 1a).
Fig. 1.
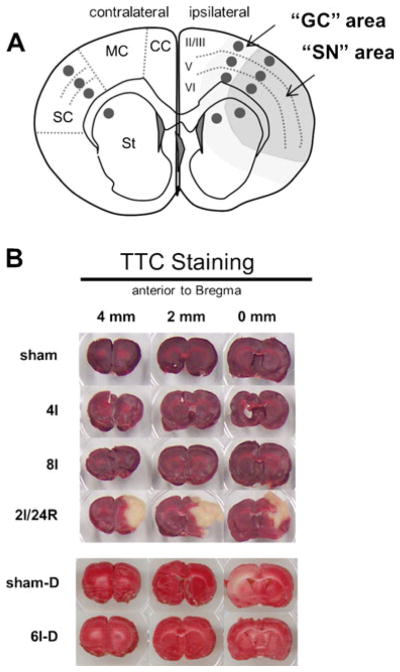
a Schematic coronal section showing 12 areas histologically evaluated in experimental groups (dark gray circles). Brain regions identified in the diagram are (left) cortical regions (sc somatosensory cortex, mc motor cortex, cc cingulate cortex) and striatum (st); (right) layers II/III, V, and VI. On ipsilateral side, larger darker gray area contained shrunken and distorted (SN) neurons, and lighter gray area is location of mRNA granule-containing (GC) neurons. b Representative 2-mm-thick coronal slices immersion stained for TTC from experimental groups as indicated. Position of coronal slice relative to Bregma is indicated. Abbreviations for experimental groups are defined in “Materials and Methods” section
Linear Densitometry of Colocalization
Because we sought to determine the colocalization of mRNA granules and the various antigens, traditional colocalization analyses such as the Costes’ method [32] was not suitable because such methods quantify colocalization at all image pixels and produce too low of a signal-to-noise ratio with respect to mRNA granules. We therefore performed a semi-quantitative analysis using linear densitometry where the region of interest (ROI) was a line drawn through the image, and the density in red and green channels plotted as a function of distance of the ROI line.
Volumetric Reconstruction of pA Staining
To determine the three-dimensional (3D) spatial distribution of pA staining, we performed computer reconstructions of two clearly distinguishable post-injury areas. The first were areas in which neurons contained mRNA granules, which we call mRNA “granule-containing” (GC) areas. Second were areas containing shrunken, distorted, and pycnotic neurons, which we label “shrunken neuron-containing” (SN) areas. Sixteen coronal slices, 100 μm apart, were evaluated between approximately Bregma 1.32 to −0.60 mm, containing the MCA territory. Slices were stained by double labeling with pA FISH and PABP IF. GC and SN areas were determined for each slice under ×20 magnification and marked on photocopies of corresponding coronal sections from the Paxinos and Watson Rat Brain Atlas [33]. All GC areas were confirmed by inspection under the ×40 objective for pA-PABP colocalization in the form of mRNA granules [21]. Determination of GC and SN areas was conducted by two independent observers blinded to the identity of the experimental groups; the independent mappings generally agreed to >90 %.
GC and SN areas were digitized by scanning, and then superimposed onto coronal sections, at the same Bregma coordinates, of the corresponding images of the coronal digital rat brain dataset (1,024×1,024 pixels, 8 bit) from the Laboratory of Neuro Imaging (LONI) from the University of California at Los Angeles [34] (http://www.loni.ucla.edu/Atlases/Atlas_Detail.jsp?atlas_id=1). For illustration and quantitation purposes, reconstructed GC and SN volumes were embedded within 3D reconstructions of the LONI dataset.
From the 16 sequential digitized pA/PABP staining, 3D volumes were generated in Amira 5.2.0 (Visage Imaging, San Diego, CA, USA) as per user manual instructions. Two volumes were constructed per each experimental animal: the SN volume (colored red in the figures) and the GC volume (colored green in the figures). The volume of each was determined by the number of voxels contained inside the reconstructed 3D surface. To express these as percentages, total volume was taken as the number of voxels in one hemisphere of the brain-masked LONI dataset between coordinates +1.34 and −0.66 mm anterior to Bregma. “Total affected volume” was the sum of the SN and GC volumes in an animal. Two different percentages were calculated for a given animal to express the volumetric data (using the GC volumes as examples in the following formulas). Relative percent volume calculated the relative proportion SN or GC occupying the total affected volume, e.g.:
Absolute percent volume calculated the percent of the total LONI dataset volume occupied by the GC or SN, e.g.:
Calculated percentages for experimental groups were averaged, and averages compared using ANOVA, and Tukey post hoc where appropriate, with significance p<0.05.
Results
TTC Staining
None of the pMCAO groups failed to exclude TTC, including diabetic rats (Fig. 1b). At 2I/24R, an infarct of 36.5±8.8 % of the ipsilateral hemisphere formed, localized to the MCA territory encompassing mainly somatomotor cortex and lateral striatum.
Regional Histology of mRNA Granule Formation
Figure 2 presents high-resolution (×63 oil immersion) photomicrographs illustrating the occurrence of mRNA granule-containing neurons in cerebral cortical layer V, layer VI, and striatum. Representative animals were drawn mainly from the 2I and 4I experimental groups. Layer II staining is described in the next section. The mRNA granule colocalization patterns were similar across the 2I, 4I, and 6I experimental groups. Figure 2 illustrates an antigen that colocalized with mRNA granules (PABP), and one that did not colocalize (ribosomal protein S6).
Fig. 2.

Regional histology of mRNA granule-containing neurons in Long Evans rats during pMCAO. a Cerebral cortex layer V, b cerebral cortex layer VI, and c striatum from 2I and 4I samples in coronal slices at 1 mm anterior to Bregma. All photomicrographs are taken at ×63 and are orthographic projections from seven optical slice z-stacks. Double staining pairs and respective colors are indicated by labels. Sham, sham operated non-ischemic control; contralateral, contralateral hemisphere of ischemic sample; ipsilateral granular, ipsilateral hemisphere in peri-infarct penumbra; ipsilateral core, ipsilateral area that will go on to form core at 2I/24R. Post-injury areas are as indicated in Fig. 1a. Scale bar in lower left panel applies to all panels
For each histological region following pMCAO, the contralateral side generally resembled sham-operated NICs. In sham and contralateral, both S6 and PABP colocalized with pA mRNAs in neurons, giving a diffuse orange-yellow hue to the cytoplasm. On the ipsilateral side, cortical neurons in layers V and VI showed mRNA granulation. In the striatum, mRNA granules formed in both the medium spiny neurons, which make up the majority of striatal neurons, and in the large aspiny neurons (Fig. 2c, arrow). In SN areas of the ipsilateral hemisphere, occasionally neurons evidenced concentration of the pA signal in some shrunken and distorted neurons (arrowheads, Fig. 2). Thus, ipsilateral cortical and striatal neurons were capable of forming mRNA granules.
Colocalizations in Layer II Cerebral Cortical Neurons
Since layer II/III neurons showed robust formation of mRNA granules at 2, 4, and 6 h pMCAO, we used them for systematic colocalization of the mRNA granules with a panel of antisera marking intracellular organelles and mRNA-binding proteins. The results described here for the layer II/III cortical neurons also held for mRNA granule-containing neurons in the striatum and in layers V and VI of cerebral cortex. The results are summarized by organelle system. Figure 3a–g shows merged images of pA and markers of intracellular organelles, and Fig. 3h–n illustrates merged images of pA and mRNA binding proteins. Linear densitometry, along with enlarged images of the red and green channels making up the panels in Fig. 3, are shown for NeuN and S6 (Fig. 4) and PABP and HuR (Fig. 5). Linear densitometry and enlarged images of the red and green channels for the remaining antigens are presented in Supplemental Figs. 1, 2, 3, 4, and 5.
Fig. 3.

Colocalization of pA mRNAs and a variety of antigens (a–n), in cerebral cortex layer I of Long Evans rats, as indicated. pA signal is green, and protein stains are red in all cases. Post-injury areas are as indicated in Fig. 1a. All samples are drawn from 2I and 4I experimental groups. Scale bar in lower left panel applies to all panels
Fig. 4.

Individual red and green channels and linear densitometry for a NeuN and pA, and b S6 and pA. Individual channels are derived from respective merged images shown in Fig. 3. For both a and b, left red and green pair is contralateral and right is ipsilateral mRNA granule-containing (GC) area; red and green channels are stained as indicated. The yellow semi-transparent line in each photomicrograph is the line used for linear densitometry. Blue asterisks mark the start of the densitometry are distance = 0 on the corresponding graphs. Below each respective pair of red and green channels is a plot of density (in arbitrary units) vs. distance (also in arbitrary units), where the red curve is the red channel, and green curve the green channel. When shown, asterisks denote peaks that are similar in red and green channels and therefore colocalize. Arrows indicate mRNA granules that do not colocalize with the antigen and correspond to white arrows on pA channel image. Blue boxes mark where densitometry passes through the nucleus. Scale bar in lowest right panel is 10 μm and applies to all photomicrographs
Fig. 5.

Individual red and green channels and linear densitometry for a PABP and pA, and b HuR and pA. Details of figure are the same as described in the legend for Fig. 4
ER and Golgi Apparatus
PDI (Fig. 3a) colocalized with mRNA in the contralateral hemisphere, as evidenced by a yellow hue to the neuron cytoplasm of normal-appearing neurons. Red and green channel linear densities corresponded (Supplemental Fig. 1a). Ipsilaterally, in neurons that contained mRNA granules, the mRNA granules did not colocalize with PDI (Fig. 3a), and this is shown in the densitometric analysis by large pA density peaks with no corresponding peak in the red channel (Supplemental Fig. 1a, arrows). GM130 (Fig. 3b and Supplemental Fig. 1b) and TGN38 (Fig. 3c and Supplemental Fig. 2a) did not colocalize with pA, and densitometric analysis showed large pA peaks in the ipsilateral cells, indicating mRNA granules with no corresponding signal in the antigen red channel. Thus, mRNA granules did not strongly associate with the internal membranes and secretory apparatus of the cell.
Mitochondria
Nor did the mRNA granules colocalize with the mitochondrial marker cytochrome c oxidase subunit IV (Fig. 3d). Prominent staining of dendritic and/or axonal processes is visible in the COX IV channel, but there was no significant colocalization of pA signal in the processes. When mRNA granules were present in the ipsilateral cells, there was no corresponding signal in the COX IV channel (Supplemental Fig. 2b, arrows).
Cytoskeleton
The mRNA granules did not colocalize with α-tubulin (Fig. 3e) or neurofilaments H/M (NF H/M, Fig. 3f). Again, both antigens showed prominent staining of dendritic and/or axonal processes, but there was no significant colocalization of pA signal in the processes. With densitometric analysis, mRNA granules peaks in the pA channel had no corresponding signals in either the NF H/M or α-tubulin channels (Supplemental Fig. 3a, arrows, and b, arrows, respectively).
Nucleus
As observed in hippocampal neurons following global ischemia [23], mRNA granules did colocalize with the well-known neuronal marker NeuN (Fig. 3g) in the cytoplasm. The linear densitometry in the contralateral neurons did not correlate in the two channels, but in the ipsilateral GC-neurons, peaks in both the red and green channels (Fig. 4a, asterisks) corresponded to mRNA granules in the merged images.
Ribosomes
In the contralateral hemisphere ribosomal protein S6 and ribosome P antigen (RPA), markers of the 40S and 60S ribosomal subunits, respectively, and PABP, all colocalized diffusely in the neuronal cytoplasm as indicated by the yellow-orange hue (Fig. 3h–j, respectively). However, the mRNA granules did not colocalize with S6 or RPA on the ipsilateral side. Linear densitometry of S6 showed prominent pA peaks with no corresponding S6 signal (Fig. 4b, arrows), and the same was observed for RPA (Supplemental Fig. 4a, arrow). PABP strongly co-localized mRNA granules (Fig. 3j, ipsilateral), and this was confirmed by the corresponding peaks in the linear density analysis (Fig. 5a, asterisks). Thus, PABP colocalized with mRNA granules, but markers of the 40S and 60S subunit did not.
mRNA Binding Proteins
In the contralateral hemisphere, there was essentially no cytoplasmic colocalization of HuR, pp32, TIA-1, or TTP with the majority of pA signal (Fig. 3k–n, respectively), and this was confirmed by linear densitometry (Fig. 5b, contralateral, and Supplemental Figs. 4b and 5a, b, respectively). For pp32 and TIA-1, in each neuron, there were several small (~1 μm, or ~3–5 pixels in diameter) circular punctate points of colocalization with pA (arrows, Fig. 3l, m). Based on our previous results [30], the punctate particles were stress granules. On the ipsilateral side, many examples could be found of neurons where HuR colocalized with the mRNA granules, and linear densitometry showed corresponding peaks in the red and green channels (Fig. 5b, asterisks). The mRNA granules, however, in no instance colocalized with the HuR accessory protein pp32 (Fig. 3l and Supplemental Fig. 4b, arrows). The mRNA granules did not colocalize with TIA-1 or TTP, again confirmed by linear densitometry where pA peaks lacked corresponding signal in the red channels (Supplemental Fig. 5a, b, arrows).
Summary of Colocalization Studies
In summary, the mRNA granules formed in neurons following focal ischemia did not colocalize with markers of major intracellular organelles, the ribosomal subunits, stress granules, or processing bodies. Similar to global brain I/R [21, 23], the mRNA granules sequestered mRNA away from ribosomes, and into putatively cytoplasmic structures containing the known mRNA binding proteins PABP, HuR, and NeuN.
Volumetric Reconstructions
The above data showed that cortical layers II/III, V, and VI and striatal neurons could form mRNA granules. To quantify this, we performed 3D volumetric reconstructions from coronal slices taken every 100 μm through the MCA territory at various durations of pMCAO.
Figure 6a shows an example, in a 4I rat, of how areas containing neurons with mRNA granules (GC, green areas) and shrunken and distorted neurons (SN, red areas) appeared in rostral-caudal cross sections. Generally, GC and SN areas were mutually exclusive. The GC and SN areas are shown superimposed on the corresponding slices from the LONI rat brain dataset. For this particular rat, mRNA granules were not detected in any striatal neurons. The cells of the lateral striatum were shrunken and distorted, appearing as illustrated in Fig. 2c, SN panels. Neurons of the medial striatum had the same appearance as contralateral or sham-operated striatal neurons. This animal also showed a substantial fraction of cerebral cortex to display shrunken and distorted neurons that ran for some distance across all the cortical layers, mainly in somatosensory cortex. However, significant areas of cerebral cortex contained neurons with cytoplasmic mRNA granules. For this animal, these areas were mostly medial to the SN cortical areas, including motor and cingulate cortex, and were in the watershed area between the MCA and anterior cerebral artery territory.
Fig. 6.

Three-dimensional (3D) reconstructions of mRNA granule-containing neurons with pMCAO duration. a Individual coronal sections taken from the Laboratory of Neuroimaging (LONI) at the University of California at Los Angeles rat brain dataset serving as a backdrop to specify areas with mRNA granule-containing neurons (GC, green) or shrunken and distorted neurons (SN, red). For clarity, only half the dataset used for volumetric reconstruction is illustrated in Fig. 3a; therefore, each slice is separated by 200 μm. b Volumetric reconstructions of representative untreated Long Evans rats (non-diabetic) at pMCAO durations as indicated of mRNA granule-containing volumes (green) and shrunken and distorted neuron volumes (red) embedded in volumetric renderings of the LONI dataset at the same Bregma coordinates as indicated in a. c Averages ± standard deviations of the relative percent volumes of mRNA granule-containing neurons (green bars) and shrunken and distorted neurons (red bars) for untreated Long Evans rats. Blue and cyan curves are exponential (correlation coefficient = 0.91) and linear (correlation coefficient=0.77) fits through the mRNA granule-containing neurons volume averages, respectively. Asterisks indicate Tukey post hoc p<0.05 between core and mRNA granule volumes at the respective pMCAO durations. d Volumetric reconstructions of representative streptozocin-treated Long Evans rats (diabetic) at pMCAO durations as indicated. Shrunken and distorted neuron volumes (red) embedded in volumetric renderings of the LONI dataset at the same Bregma coordinates as indicated in a. e Total affected volumes (average± standard deviation) of diabetic (brown curve) and non-diabetic (cyan) Long Evans as a percentage of one hemisphere of the rendered LONI dataset volume. Average total volumes of mRNA granule-containing (green curves) and shrunken and distorted neurons (red curve); error bars are omitted from these curves for clarity but are proportionally the same as those shown in the plot in c. Asterisk indicates Tukey post hoc p<0.05 for 0.5I diabetic group compared to all other experimental groups
Relative Percentages of GC and SN Areas with Focal Ischemia Duration
Figure 6b shows representative 3D reconstructions from 2I, 4I, 6I, and 8I rats; the 4I sample shown is the corresponding 3D reconstruction from the cross sections in Fig. 6a. The relative percent of GC and SN volumes is plotted in Fig. 6c. At 2hI, 73±39 % of the total affected volume had mRNA granule-containing neurons, and 27±39 % contained shrunken and distorted cells. The relative proportion of mRNA granules-containing neurons dropped to 15.4±5.2 %, 8.6±6.1 %, and 0 %, for the 4I, 6I, and 8I groups, respectively. The 4I and 6I relative percentages of GC and SN volumes cleared statistically from the 2I group (ANOVA p<0.05, Tukey p<0.05).
An exponential curve fit of the relative volume containing mRNA granules (Fig. 6c, dark blue curve) gave a correlation coefficient (cc)=0.91, whereas a linear fit (Fig. 6c, cyan curve) gave cc=0.77. Thus, the relative proportion of affected volume showing mRNA granules dropped off exponentially with ischemia duration such that by 8 h pMCAO, no mRNA granule-containing neurons were detected ipsilaterally.
Effect of Diabetes on mRNA Granules Following Permanent Focal Ischemia
Rats made diabetic for 4–6 weeks after STZ injection were given pMCAO from 30 min to 6 h. At no duration of pMCAO were mRNA granules detected in the forebrain of the diabetic animals (Fig. 6d). In some animals, bilateral damage was detected in terms of neurons appearing shrunken and distorted (4I-D and 6I-D samples, Fig. 6d).
Absolute Percent of Affected Tissue Volume
Figure 6e plots the absolute affected volumes of the ipsilateral hemispheres (as defined in “Materials and Methods” section) for both the non-diabetic and diabetic animals. The non-diabetic affected volume was 49.9±27 % at 2I, and increased to 64±8 % at 8I, but there was no statistical difference across non-diabetic groups (Fig. 6e, cyan curve). Thus, roughly speaking, the total number of affected neurons is the same from 2I to 8I, but their phenotypes transformed from a mix of GC and SN at 2I to exclusively SN at 8I. For the 0.5I diabetic rats, the SN neurons occupied 27.7±7 % of the total volume, and this increased to 49.2±17 % in the 6I diabetic group. Only the 0.5I group was statistically different from the remaining diabetic groups or the non-diabetics.
Discussion
We observed that mRNA granules form in neurons during permanent focal cerebral ischemia and have the same colocalization profile as neuronal mRNA granules observed after global brain ischemia [21, 23]. Our characterization of the temporal and spatial dependence of mRNA granule formation leads to the inference that there are intrinsic limits to neuronal stress responses during ischemia, which has therapeutic implications.
Infarct Detection
No infarct was detected in any of the pMCAO groups, but the 2 h transient MCAO was infarcted at 24 h reperfusion. This result is consistent with our previously published studies where reperfusion was required to produce an infarct detectable by TTC [27–29]. A plausible explanation for lack of a gross infarct in the pMCAO groups is that the hemodynamic capacity of collateral circulation prevented frank necrosis during the pMCAO, a known critical factor modulating infarct formation, and that reperfusion was required for secondary injury leading to infarct in the transient MCAO animals [35]. As discussed below, even though TTC was insensitive to cell damage in the pMCAO groups, the double labeling detected morphological changes in neurons indicative of a damage phenotype.
mRNA Granule Formation in Permanent Focal Ischemia
mRNA granules do not form during global ischemia (unpublished result), but require reperfusion and depend upon polysome dissociation [36]. It is therefore reasonable to ask how mRNA granules could form following pMCAO. We showed that phosphorylation of the alpha subunit of eIF2 (eIF2α) also does not occur during ischemia, but requires reperfusion [37]. However, investigation of eIF2α phosphorylation in a transient MCAO model revealed it was highest at the end of 2 h MCAO and declined during the subsequent reperfusion [38]. This suggests that in the GC areas, there is enough residual blood flow to allow eIF2α phosphorylation, and therefore polysome dissociation and mRNA granule formation. This interpretation is consistent with the fact that neurons in the heart of the MCA territory, where blood flow is lowest, did not form mRNA granules (Fig. 4).
mRNA Granule Colocalization Patterns
The mRNA granules seen after MCAO did not colocalize with the 40S and 60S ribosomal subunits. This is putative evidence that the GC areas are undergoing TA. The location of GC areas is consistent with studies from Hossmann’s group that localized decreased radioactive incorporation after focal ischemia [39]. The colocalization profile with the other antisera was identical to that of hippocampal neurons following global ischemia [21, 23]. Of all the antisera tested, only PABP, HuR, and NeuN, all of which are mRNA binding proteins [23], colocalized with the mRNA granules.
The lack of colocalization with the secretory system, the mitochondria, and cytoskeleton support that the mRNA granules are cytoplasmic structures. While lack of colocalization with the cis- (GM130) and trans- (TGN38) Golgi markers was relatively distinct, there was more overlap with the ER marker PDI, mainly in the contralateral neurons lacking mRNA granules. This partial colocalization is consistent with ER being a site of translation. However, that mRNA granules did not colocalize with PDI suggests they are not physically associated with the ER membrane.
HuR colocalization with the mRNA granules supports that the mRNA granules are a form of HuR granule [17, 18]. HuR granules have diverse functions [40]. We have shown an enrichment of adenine- and uridine-rich element (ARE) mRNAs, the binding targets of HuR, on reperfused polysomes after global ischemia (see Syzmanski et al., this issue [41]), supporting a role for the mRNA granules in post-transcriptional regulation after I/R. It is reasonable to hypothesize that a similar mechanism occurs in GC neurons after focal ischemia, and this possibility remains to be investigated. We showed that HuR colocalization with the mRNA granules predicted outcome after global I/R [21]. The present study did not perform a detailed investigation of patterns of HuR colocalization but instead focused on describing the spatial distribution of GC areas, a prerequisite to performing more complex histological analyses. Future studies will need to determine if GC areas after focal ischemia show a similar correlation between survival and HuR colocalization with the mRNA granules.
mRNA Granules Spatial Distributions in pMCAO
Because focal ischemia generates a complex blood flow gradient, we measured the 3D distribution of mRNA granule-containing neurons. We identified two distinguishable areas in the ipsilateral hemisphere: GC and SN. The SN areas occurred in the main MCA territory, and presumably is the precursor to the infarct core. This contention is supported by the overlap of the SN areas with the core area in the transient MCAO animals (Fig. 1b). The GC areas tended to surround, and to interdigitate the periphery of, the SN areas (Fig. 6a). It is tempting to assign the GC phenotype as penumbra, but such thinking is probably oversimplified. First, there is no generally agreed definition of penumbra, and the term tends to be defined operationally [42, 43]. Second, penumbral neurons are heterogeneous in terms of patterns of gene expression and protein markers [44]. Granting these considerations, it is not unreasonable to suggest that GC areas may provide an additional window on the penumbra phenomenon.
mRNA Granules Time Course in pMCAO
It is notable in the present study that the sum of SN and GC volumes in non-diabetics was equal to the SN volume in the 8I samples. This indicates that the MCAO affected a relatively fixed volume of brain. Following pMCAO, the maximum extent of core formation is determined within 3–6 h [35, 45, 46]. This is precisely the duration over which the total number of mRNA granule containing neurons dropped off, to be replaced with shrunken and distorted neurons. Thus, we can interpret our data to indicate that GC neurons mounted the mRNA granule response early in the pMCAO period, but eventually converted to the SN phenotype.
Inhibition of mRNA Granulation by Diabetes
It was an unexpected finding that diabetes inhibited neuronal mRNA granule formation. It is well known that chronic diabetes causes immunological [47], vascular [48, 49], and intracellular [50–53] damage, all of which negatively impact stroke outcome. Immunological responses upset the extracellular environment of neurons; vascular disturbances can increase the intensity of the ischemic insult; and intracellular changes can directly damage neurons.
The effect of diabetes on intracellular conditions includes decreased cytoplasmic pH [50], increased free radicals [52], inhibition of mitochondrial oxidative phosphorylation [53], and activation of apoptotic pathways [27]. Any of these damage mechanisms, individually or in combination, could inhibit mRNA granule formation. For example, a rate-limiting component of mRNA granule formation may be rendered inactive by oxidative stress, proteolysis, or acidosis. These are testable hypotheses for future studies to address how diabetes in combination with pMCAO inhibits mRNA granule formation.
It is also of interest to note that SN neurons were observed bilaterally in the present study. While we did nothing to experimentally test why this was the case, a likely mechanism may be any of the forms of diaschisis identified in ischemic brains where damage occurs in sites remote from the occlusion [54].
In summary, the net result of multiple forms of diabetes-induced damage, on top of focal ischemia, inhibited mRNA granule formation, suggesting that the penumbra or area at risk is inherently decreased in diabetics undergoing focal brain ischemia.
Degrees of Neuronal Responses
Our results revealed a range of insult magnitude over which the neurons mounted the mRNA granule response. With increased insult intensity, via longer pMCAO durations or augmented by the exogenous stressor diabetes, the mRNA granule response was inhibited. This observation is consistent with our dynamical model of cell injury, which predicts that damage will overwhelm stress responses at increased insult intensity [55]. The significance of connecting the present observations to the dynamical model is that the model predicts that bistability is the mechanism allowing a lethally injured cell to survive [55, 56]. We have here made a first attempt to quantify the phenotypic changes of the neurons, including altering “initial condition” by pre-inducing diabetes. More refined measurements along the present lines could provide quantitative input into the dynamical model, which in turn would predict when successful neuroprotection is possible [56].
Summary and Conclusions
The present study, in combination with our previous work on the mRNA granules response following global brain ischemia [21–23], allows us to conclude that formation of mRNA granules is a generic response of neurons to both focal and global ischemia. The most significant aspect of the present study is to have shown a direct link between insult intensity and mRNA granule formation. This provides an initial quantitative assessment of the neuronal response to ischemia that, coupled with the proper theoretical analysis [56], could allow the maximum extraction of neuroprotective potential from this particular injury system.
Supplementary Material
Acknowledgments
We would like to thank Dr. Natalie N. Rizk for teaching M.K.L. how to perform the MCAO model. This work was sponsored by NIH NINDS Grant No. NS057167 (D.J.D.), an NINDS Minority Supplement to M.K.L. on Grant No. NS057167, and NIH IMSD Grant No. GM58905-8 (J.C.D. and M.K.L.), and a Thomas C. Rumble Fellowship, Wayne State University (J.T.J.).
Abbreviations
- CA
Cornu Ammonis
- CCA
Common carotid artery
- COX IV
Cytochrome c oxidase subunit IV
- DND
Delayed neuronal death
- eIF2
Eukaryotic initiation factor-2
- ER
Endoplasmic reticulum
- FISH
Fluorescent in situ hybridization
- GM130
cis-Golgi matrix marker 130 kDa
- IF
Immunofluorescence histochemistry
- IP
Intraperitoneal
- I/R
Ischemia and reperfusion
- LONI
Laboratory of Neuroimaging at University of California Los Angeles
- MCA
Middle cerebral artery
- MCAO
Middle cerebral artery occlusion
- NeuN
Neuronal nuclei
- NF H/M
Neurofilament heavy and medium weight chains
- pA
Polyadenylated mRNAs
- PABP
Polyadenylated mRNA-binding protein
- PDI
Protein disulfide isomerase
- pMCAO
Permanent MCAO
- RPA
Ribosomal P antigen
- SG
Stress granules
- S6
Constituent protein of the 40S small ribosomal subunit
- STZ
Streptozocin
- TA
Translation arrest
- TGN38
trans-Golgi network 38 kDa antigen
- TIA-1
T-cell internal antigen
- TTC
2,3,5-Triphenyltetrazolium chloride
- TTP
Tristetraprolin
Footnotes
Electronic supplementary material The online version of this article (doi:10.1007/s12975-013-0274-1) contains supplementary material, which is available to authorized users.
Conflicts of interest The authors declare that they have no conflict of interest. All institutional and national guidelines for the care and use of laboratory animals were followed.
Contributor Information
Monique K. Lewis, Department of Physiology, Wayne State University School of Medicine, 4116 Scott Hall, 540 East Canfield Ave, Detroit, MI 48201, USA
Jill T. Jamison, Department of Physiology, Wayne State University School of Medicine, 4116 Scott Hall, 540 East Canfield Ave, Detroit, MI 48201, USA
Joseph C. Dunbar, Department of Physiology, Wayne State University School of Medicine, 4116 Scott Hall, 540 East Canfield Ave, Detroit, MI 48201, USA
Donald J. DeGracia, Email: ddegraci@med.wayne.edu, Department of Physiology, Wayne State University School of Medicine, 4116 Scott Hall, 540 East Canfield Ave, Detroit, MI 48201, USA. Center for Molecular Medicine and Genetics, Wayne State University School of Medicine, Detroit, MI 48201, USA
References
- 1.Panniers R. Translational control during heat shock. Biochimie. 1994;76:737–47. doi: 10.1016/0300-9084(94)90078-7. [DOI] [PubMed] [Google Scholar]
- 2.Narasimhan P, Swanson RA, Sagar SM, Sharp FR. Astrocyte survival and HSP70 heat shock protein induction following heat shock and acidosis. Glia. 1996;17:147–59. doi: 10.1002/(SICI)1098-1136(199606)17:2<147::AID-GLIA6>3.0.CO;2-#. [DOI] [PubMed] [Google Scholar]
- 3.McEwen E, Kedersha N, Song B, Scheuner D, Gilks N, Han A, et al. Heme-regulated inhibitor kinase-mediated phosphorylation of eukaryotic translation initiation factor 2 inhibits translation, induces stress granule formation, and mediates survival upon arsenite exposure. J Biol Chem. 2005;280(17):16925–33. doi: 10.1074/jbc.M412882200. [DOI] [PubMed] [Google Scholar]
- 4.Halford NG, Hey S, Jhurreea D, Laurie S, McKibbin RS, Zhang Y, et al. Highly conserved protein kinases involved in the regulation of carbon and amino acid metabolism. J Exp Bot. 2004;55:35–42. doi: 10.1093/jxb/erh019. [DOI] [PubMed] [Google Scholar]
- 5.Kedersha N, Anderson P. Regulation of translation by stress granules and processing bodies. Prog Mol Biol Transl Sci. 2009;90:155–85. doi: 10.1016/S1877-1173(09)90004-7. [DOI] [PMC free article] [PubMed] [Google Scholar]
- 6.Hossmann KA. Disturbances of cerebral protein synthesis and ischemic cell death. Prog Brain Res. 1993;96:161–77. doi: 10.1016/s0079-6123(08)63265-3. [DOI] [PubMed] [Google Scholar]
- 7.Hata R, Maeda K, Hermann D, Mies G, Hossmann KA. Dynamics of regional brain metabolism and gene expression after middle cerebral artery occlusion in mice. J Cereb Blood Flow Metab. 2000;20:306–15. doi: 10.1097/00004647-200002000-00012. [DOI] [PubMed] [Google Scholar]
- 8.Kleihaus P, Hossmann KA. Protein synthesis in the cat brain after prolonged cerebral ischemia. Brain Res. 1971;35:409–18. doi: 10.1016/0006-8993(71)90484-7. [DOI] [PubMed] [Google Scholar]
- 9.DeGracia DJ. Acute and persistent protein synthesis inhibition following cerebral reperfusion. J Neurosci Res. 2004;15:771–6. doi: 10.1002/jnr.20225. [DOI] [PubMed] [Google Scholar]
- 10.Martín de la Vega C, Burda J, Nemethova M, Quevedo C, Alcazar A, Martin ME, et al. Possible mechanisms involved in the down-regulation of translation during transient global ischaemia in the rat brain. Biochem J. 2001;357:819–26. doi: 10.1042/0264-6021:3570819. [DOI] [PMC free article] [PubMed] [Google Scholar]
- 11.Mengesdorf T, Proud CG, Mies G, Paschen W. Mechanisms underlying suppression of protein synthesis induced by transient focal cerebral ischemia in mouse brain. Exp Neurol. 2002;177:538–46. doi: 10.1006/exnr.2002.8002. [DOI] [PubMed] [Google Scholar]
- 12.Liu CL, Ge P, Zhang F, Hu BR. Co-translational protein aggregation after transient cerebral ischemia. Neuroscience. 2005;134:1273–84. doi: 10.1016/j.neuroscience.2005.05.015. [DOI] [PMC free article] [PubMed] [Google Scholar]
- 13.Hu BR, Janelidze S, Ginsberg MD, Busto R, Perez Pinzon M, Sick TJ, et al. Protein aggregation after focal brain ischemia and reperfusion. J Cereb Blood Flow Metab. 2001;21:865–75. doi: 10.1097/00004647-200107000-00012. [DOI] [PubMed] [Google Scholar]
- 14.Anderson P, Kedersha N. Stress granules. Curr Biol. 2009;19:R397–8. doi: 10.1016/j.cub.2009.03.013. [DOI] [PubMed] [Google Scholar]
- 15.Kedersha N, Stoecklin G, Ayodele M, Yacono P, Lykke-Andersen J, Fitzler MJ, et al. Stress granules and processing bodies are dynamically linked sites of mRNP remodeling. J Cell Biol. 2005;169:871–84. doi: 10.1083/jcb.200502088. [DOI] [PMC free article] [PubMed] [Google Scholar]
- 16.Kedersha N, Tisdale S, Hickman T, Anderson P. Real-time and quantitative imaging of mammalian stress granules and processing bodies. Methods Enzymol. 2008;448:521–52. doi: 10.1016/S0076-6879(08)02626-8. [DOI] [PubMed] [Google Scholar]
- 17.Gao FB, Keene JD. Hel-N1/Hel-N2 proteins are bound to poly(A)+ mRNA in granular RNP structures and are implicated in neuronal differentiation. J Cell Sci. 1996;109:579–89. doi: 10.1242/jcs.109.3.579. [DOI] [PubMed] [Google Scholar]
- 18.Antic D, Keene JD. Messenger ribonucleoprotein complexes containing human ELAV proteins: interactions with cytoskeleton and translational apparatus. J Cell Sci. 1998;111:183–97. doi: 10.1242/jcs.111.2.183. [DOI] [PubMed] [Google Scholar]
- 19.Keene JD. Minireview: global regulation and dynamics of ribonucleic acid. Endocrinology. 2010;151:1391–7. doi: 10.1210/en.2009-1250. [DOI] [PMC free article] [PubMed] [Google Scholar]
- 20.DeGracia DJ, Jamison JT, Szymanski JJ, Lewis MK. Translation arrest and ribonomics in post-ischemic brain: layers and layers of players. J Neurochem. 2008;106:2288–301. doi: 10.1111/j.1471-4159.2008.05561.x. [DOI] [PMC free article] [PubMed] [Google Scholar]
- 21.Jamison JT, Kayali F, Rudolph J, Marshall M, Kimball SR, DeGracia DJ. Persistent redistribution of poly-adenylated mRNAs correlates with translation arrest and cell death following global brain ischemia and reperfusion. Neuroscience. 2008;154:504–20. doi: 10.1016/j.neuroscience.2008.03.057. [DOI] [PMC free article] [PubMed] [Google Scholar]
- 22.Jamison JT, Lewis MK, Kreipke CW, Rafols JA, DeGracia DJ. Polyadenylated mRNA staining reveals distinct neuronal phenotypes following endothelin 1, focal brain ischemia, and global brain ischemia/reperfusion. Neurol Res. 2011;33:145–61. doi: 10.1179/016164111X12881719352255. [DOI] [PMC free article] [PubMed] [Google Scholar]
- 23.Jamison JT, Szymanski JJ, DeGracia DJ. Organelles do not colocalize with mRNA granules in post-ischemic neurons. Neuroscience. 2011;199:394–400. doi: 10.1016/j.neuroscience.2011.09.015. [DOI] [PMC free article] [PubMed] [Google Scholar]
- 24.Bonfa E, Marshak-Rothstein A, Weissbach H, Brot N, Elkon K. Frequency and epitope recognition of anti-ribosome P antibodies from humans with systemic lupus erythematosus and MRL/lpr mice are similar. J Immunol. 1988;140:3434–7. [PubMed] [Google Scholar]
- 25.Hatashita T, Ito M, Miyaoka M, Ishii S. Chronological alterations of regional cerebral blood flow, glucose utilization, and edema formation after focal ischemia in hypertensive and normotensive rats. Significance of hypertension. Adv Neuro. 1990;52:29–37. [PubMed] [Google Scholar]
- 26.Li ZG, Britton M, Sima AA, Dunbar JC. Diabetes enhances apoptosis induced by cerebral ischemia. Life Sci. 2004;76:249–62. doi: 10.1016/j.lfs.2004.03.039. [DOI] [PubMed] [Google Scholar]
- 27.Rizk NN, Myatt-Jones J, Rafols J, Dunbar JC. Insulin like growth factor-1 (IGF-1) decreases ischemia-reperfusion induced apoptosis and necrosis in diabetic rats. Endocrine. 2007;31:66–71. doi: 10.1007/s12020-007-0012-0. [DOI] [PubMed] [Google Scholar]
- 28.Rizk NN, Rafols J, Dunbar JC. Cerebral ischemia induced apoptosis and necrosis in normal and diabetic rats. Brain Res. 2005;1053:1–9. doi: 10.1016/j.brainres.2005.05.036. [DOI] [PubMed] [Google Scholar]
- 29.Rizk NN, Rafols JA, Dunbar JC. Cerebral ischemia-induced apoptosis and necrosis in normal and diabetic rats: effects of insulin and C-peptide. Brain Res. 2006;1096:204–12. doi: 10.1016/j.brainres.2006.04.060. [DOI] [PubMed] [Google Scholar]
- 30.Kayali F, Montie HL, Rafols JA, DeGracia DJ. Prolonged translation arrest in reperfused hippocampal cornu Ammonis 1 is mediated by stress granules. Neuroscience. 2005;134:1223–45. doi: 10.1016/j.neuroscience.2005.05.047. [DOI] [PubMed] [Google Scholar]
- 31.DeGracia DJ, Rafols JA, Morley SJ, Kayali F. Immunohistochemical mapping of total and phosphorylated eukaryotic initiation factor 4G in rat hippocampus following global brain ischemia and reperfusion. Neuroscience. 2006;139:1235–48. doi: 10.1016/j.neuroscience.2006.01.038. [DOI] [PubMed] [Google Scholar]
- 32.Costes SV, Daelemans D, Cho EH, Dobbin Z, Pavlakis G, Lockett S. Automatic and quantitative measurement of protein-protein colocalization in live cells. Biophys J. 2004;86:3993–4003. doi: 10.1529/biophysj.103.038422. [DOI] [PMC free article] [PubMed] [Google Scholar]
- 33.Paxinos G, Watson C. The rat brain in stereotaxic coordinates. 5. Amsterdam: Elsevier; 2005. [DOI] [PubMed] [Google Scholar]
- 34.Toga AW, Santori EM, Hazani R, Ambach K. A 3D digital map of rat brain. Brain Res Bull. 1995;38:77–85. doi: 10.1016/0361-9230(95)00074-o. [DOI] [PubMed] [Google Scholar]
- 35.Hossmann KA. Pathophysiology and therapy of experimental stroke. Cell Mol Neurobiol. 2006;26:1057–83. doi: 10.1007/s10571-006-9008-1. [DOI] [PMC free article] [PubMed] [Google Scholar]
- 36.Szymanski JJ, Jamison JT, DeGracia DJ. Texture analysis of poly-adenylated mRNA staining following global brain ischemia and re-perfusion. Comput Methods Programs Biomed. 2012;105(1):81–94. doi: 10.1016/j.cmpb.2011.03.005. [DOI] [PMC free article] [PubMed] [Google Scholar]
- 37.DeGracia DJ, Adamczyk S, Folbe AJ, Konkoly LL, Pittman JE, Neumar RW, et al. Eukaryotic initiation factor 2alpha kinase and phosphatase activity during postischemic brain reperfusion. Exp Neurol. 1999;155:221–7. doi: 10.1006/exnr.1998.6986. [DOI] [PubMed] [Google Scholar]
- 38.Althausen S, Mengesdorf T, Mies G, Olah L, Nairn AC, Proud CG, et al. Changes in the phosphorylation of initiation factor eIF-2alpha, elongation factor eEF-2 and p70 S6 kinase after transient focal cerebral ischaemia in mice. J Neurochem. 2001;78:779–7. doi: 10.1046/j.1471-4159.2001.00462.x. [DOI] [PubMed] [Google Scholar]
- 39.Mies G, Ishimaru S, Xie Y, Seo K, Hossmann KA. Ischemic thresholds of cerebral protein synthesis and energy state following middle cerebral artery occlusion in rat. J Cereb Blood Flow Metab. 1991;11(5):753–61. doi: 10.1038/jcbfm.1991.132. [DOI] [PubMed] [Google Scholar]
- 40.Hinman MN, Lou H. Diverse molecular functions of Hu proteins. Cell Mol Life Sci. 2008;65:3168–81. doi: 10.1007/s00018-008-8252-6. [DOI] [PMC free article] [PubMed] [Google Scholar]
- 41.Szymanski JJ, Wang H, Jamison JT, DeGracia DJ. HuR function and translational state analysis following global brain ischemia and re-perfusion. Transl Stroke Res. 2013 doi: 10.1007/s12975-013-0273-2. [DOI] [PMC free article] [PubMed] [Google Scholar]
- 42.Back T. Pathophysiology of the ischemic penumbra—revision of a concept. Cell Mol Neurobiol. 1998;18:621–38. doi: 10.1023/A:1020629818207. [DOI] [PMC free article] [PubMed] [Google Scholar]
- 43.del Zoppo GJ, Sharp FR, Heiss WD, Albers GW. Heterogeneity in the penumbra. J Cereb Blood Flow Metab. 2011;31:1836–51. doi: 10.1038/jcbfm.2011.93. [DOI] [PMC free article] [PubMed] [Google Scholar]
- 44.Sharp FR, Lu A, Tang Y, Millhorn DE. Multiple molecular penumbras after focal cerebral ischemia. J Cereb Blood Flow Metab. 2000;20:1011–32. doi: 10.1097/00004647-200007000-00001. [DOI] [PubMed] [Google Scholar]
- 45.Gyngell ML, Busch E, Schmitz B, Kohno K, Back T, Hoehn-Berlage M, et al. Evolution of acute focal cerebral ischaemia in rats observed by localized 1H MRS, diffusion-weighted MRI, and electrophysiological monitoring. NMR Biomed. 1995;8:206–14. doi: 10.1002/nbm.1940080505. [DOI] [PubMed] [Google Scholar]
- 46.Hata R, Maeda K, Hermann D, Mies G, Hossmann KA. Evolution of brain infarction after transient focal cerebral ischemia in mice. J Cereb Blood Flow Metab. 2000;20:937–46. doi: 10.1097/00004647-200006000-00006. [DOI] [PubMed] [Google Scholar]
- 47.Panés J, Kurose I, Rodriguez-Vaca D, Anderson DC, Miyasaka M, Tso P, et al. Diabetes exacerbates inflammatory responses to ischemia-reperfusion. Circulation. 1996;93:161–7. doi: 10.1161/01.cir.93.1.161. [DOI] [PubMed] [Google Scholar]
- 48.Kalani M. The importance of endothelin-1 for microvascular dysfunction in diabetes. Vasc Health Risk Manag. 2008;4:1061–8. doi: 10.2147/vhrm.s3920. [DOI] [PMC free article] [PubMed] [Google Scholar]
- 49.van Golde JM, Ruiter MS, Schaper NC, Vöö S, Waltenberger J, Backes WH, et al. Impaired collateral recruitment and outward remodeling in experimental diabetes. Diabetes. 2008;57:2818–23. doi: 10.2337/db08-0229. [DOI] [PMC free article] [PubMed] [Google Scholar]
- 50.Siesjö BK, Katsura KI, Kristián T, Li PA, Siesjö P. Molecular mechanisms of acidosis-mediated damage. Acta Neurochir Suppl. 1996;66:8–14. doi: 10.1007/978-3-7091-9465-2_2. [DOI] [PubMed] [Google Scholar]
- 51.Chrissobolis S, Miller AA, Drummond GR, Kemp-Harper BK, Sobey CG. Oxidative stress and endothelial dysfunction in cerebrovascular disease. Front Biosci. 2011;16:1733–45. doi: 10.2741/3816. [DOI] [PubMed] [Google Scholar]
- 52.Rains JL, Jain SK. Oxidative stress, insulin signaling, and diabetes. Free Radic Biol Med. 2011;50:567–75. doi: 10.1016/j.freeradbiomed.2010.12.006. [DOI] [PMC free article] [PubMed] [Google Scholar]
- 53.Mastrocola R, Restivo F, Vercellinatto I, Danni O, Brignardello E, Aragno M, et al. Oxidative and nitrosative stress in brain mitochondria of diabetic rats. J Endocrinol. 2005;187:37–44. doi: 10.1677/joe.1.06269. [DOI] [PubMed] [Google Scholar]
- 54.Andrews RJ. Transhemispheric diaschisis. A review and comment. Stroke. 1991;22:943–9. doi: 10.1161/01.str.22.7.943. [DOI] [PubMed] [Google Scholar]
- 55.DeGracia DJ, Huang ZF, Huang S. A nonlinear dynamical theory of cell injury. J Cereb Blood Flow Metab. 2012;32(6):1000–13. doi: 10.1038/jcbfm.2012.10. [DOI] [PMC free article] [PubMed] [Google Scholar]
- 56.DeGracia DJ. A program for solving brain ischemia. Brain Sci. 2013;3(2):460–503. doi: 10.3390/brainsci3020460. [DOI] [PMC free article] [PubMed] [Google Scholar]
Associated Data
This section collects any data citations, data availability statements, or supplementary materials included in this article.