Abstract
Ras proteins are attached to the inner leaflet of the plasma membrane via a lipid-modified anchor. Membrane-bound Ras proteins laterally segregate into nanoscale signaling platforms called nanoclusters. It has been shown that the membrane domain preference of Ras nanoclusters varies with the nature of lipidation but their effect on the membrane has not been well understood. To investigate the effect of Ras insertion on membrane structure, we carried out numerous coarse-grained molecular dynamics (CGMD) simulations on a two-domain DPPC/DLiPC/cholesterol lipid bilayer in which different number and type of H-ras peptides were attached on one side. We have shown previously that this lipid mixture forms co-existing liquid-ordered/liquid-disordered (Lo/Ld) domains and that different H-ras peptides form clusters that variously accumulate at the Lo/Ld regions or the boundary between them. Here we show that asymmetric insertion of each of these peptides induces a vertical relative displacement of the domains and deforms the bilayer, with the domain boundary serving as the center of deformation. The extent of the deformation, however, varies with the type and number of lipid modification. This is because the number and type of the Ras lipid tails determines the degree to which the stress caused by asymmetric peptide insertion is relieved by inter-leaflet cholesterol transfer and lipid tilt. In addition, we have characterized the mechanism of bilayer deformation based on the collective effect of the Ras peptides on inter-leaflet surface area, pressure profile and line tension differences. This allowed us to elucidate how Ras lipid modification affects membrane geometry and how a two-domain bilayer adjusts its shape through boundary deformation. The result contributes to a better understanding of Ras signaling platforms and highlights some of the mechanisms by which a multi-domain membrane responds to external perturbation.
Keywords: Ras, lipid modification, membrane domain, molecular dynamics, membrane shape
1. Introduction
Ras proteins act as molecular switches in cell signaling pathways to regulate cell growth, proliferation and differentiation1. They are normally anchored to the inner surface of the plasma membrane by a lipid-modified C-terminus, which also plays an important role in the formation of nanoscale signaling platforms called nanoclusters2. The three human Ras isoforms (H-, N-, K-Ras) share a highly conserved catalytic domain but differ in sequence as well as in the number and type of lipid modification at the C-terminus1. This variation in lipid modification has been suggested as the primary reason for the non-overlapping distribution of nanoclusters of different Ras isoforms in the plasma membrane2, 3. A similar behavior has been observed in model membranes with co-existing raft-like liquid-ordered (Lo) and non-raft liquid-disordered (Ld) lipid domains4, 5. K-Ras, which contains a single farnesyl modification, prefers the Ld domain enriched with unsaturated lipids5. N-ras is modified by a palmitoyl and a farnesyl lipid and prefers the Lo/Ld domain boundary4. The dually palmitoylated and farnesylated H-ras reportedly localizes at the Lo domain6.
Membrane binding7–13 and nanoclustering2, 3, 6, 14, 15 of Ras proteins have been relatively well characterized. Fewer studies have focused on how Ras insertion affects the structure of the host membrane16–20. For instance, using solid state NMR and molecular dynamics simulations, Vogel et al investigated N-Ras and a peptide representing its lipidated C-terminus in different bilayer systems16, 21, 22. They showed that the local lipid packing is slightly affected by N-ras insertion. Similarly, our previous studies on the isolated H-Ras lipid anchor and full-length H-ras in a DMPC bilayer have suggested small structural perturbation of the bilayer18, 19. In another study of the K-ras lipid anchor in a mixed bilayer, we found that the positively charged peptide clusters negatively charged POPG lipids and induces local thinning in the bilayer20. These observations had shed some light on the effect of monomeric Ras on simple model membranes. The impact of clustered Ras proteins on more complex heterogeneous membranes remains unknown.
In previous reports, we used CGMD to investigated the nanoclustering behavior of the minimal membrane binding motif of H-ras (tH), and its mutants with different lipid modification (Fig. 1), embedded in one leaflet of a DPPC/DLiPC/cholesterol bilayer that forms Lo/Ld domains14, 15, 23. Accumulation of tH nanoclusters in a specific region of an initially symmetric bilayer led to deformation. This observation was difficult to explain based solely on the steric effect of asymmetric insertion14. As a result, the physical basis for the deformation was not fully explored. The primary goal of this work was to further probe this issue using a detailed analysis of our CGMD trajectories.
Fig. 1.

Sequence and lipid modification of the H-ras peptides used in this study.
The response of a multi-domain membrane to Ras insertion can be complicated by the presence of the domain boundary. This is because the free energy of a multi-domain membrane has contributions from both domain bending and boundary line energies24 and therefore the equilibrium shape can be tuned by changes in individual bending moduli or line tension. For instance, increasing the line tension can lead to contraction or even budding of the central domain from the surrounding domain, which reduces the inter-domain contact length24–26. Although a molecular-level picture of a multi-domain membrane is beyond the resolution limit of most current experimental techniques, continuum elasticity theory and CGMD simulations have been extensively used to study the link between structure and mechanics in multi-domain membranes27, 28. According to these studies, a compositionally symmetric planar bilayer containing Lo and Ld domains is mirror-symmetric across the bilayer mid-plane and there is a smooth thickness change at the transition region between the domains27, 28. How such a membrane would respond to an asymmetric insertion of laterally segregated membrane proteins remains an open question. Herein we extended our previous work to systematically investigate the deformation of a bilayer upon an asymmetric insertion of Ras peptides that harbor different number and type of lipid modifications. The results provided a mechanistic picture of how clustered lipidated peptides remodel the host membrane.
2. Methods
Model and CGMD simulations
Mixed lipid bilayers with and without Ras peptides were modeled by the MARTINI force field version 2.029, 30 (Fig. 2) and simulated by the GROMACS package version 4.031. Details of the models and simulation protocol can be found in our previous reports14, 15. Briefly, four sets of simulations were conducted (Supplementary information Table S1). The first is a compositionally symmetric reference bilayer made up of 960 DPPC, 576 DLiPC and 384 cholesterol molecules14. In the second set 16, 32, 48 and 64 tH peptides were embedded into the lower leaflet of a bilayer with identical lipid composition as in the reference bilayer15. In the third set the cholesterol fraction was varied between 0%, 11%, 20% and 27% keeping a fixed concentration of 64 tH peptides15. The final set of simulations involved four mutant tH peptides that have one or two lipid modifications14 (Fig. 1). Each simulation was run for 40μs effective time.
Fig. 2.
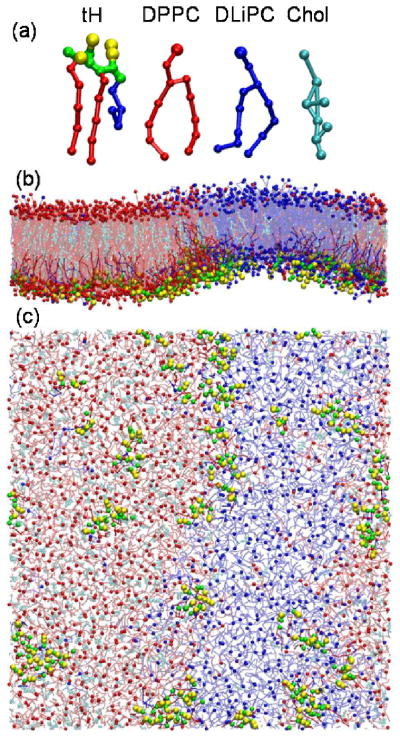
Molecular models and snapshots. (a) Coarse-grained molecular model of the tH peptide and lipids. (b) Side view of the bilayer from the domain boundary direction. (c) Bottom view of the bilayer. Water molecules are not shown. Snapshots were taken at t=24μs for the system with 64 tH peptides embedded in a 5:3:2 DPPC:DLiPC:Chol bilayer.
Data analysis
A combination of in-house scripts and GROMACS31 tools were used to analyze the well-equilibrated 24–403s portion of each trajectory. Equilibrium structural properties of the bilayer were calculated by binning the system into equal slabs in the direction perpendicular to the domain boundary line with the center of the Ld domain as origin (after removal of domain center motion). Bilayer shapes were characterized based on the average z-position of the phosphate beads and the terminal beads of the lipid tails. The bilayer structure was characterized using the conformation of individual lipid molecules. As commonly done in the theory of membrane elasticity32–34, we decomposed the bilayer elastic deformation into contributions from area expansion/compression, lipid tilt and lipid splay. The latter two deformation modes were analyzed in detail because they are more applicable to a tensionless bilayer27. Lipid splay was monitored by the average width (w) and height (h) of individual lipids, calculated as the distance between the terminal beads of the tails and between the phosphate group and the center-of-mass of the two tail terminal beads, respectively. Local lipid tilt was monitored by the average tilt angle (ϕ) of individual lipids, defined as the deviation of the lipid tail director vector n (the head-to-tail principal axis excluding the choline bead) from the normal of the local monolayer surface N. Note that ϕ is different from the lipid orientation angle φ in our previous report14, which was the deviation of the lipid head-to-tail principal axis from the global normal of the bilayer surface.
3. Results
The shape and structure of the bilayer without any peptide is described first, followed by bilayers that contain peptides harboring different type and number of lipid modification. We then turn to the mechanism of bilayer deformation due to asymmetric peptide insertion.
3.1 Structure of the reference planar bilayer with coexisting Lo/Ld domains
The equilibrated tH-free bilayer has two striped domains: a DPPC/cholesterol-enriched Lo domain and a DLiPC-enriched Ld domain. Each monolayer of the Lo domain was thicker than the corresponding Ld monolayer by ~0.5nm, as has been shown previously14. The bilayer was mirror symmetric across the common mid-plane of the two domains (Fig. 3a) and exhibited a strong inter-leaflet domain registration28, as seen from the nearly identical lipid density profiles at the two leaflets (Fig. S1a). The tightly packed lipids in the Lo domain were taller (large h) and their tails less spread (small w) than those in the Ld domain (Fig. 3b). The bilayer shape, density, h, and w all showed a smooth transition at the boundary regions. Lipids at the narrow (~4.7nm) Lo/Ld domain boundary region have to slightly tilt away from the local monolayer surface normal to accommodate the curved surface (Fig. 3c). Lipids in the boundary region experienced larger fluctuation (see the standard deviations in the plots of Fig. 3a) due to the relative motion of the domains along the bilayer normal.
Fig. 3.
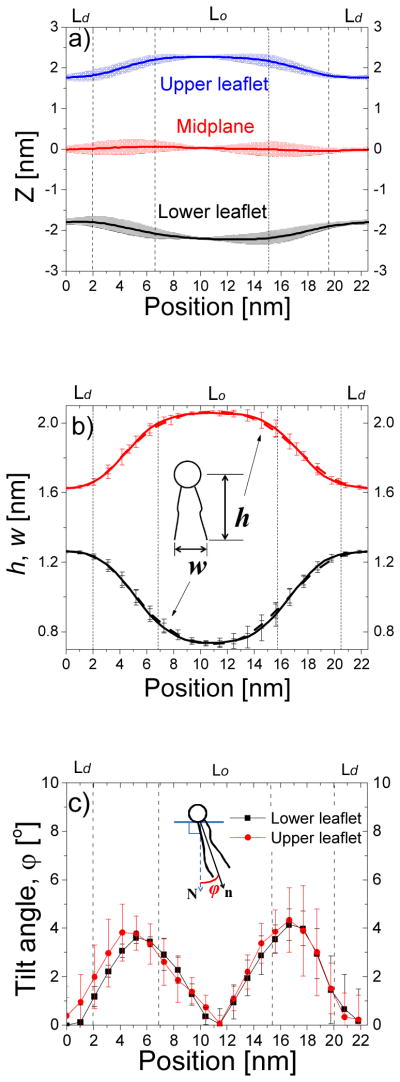
Shape and structure of the tH-free bilayer along the direction perpendicular to the domain boundary. (a) Bilayer shape described by the monolayer surfaces and the mid-plane. Each monolayer surface was represented by the average z-position of its phosphate beads, and the mid-plane by the average z-position of the last lipid tail beads of both monolayers. (b) Lipid height (h) and width (w) for the upper (dash line) and lower (solid line) monolayer. (c) Lipid tilt angle of the upper (square) and lower (circle) monolayer. Errors were calculated by block-averaging after separating the 16-μs trajectory evenly into 5 time blocks.
3.2 Peptide-induced bilayer deformation
Insertion of 64 tH peptides into the lower leaflet induced curvature at both leaflets (Fig. 4). Both domains were nearly flat at their centers but underwent vertical displacement relative to each other. For instance, the mid-plane of the Lo domain was displaced by ~1.5nm at the center relative to the tH-free bilayer (Fig. 4a, see also Fig. 5a for a schematic explanation). This vertical displacement increased the vertical distance between the Ld and Lo surfaces from ~0.5nm (tH-free) to ~1.9nm (tH-bound) in the lower leaflet. The corresponding increase in the upper leaflet was smaller (from 0.5 to 1.0nm). The displacement mainly occurred at the domain boundary (Fig. 4a). The domain boundary, where the shape fluctuation was highest, is therefore the center for deformation. This was confirmed by the finding that a bilayer containing the same numbers of DPPC, DLiPC and tH but lacking cholesterol (hence no stripped domains) remained essentially flat (Fig. S2).
Fig. 4.
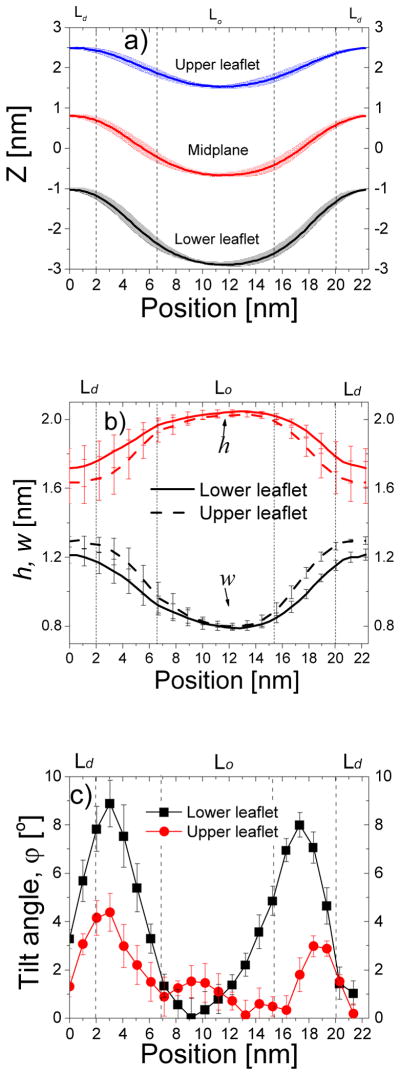
Shape and structure of a bilayer containing 64 tH peptides along the direction perpendicular to the domain boundary. (a) Shape of the bilayer described by monolayer surfaces and the mid-plane. Each monolayer surface was represented by the average z-position of its phosphate beads, and the mid-plane by the average z-position of the last lipid tail beads of both monolayers. (b) Lipid height (h) and width (w) for the upper (dash line) and lower (solid line) monolayer. (c) Lipid tilt angle of the upper (square) and lower (circle) monolayer. Errors were calculated as described in Fig. 3.
Fig. 5.
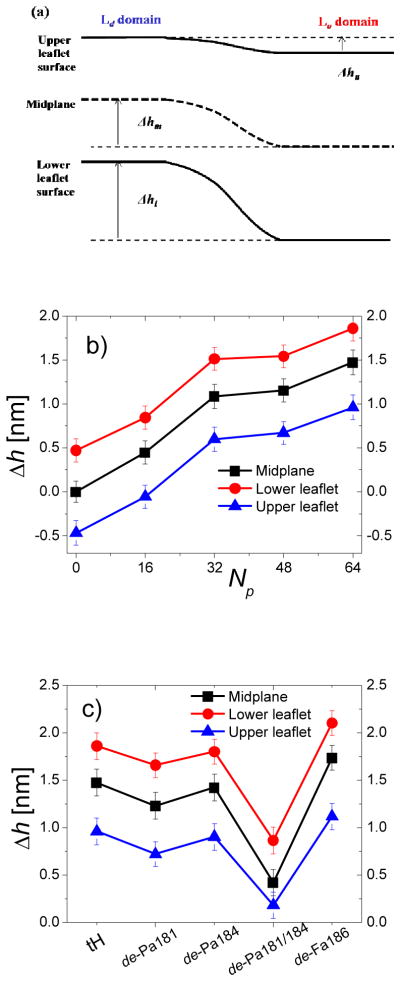
Peptide-induced bilayer deformation. (a) Schematic representation of the vertical distance between the two domains of the lower leaflet (hl), midplane (hm) and upper leaflet (hu). (b) Vertical domain displacements for bilayers containing different number of tH peptides. (c) Vertical domain displacements for bilayers containing the same number of tH peptides with different types of lipid modifications. Errors were calculated as described in Fig. 3.
There were fewer cholesterol molecules in the lower leaflet than in the upper due to displacement by tH (Fig. S1b). Moreover, despite the overall similarities in the density distributions of DPPC and DLiPC in the two monolayers, there were some important differences. First, the distributions did not overlap as well as they did in the tH-free bilayer (Fig. S1a), suggesting reduced inter-leaflet domain registration. Secondly, the slightly smaller DLiPC density in the upper Ld domain suggested comparatively tighter packing in the corresponding region of the lower monolayer. This was reversed in the case of the DPPC lipids at the Lo domain. These observations suggest that tH binding had a differential effect, albeit small, on the packing behavior of lipids at the two monolayers of each domain. This resulted in larger w and smaller h for the upper monolayer, especially in the narrow Ld and the boundary regions (Fig. 4b). More dramatic change was found for ϕ (Fig. 4c), where lipids with large ϕ populate the entire domain boundary of the lower leaflet, suggesting that the domain boundary is the major deformation center. Taken together, these results show that the lower leaflet undergoes a large deformation compared to the upper leaflet, and that the bilayer deformed mainly through lipid tilt instead of splay. This is consistent with a previous prediction that the tilt mode, which is only weakly coupled across monolayers, can effectively modulate bilayer shape35.
The lateral dimension and hence domain width of the bilayer was only slightly different among simulations with different tH concentration (table S1). Therefore, we used domain displacement to test the dependence of bilayer deformation on peptide concentration, (Fig. 5a, and S3). The corresponding average vertical displacement (Δh) is shown in Fig. 5b for bilayers containing different amount of tH peptides. One can see that the extent of bilayer deformation varies with peptide concentration so that the displacement progressively increases with the number of tH. For instance, at the lowest tH concentration (16 peptides) the upper surface was nearly flat with no height difference between the Ld and Lo domain, while for Np=64 Δhm reached ~1.5nm. Moreover, the domain displacements (Fig. 6c and S4), varied with the type of lipid modification and hence the domain preference of the peptides. In fact, the extent of bilayer deformation significantly depend on the domain-preference of the peptides14, with the Lo-localized de-Fa186 causing the largest displacement and the Ld-localized de-Pa181/184 causing the least displacement. Peptides containing farnesyl and at least one palmitoyl, and hence segregating to the domain boundary, have similar and intermediate effect on the bilayer shape. Taken together these results indicate that bilayer deformation is a function of both the concentration and domain preference of the lipidated Ras peptides. Moreover, there appear to be an intriguing trend that suggests a progressively larger effect on the bilayer structure as the peptides’ domain preference shifts from the disordered Ld to the ordered Lo domain.
Fig. 6.
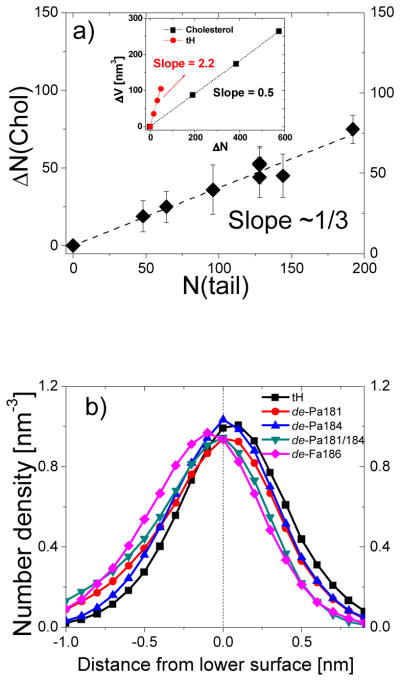
Monolayer composition asymmetry. (a) Differences in the average cholesterol number between the upper and the lower leaflet versus the number of peptide lipid tails. Errors for ΔN(Chol) were calculated by averaging over the 16-μs trajectory. Inset: simulation box volume increase versus the number of cholesterol and tH molecules. The volume difference due to cholesterol was calculated for systems containing increasing amount of cholesterol and 960 DPPC, 576 DLiPC and 64 tH molecules. The volume difference due to tH molecule was calculated for the bilayers containing increasing amount of tH and 960 DPPC, 576 DLiPC and 384 cholesterol molecules. Errors for the volume are within the range of the symbols. (b) Number density profiles of the peptide backbone beads along the z-dimension, with the local monolayer surface defined as the origin.
3.3 Mechanism of bilayer deformation
Inter-leaflet compositional asymmetry
No flip-flop of DPPC or DLiPC was observed within the time scale of the simulations. Cholesterol has a faster flip-flop rate28, 36 and can undergo inter-leaflet transfer upon peptide insertion. This was the case in all tH-containing bilayers where a fraction of the lower leaflet cholesterol has moved to the upper leaflet at the early stage of the simulation (Fig. S5). The number of transferred cholesterols was found to be proportional to the total number of peptide lipid tails (slope = 1/3, see Fig. 6a). Thus, on average 3 tH tails expelled one cholesterol and thereby minimized the volume difference between the two leaflets. As cholesterol increases monolayer bending rigidity37, such an inter-leaflet cholesterol transfer should lead to a larger bending rigidity of the upper leaflet. On the other hand, experiments38 and MD simulation36 have shown that rapid inter-leaflet re-equilibration of cholesterol reduces the overall membrane stress and allows membrane shape relaxation. Taken together these results suggest that without the relaxation by cholesterol transfer a larger bilayer curvature would have occurred.
To test if cholesterol flip-flop compensated for the entire inter-leaflet volume difference, we looked at changes in the box volume (ΔV) upon increasing the number of cholesterol or tH in the system. We found a 4-fold larger ΔV per peptide than ΔV per cholesterol (Fig. 6a). Thus, cholesterol transfer only partly reduced the inter-leaflet volume difference. This suggests that the remaining excess volume in the lower leaflet, largely due to the adsorption of the peptide backbone and the non-lipidated side chains in the lipid-water interface of the lower leaflet, should be responsible for the observed bilayer deformation (discussed in the previous section).
Monolayer area difference due to peptide insertion
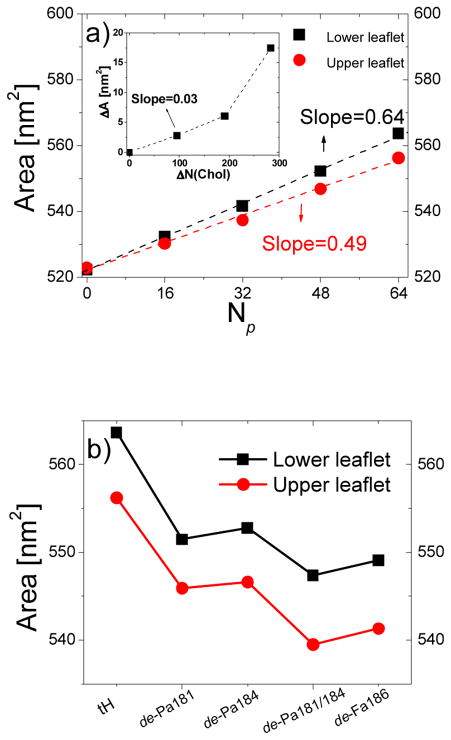
Fig. 6b shows that the backbone resides near the head-group region and therefore can contribute to monolayer surface area expansion. We computed monolayer surface area (As) from the product of the average length of the monolayer surface curves (Fig. 3a, 4a and S4) (i.e., the side perpendicular to the boundary line) and the length of the box parallel to the boundary line. Fig. 7a shows that, for each monolayer, As increases linearly with the peptide concentration. The surface area expansion was ~23% larger for the lower monolayer (~0.64nm2/tH) than the upper (~0.49nm2/tH). These values are much greater than ΔA/cholesterol (~0.03–0.1nm2, derived from Fig. 7a (inset)). Considering the 1:1 expulsion ratio of cholesterol to tH, it is clear that the upper leaflet area expansion was much higher than the possible contribution from the transferred cholesterol molecules.
Fig. 7.
Monolayer surface area. (a) Monolayer surface area increase due to insertion of different numbers of tH molecules at the lower leaflet. Inset: the corresponding monolayer surface area. (b) Monolayer surface area increase due to insertion of the same number of peptides that have different lipid modifications. Errors were calculated as described in Fig. 3 and within the range of the symbols.
It is not feasible to precisely resolve the partial specific area of each constituent in such a complex mixture39. However, it is possible to determine the average effect of tH and its partially de-lipidated variants on the monolayer areas. Fig. 7b shows that the surface area varies both with the number and type of lipid modification. The triply lipidated tH caused the largest increase in As while the variant with just farnesyl (de-Pa181/184) had the smallest effect. The doubly lipidated de-Pa181, de-Pa184 and de-Fa186 had an intermediate effect, with de-Fa186 causing the minimal area increase among them. The reason for the later is that the insertion depth of de-Fa186 into the tightly packed Lo domain was less than those of de-Pa181 or de-Pa184 (Fig. 6b). This suggests that insertion depth of the tails and backbone of the peptides affects the bilayer surface area. Moreover, tH and its variants have positive spontaneous curvature due to the volume difference between their hydrophobic tail and polar head. Coupled with the expulsion of cholesterol molecules, which have intrinsic negative curvature, the positive curvature of the peptides can enhance the spontaneous curvature of the lower leaflet. To further investigate this issue, below we discuss the consequence of the excess volume/surface area in the lower leaflet, plus the difference in the shape and distribution of the peptides and cholesterol, on the properties of the bilayer.
Pressure profile, surface tension and line tension
A potential consequence of inter-leaflet compositional asymmetry is to induce pressure profile asymmetry36, 40. The pressure profile of the tH-free bilayer, calculated along the z-direction41, was symmetric across the mid-plane (Fig. 8a). In the presence of tH, the magnitude of the negative peak in the lower leaflet was reduced and shifted toward the surface in a concentration dependent manner. Correspondingly, the pressure profile in the upper leaflet increased and the negative peak shifted toward the core. The effect is less pronounced for the two lowest tH concentrations (Fig. 8a). The type of lipid modification (and hence domain preference) also had a significant effect on the pressure profile (Fig. 8b). The single-tailed de-Pa181/184 had the minimal effect since it preferred the loosely packed Ld domain.
Fig. 8.
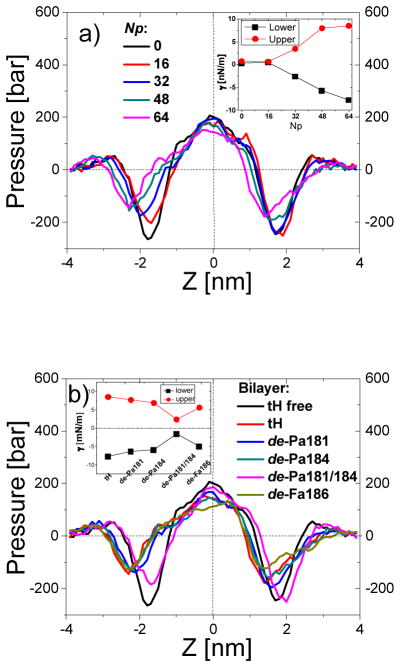
Bilayer pressure profile and monolayer surface tension. (a) Bilayer pressure profile along the z-direction and monolayer surface tension (inset) for bilayers containing different amounts of tH peptides. (b) Bilayer pressure profile along the z-driection and monolayer surface tension (inset) for bilayers containing 64 peptides with different lipid modifications.
We have also calculated monolayer surface tension (γ) from the pressure profiles (Fig. 8a&b, insets). As expected, γ was close to zero for the symmetric tH-free and the nearly symmetric ternary bilayer with 16 tHs (Fig. 8a) but it changed dramatically when the number of tH was 32 or higher. Consistent with the opposite bending of the two monolayers γ was positive for the upper leaflet and negative for the lower leaflet. This suggests that the lower leaflet drives the deformation while the coupled upper leaflet responds by expanding its area, which is consistent with our conclusion from monolayer surface area analysis. Overall, tH caused the largest change in surface area and inter-leaflet surface tension while de-Pa181/184 had the smallest effect on both (Figs. 8b and 8b inset). Note that because the bilayer was tensionless the sum of monolayer surface tensions is close to zero in every case.
A smooth Ld/Lo transition at domain boundaries can reduce exposure of the tails of the Lo lipids27. This was the case in the tH-free bilayer (Fig. 3a), where a progressive adjustment of lipid conformation and composition within the ~5nm-wide boundary region ensured a smooth transition. The line tension (σ) at the boundary was 4.5±0.5pN14 per monolayer, as estimated from boundary fluctuation analysis14, 42. In most cases tH binding had negligible effect on σ of the upper monolayer but generally reduced σ of the lower monolayer (Fig. 9a). tH variants affected σ of either monolayer, depending on the type of lipid modification and/or their domain preference (Fig. 9b). For instance, the Ld-enriched de-Pa181/184 reduced the line tension of the upper leaflet whereas the Lo-enriched de-Fa186 affected the lower leaflet. The common feature among all of the peptides is that they caused an imbalance in the monolayer line tensions.
Fig. 9.
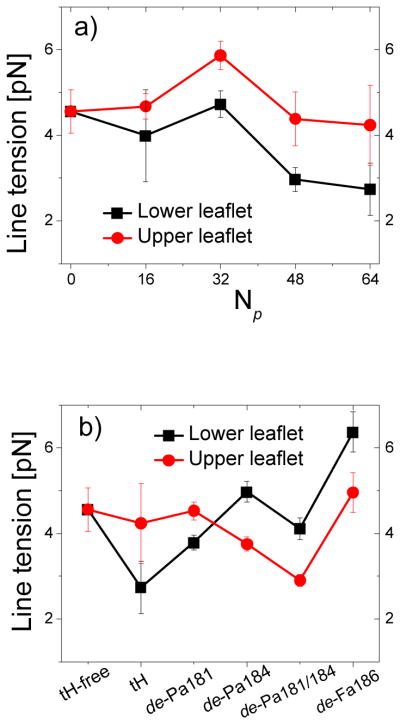
Line tension. (a) Monolayer line tension for bilayers containing different amounts of tH peptides. (b) Monolayer line tension for bilayers containing the same amount (Np=64) of peptides with different lipid modifications. Errors were calculated as described in Fig. 3.
4. Discussion
In this work we have investigated how asymmetric insertion and domain-specific aggregation of lipid-modified Ras peptides affect the geometry of a two-domain bilayer. Design of the model system was based on the fact that Ras proteins are attached to the inner surface of the plasma membrane. Once inserted, the peptides laterally segregate into different membrane domains2, 9. Starting from an initially symmetric bilayer and monitoring its evolution over time, we were able to characterize the effect of different Ras peptides to the bilayer topology. Analysis of the bilayer volume and surface area provided details about the distinct effects of the peptide backbone and lipid tails. Though lipid modification dictates domain preference, the insertion depth of the backbone also plays an important role not only in peptide-membrane interaction but also in affecting membrane geometry. It is important to mention that previous studies indicated the catalytic domain of full-length Ras proteins may also interact with the membrane surface and hence affect bilayer structure43, 44, which is the subject of future studies.
In recent years, N- and K-ras proteins have been successfully incorporated into heterogeneous model lipid membranes with coexisting Lo and Ld domains5,9. Our observation that palmitolyation drives Ras towards Lo domain and farnesylation drives Ras towards Ld domain agrees well with the experimental observations that N-ras prefers the domains boundary and K-ras prefers the Ld domain5,9. With the insertion of Ras onto the surface of a giant unilamellar vesicle with Lo/Ld co-existence, it is possible to test our predictions by comparing the vesicle shape with a Ras-free vesicle. For example, when localizing at the domain boundary, H- and N-ras may increase the positive spontaneous curvature of the host monolayer and decrease the domain boundary line tension and eventually alter the vesicle shape. It is expected that such effect would heavily depend on the concentration of Ras proteins.
Our investigation of the various modes of bilayer deformation upon insertion of different Ras peptides provided important information about the structural characteristics of a two-domain bilayer. For a symmetric lipid bilayer with co-existing Lo/Ld domains, mirror symmetry across the mid-plane was maintained and the line tension was the same for the two monolayers. Upon an asymmetric insertion of Ras peptides, however, the bilayer adjusted its shape via a fast inter-leaflet cholesterol re-distribution and enhanced lipid tilt. The bilayer tends to deform through the domain boundary irrespective of a peptide’s domain preference. This result highlights the important role of the boundary in facilitating membrane shape adjustment. The Lo domain is more rigid and therefore tends to move or deform as a patch relative to the Ld domain, subjecting the stress reservoir boundary region to deformation. Absorption of stress is consistent with the observed high probability of budding and vesiculation through domain boundaries in model membranes24–26.
5. Conclusion
In summary, the influence of the membrane-binding motif of Ras proteins on bilayer structure described in this study provides a mechanistic insight into how lipid-modified proteins affect membrane geometry. By analyzing the deformation of a two-domain bilayer upon an asymmetric peptide insertion we were able to show that the domain boundary plays an essential role for membrane geometry modulation. These insights help link predictions from continuum elastic membrane models24, 25, 27 and observations from experiments26 on how multi-domain membranes respond to perturbation.
Supplementary Material
Acknowledgments
We thank the National Institutes of Health Institute of General Medicine (RO10GM100078) and the UThealth Innovation for cancer Prevention Research Postdoctoral Fellowship by the UThealth School of Public Health and Cancer Prevention and Research Institute of Texas (RP101503) for financial support, and the Texas Advanced Computing Center for computational resources. We also thank members of the Gorfe laboratory for fruitful discussions.
Footnotes
Supplementary Information about the bilayer density profile, shape for bilayers containing different numbers of tH and its variants and inter-leaflet cholesterol transfer are available.
Disclaimer
The content is solely the responsibility of the authors and does not necessarily represent the official views of the funding agency.
References
- 1.Karnoub AE, Weinberg RA. Nat Rev Mol Cell Biol. 2008;9:517–531. doi: 10.1038/nrm2438. [DOI] [PMC free article] [PubMed] [Google Scholar]
- 2.Abankwa D, Gorfe AA, Hancock JF. Semin Cell Dev Biol. 2007;18:599–607. doi: 10.1016/j.semcdb.2007.08.003. [DOI] [PMC free article] [PubMed] [Google Scholar]
- 3.Hancock JF. Nat Rev Mol Cell Biol. 2003;4:373–384. doi: 10.1038/nrm1105. [DOI] [PubMed] [Google Scholar]
- 4.Nicolini C, Baranski J, Schlummer S, Palomo J, Lumbierres-Burgues M, Kahms M, Kuhlmann J, Sanchez S, Gratton E, Waldmann H, Winter R. J Am Chem Soc. 2006;128:192–201. doi: 10.1021/ja055779x. [DOI] [PubMed] [Google Scholar]
- 5.Weise K, Kapoor S, Denter C, Nikolaus J, Opitz N, Koch S, Triola G, Herrmann A, Waldmann H, Winter R. J Am Chem Soc. 2011;133:880–887. doi: 10.1021/ja107532q. [DOI] [PubMed] [Google Scholar]
- 6.Plowman SJ, Muncke C, Parton RG, Hancock JF. Proc Natl Acad Sci U S A. 2005;102:15500–15505. doi: 10.1073/pnas.0504114102. [DOI] [PMC free article] [PubMed] [Google Scholar]
- 7.Brunsveld L, Waldmann H, Huster D. BBA-Biomembranes. 2009;1788:273–288. doi: 10.1016/j.bbamem.2008.08.006. [DOI] [PubMed] [Google Scholar]
- 8.Gorfe AA. Curr Med Chem. 2010;17:1–9. doi: 10.2174/092986710789957832. [DOI] [PubMed] [Google Scholar]
- 9.Weise K, Huster D, Kapoor S, Triola G, Waldmann H, Winter R. Faraday Discuss. 2013;161:549–561. doi: 10.1039/c2fd20100c. [DOI] [PubMed] [Google Scholar]
- 10.Gorfe AA, Pellarin R, Caflisch A. J Am Chem Soc. 2004;126:15277–15286. doi: 10.1021/ja046607n. [DOI] [PubMed] [Google Scholar]
- 11.Gorfe AA, Babakhani A, McCammon JA. Angew Chem Int Ed Engl. 2007;46:8234–8237. doi: 10.1002/anie.200702379. [DOI] [PMC free article] [PubMed] [Google Scholar]
- 12.Gorfe AA, McCammon JA. J Am Chem Soc. 2008;130:12624–12625. doi: 10.1021/ja805110q. [DOI] [PMC free article] [PubMed] [Google Scholar]
- 13.Gorfe AA, Baron R, McCammon JA. Biophys J. 2008;95:3269–3277. doi: 10.1529/biophysj.108.136481. [DOI] [PMC free article] [PubMed] [Google Scholar]
- 14.Janosi L, Li Z, Hancock JF, Gorfe AA. Proc Natl Acad Sci U S A. 2012;109:8097–8102. doi: 10.1073/pnas.1200773109. [DOI] [PMC free article] [PubMed] [Google Scholar]
- 15.Li Z, Janosi L, Gorfe AA. J Amer Chem Soc. 2012;134:17278–17285. doi: 10.1021/ja307716z. [DOI] [PMC free article] [PubMed] [Google Scholar]
- 16.Vogel A, Reuther G, Weise K, Triola G, Nikolaus J, Tan KT, Nowak C, Herrmann A, Waldmann H, Winter R, Huster D. Angew Chem Int Ed Engl. 2009;48:8784–8787. doi: 10.1002/anie.200903396. [DOI] [PubMed] [Google Scholar]
- 17.Vogel A, Reuther G, Roark MB, Tan KT, Waldmann H, Feller SE, Huster D. BBA-Biomembranes. 2010;1798:275–285. doi: 10.1016/j.bbamem.2009.09.023. [DOI] [PubMed] [Google Scholar]
- 18.Gorfe AA, Babakhani A, McCammon JA. J Am Chem Soc. 2007;129:12280–12286. doi: 10.1021/ja073949v. [DOI] [PMC free article] [PubMed] [Google Scholar]
- 19.Gorfe AA, Hanzal-Bayer M, Abankwa D, Hancock JF, McCammon JA. J Med Chem. 2007;50:674–684. doi: 10.1021/jm061053f. [DOI] [PubMed] [Google Scholar]
- 20.Janosi L, Gorfe AA. Biophys J. 2010;99:3666. doi: 10.1016/j.bpj.2010.10.031. [DOI] [PMC free article] [PubMed] [Google Scholar]
- 21.Vogel A, Katzka CP, Waldmann H, Arnold K, Brown MF, Huster D. J Am Chem Soc. 2005;127:12263–12272. doi: 10.1021/ja051856c. [DOI] [PubMed] [Google Scholar]
- 22.Vogel A, Tan KT, Waldmann H, Feller SE, Brown MF, Huster D. Biophys J. 2007;93:2697–2712. doi: 10.1529/biophysj.107.104562. [DOI] [PMC free article] [PubMed] [Google Scholar]
- 23.Li Z, Gorfe AA. Small GTPase. 2012;3:244–247. doi: 10.4161/sgtp.21829. [DOI] [PMC free article] [PubMed] [Google Scholar]
- 24.Lipowsky R. J Phys II. 1992;2:1825–1840. [Google Scholar]
- 25.Jülicher F, Lipowsky R. Phys Rev Lett. 1993;70:2964–2967. doi: 10.1103/PhysRevLett.70.2964. [DOI] [PubMed] [Google Scholar]
- 26.Baumgart T, Hess ST, Webb WW. Nature. 2003;425:821–824. doi: 10.1038/nature02013. [DOI] [PubMed] [Google Scholar]
- 27.Kuzmin PI, Akimov SA, Chizmadzhev YA, Zimmerberg J, Cohen FS. Biophys J. 2005;88:1120–1133. doi: 10.1529/biophysj.104.048223. [DOI] [PMC free article] [PubMed] [Google Scholar]
- 28.Risselada HJ, Marrink SJ. Proc Natl Acad Sci U S A. 2008;105:17367–17372. doi: 10.1073/pnas.0807527105. [DOI] [PMC free article] [PubMed] [Google Scholar]
- 29.Marrink SJ, Risselada HJ, Yefimov S, Tieleman DP, de Vries AH. J Phys Chem B. 2007;111:7812–7824. doi: 10.1021/jp071097f. [DOI] [PubMed] [Google Scholar]
- 30.Monticelli L, Kandasamy SK, Periole X, Larson RG, Tieleman DP, Marrink SJ. J Chem Theory Comput. 2008;4:819–834. doi: 10.1021/ct700324x. [DOI] [PubMed] [Google Scholar]
- 31.Hess B, Kutzner C, Van Der Spoel D, Lindahl E. J Chem Theory Comput. 2008;4:435–447. doi: 10.1021/ct700301q. [DOI] [PubMed] [Google Scholar]
- 32.Helfrich W. Z naturforsch. 1973;28:693–703. doi: 10.1515/znc-1973-11-1209. [DOI] [PubMed] [Google Scholar]
- 33.Hamm M, Kozlov M. Eur Phys J B. 1998;6:519–528. [Google Scholar]
- 34.Hamm M, Kozlov M. Eur Phys J E. 2000;3:323–335. [Google Scholar]
- 35.Seifert U, Shillcock J, Nelson P. Phys Rev Lett. 1996;77:5237–5240. doi: 10.1103/PhysRevLett.77.5237. [DOI] [PubMed] [Google Scholar]
- 36.Yoo J, Cui Q. Biophys J. 2009;97:2267–2276. doi: 10.1016/j.bpj.2009.07.051. [DOI] [PMC free article] [PubMed] [Google Scholar]
- 37.Hofsäß C, Lindahl E, Edholm O. Biophys J. 2003;84:2192–2206. doi: 10.1016/S0006-3495(03)75025-5. [DOI] [PMC free article] [PubMed] [Google Scholar]
- 38.Bruckner R, Mansy S, Ricardo A, Mahadevan L, Szostak J. Biophys J. 2009;97:3113–3122. doi: 10.1016/j.bpj.2009.09.025. [DOI] [PMC free article] [PubMed] [Google Scholar]
- 39.Edholm O, Nagle JF. Biophys J. 2005;89:1827–1832. doi: 10.1529/biophysj.105.064329. [DOI] [PMC free article] [PubMed] [Google Scholar]
- 40.Esteban-Martín S, Risselada HJ, Salgado J, Marrink SJ. J Amer Chem Soc. 2009;131:15194–15202. doi: 10.1021/ja904450t. [DOI] [PubMed] [Google Scholar]
- 41.Ollila OHS, Risselada HJ, Louhivuori M, Lindahl E, Vattulainen I, Marrink SJ. Phys Rev Lett. 2009;102:78101. doi: 10.1103/PhysRevLett.102.078101. [DOI] [PubMed] [Google Scholar]
- 42.Esposito C, Tian A, Melamed S, Johnson C, Tee SY, Baumgart T. Biophys J. 2007;93:3169–3181. doi: 10.1529/biophysj.107.111922. [DOI] [PMC free article] [PubMed] [Google Scholar]
- 43.Abankwa D, Hanzal-Bayer M, Ariotti N, Plowman SJ, Gorfe AA, Parton RG, McCammon JA, Hancock JF. EMBO J. 2008;27:727–735. doi: 10.1038/emboj.2008.10. [DOI] [PMC free article] [PubMed] [Google Scholar]
- 44.Abankwa D, Gorfe AA, Inder K, Hancock JF. Proc Natl Acad Sci U S A. 2010;107:1130–1135. doi: 10.1073/pnas.0903907107. [DOI] [PMC free article] [PubMed] [Google Scholar]
Associated Data
This section collects any data citations, data availability statements, or supplementary materials included in this article.


