

Abstract
The basal ganglia are thought to play a critical role in duration perception and production. However, experimental evidence for impaired temporal processing in Parkinson’s disease (PD) patients is mixed. This study examined the association between striatal dopaminergic denervation in PD patients and sensorimotor synchronization. Twenty-eight mild-to-moderate stage PD patients synchronized finger taps to tone sequences of either 500 ms, 1000 ms or 1500 ms time intervals while ON levodopa (L-DOPA) or placebo pill (on separate test days) with the index finger of their more and less affected hands. We measured the accuracy and variability of synchronization. In a separate session, patients underwent 11C-dihydrotetrabenazine (11C-DTBZ) PET scanning to measure in vivo striatal dopaminergic denervation. Patients were less accurate synchronizing to the 500 ms target time interval, compared to the 1000 and 1500 ms time intervals, but neither medication state nor hand affected accuracy; medication state, hand nor the target time interval affected synchronization variability. Regression analyses revealed no strong relationships between synchronization accuracy or variability and striatal dopaminergic denervation. We performed a cluster analysis on the degree of dopaminergic denervation to determine whether patient subgroup differences underlie our results. Three patient subgroups showed behavioral differences in synchronization accuracy, but not variability, paralleling their pattern of denervation. These findings provide further evidence for the role of the basal ganglia and dopamine in duration production and suggest that the degree of striatal dopaminergic denervation may explain the heterogeneity of performance between PD patients on the sensorimotor synchronization task.
Keywords: Positron emission tomography, Dopaminergic denervation, Parkinson’s disease, Basal ganglia, Paced finger tapping, Duration production
1. Introduction
A central goal in the temporal processing literature is to identify the neural bases of duration perception and production. Duration perception and production rely upon a distributed neural network that includes the basal ganglia, cerebellum, supplementary motor area, premotor cortex and prefrontal regions [1–4]. However, the role of these specific regions within the timing network is not yet well understood, due in part to rather mixed findings from both the neuropsychological and neuroimaging literature.
One approach to untangle the mixed literature on the neural bases of duration perception and production has been to group studies by task characteristics such as the type of task (e.g., perceptual vs. motor) and timescale (e.g., subsecond vs. suprasecond) to determine whether these factors differentially recruit regions of the timing network [cf. 5, 6–9]. Accordingly, differential activation within the timing network has been shown for the automatic timing of subsecond durations that ‘do not require attention’ and cognitively controlled timing of suprasecond discrete events [7, 10]. Automatic timing tends to activate motor and premotor cortices, while cognitively controlled timing recruits prefrontal and parietal cortices. However, regions such as the basal ganglia and cerebellum tend to be activated for both automatic and cognitively controlled timing, suggesting that these regions support general temporal processing function [7, 10, 11, but see 12].
There is debate regarding the specific roles of the basal ganglia and cerebellum in temporal processing, but the basal ganglia are hypothesized to serve as the putative ‘internal clock’ [13, 14]. Animal and psychopharmacological studies support this hypothesis, showing that altered dopamine levels within the basal ganglia systematically distort duration perception and production [15–19]. Moreover, lesions or dopaminergic denervation of the basal ganglia in Parkinson’s disease (PD) impair duration perception and production across a range of tasks and timescales, while anti-Parkinson’s medications (e.g., L-DOPA) may reverse timing impairments in PD patients [18, 20–27]. Taken together, these findings suggest that the basal ganglia may serve as the internal clock and that the clock might be modulated by dopamine.
Although a range of evidence supports a critical role for the basal ganglia and dopamine in duration perception and production, support for impaired temporal processing in PD patients is rather mixed. PD patient subgroup differences may explain, in part, this mixed literature. For example, subgrouping PD patients by primary symptoms, disease duration or temporal processing variability has shown subgroup differences in temporal processing [19, 28, 29]. Recently, Merchant et al. [28] showed that PD patients can be subgrouped by variability on a battery of duration perception and production tasks using cluster analysis. Notably, the authors found no differences between low-variability patients and controls, but high-variability patients performed worse on duration perception and production tasks compared to both controls and low-variability patients. Merchant et al. [28] emphasize the critical need to consider patient subgroups when investigating duration perception and production in patients, but the neural mechanisms underlying patient subgroup differences are unknown.
The current study aimed to determine whether striatal dopaminergic denervation in PD patients, as measured by reduced dopamine binding potential, is associated with the coordination of motor timing to a predictable, external rhythm—sensorimotor synchronization [30]. Specifically, we tested whether dopaminergic denervation is associated with sensorimotor synchronization in the more and less affected hand of PD patients when they were ON and OFF their anti-Parkinson’s medications. Moreover, we examined whether subgrouping PD patients by their degree of striatal dopaminergic denervation revealed performance differences on the sensorimotor synchronization task.
We used positron emission tomography (PET) to measure in vivo striatal denervation in PD patients. 11C-DTBZ is a ligand that binds to the type-2 vesicular monoamine transporter (VMAT2), which is a target for quantitative imaging of striatal synaptic terminals, where the signal is > 95% dopamine [31]. Low binding signals in a 11C-DTBZ PET scan imply more severe denervation of nerve terminals in the striatum, or depletion of the neurotransmitter dopamine.
PD patients synchronized finger taps with an equally timed (isochronous) tone sequence while ON L-DOPA and placebo. Patients tapped with the index finger of the more and less affected hand, separately, to three target time intervals (500 ms, 1000 ms and 1500 ms).
We predicted that greater striatal denervation in PD patients would result in worse accuracy and greater variability in sensorimotor synchronization. Additionally, we predicted that subgrouping PD patients by the degree of dopaminergic denervation would reveal patient subgroup differences in sensorimotor synchronization.
2. Methods and Materials
2.1 Participants
Twenty-eight volunteers with PD participated and received monetary compensation. We obtained complete data from 23 patients and partial data from five patients, due to equipment error or difficulty performing the task (see Table 1). A PD specialist diagnosed patients with mild-to-moderate (Hoehn and Yahr Stages I–III) idiopathic PD and evaluated patients’ motor symptoms using the motor section of the Unified Parkinson’s Disease Rating Scale [UPDRS; 32]. Patients were on a stable dosage of anti-Parkinson’s medication for the previous six months and completed all measures while ON L-DOPA and placebo. We excluded individuals with neurological or psychiatric diseases other than PD from the study and used the Mini-Mental State Exam [MMSE; 33] and Montreal Cognitive Assessment [MOCA; 34] to assess cognitive ability. Patients also performed the Grooved Pegboard test (Lafayette Instruments, Lafayette, IN) to assess bradykinesia. Table 1 provides additional patient characteristics.
Table 1.
Patient Characteristics
| Patient | Age | Sex | Years Diagnosed | Education | UPDRS
|
MOCA
|
MMSE
|
MA Hemisphere | Medication Class | LED (mg) | Cluster Group | |||
|---|---|---|---|---|---|---|---|---|---|---|---|---|---|---|
| OFF | ON | OFF | ON | OFF | ON | |||||||||
| 1 | 69 | M | 11 | 16 | 29 | 18 | 29 | 30 | 26 | 26 | L | Combination | 1038 | 1 |
| 2 | 61 | M | 14 | 18 | 18 | 15 | 29 | 27 | 30 | 29 | L | Combination | 1747.5 | 1 |
| 3 | 67 | M | 10 | 12 | 29 | 23 | 28 | 29 | 29 | 29 | R | Combination | 945.5 | 1 |
| 4 | 62 | F | 6 | 16 | 9 | 7 | 29 | 28 | 30 | 28 | R | Combination | 600 | 1 |
| 5 | 66 | M | 7 | 20 | 24 | 24 | 25 | 24 | 30 | 27 | R | Combination | 840 | 1 |
| 6 | 57 | M | 9 | 16 | 19 | 7 | 30 | 29 | 30 | 30 | Both | Combination | 1100 | 1 |
| 7 | 64 | M | 8 | 16 | 25 | 33 | 30 | 30 | 30 | 30 | R | L-DOPA | 350 | 1 |
| 8 | 81 | M | 1 | 14 | 23 | 18 | 25 | 25 | 28 | 29 | L | L-DOPA | 300 | 1 |
| 9 | 61 | M | 4 | 13 | 23 | 16 | 26 | 26 | 30 | 30 | R | L-DOPA | 900 | 1 |
| 10 | 72 | F | 3 | 18 | 14 | 18 | 27 | 26 | 29 | 30 | R | L-DOPA | 600 | 1 |
| 11 | 70 | M | 7 | 18 | --- | --- | 30 | 27 | 28 | 28 | R | L-DOPA | 698.5 | 1 |
| 12 | 77 | M | --- | 16 | 33 | 33 | 22 | 25 | 29 | 28 | R | L-DOPA | 400 | 1 |
| 13a | 69 | M | 3 | 12 | 28 | 26 | 25 | 25 | 30 | 28 | L | L-DOPA | 700 | 2 |
| 14 | 73 | M | 2 | 14 | 12 | 17 | 21 | 20 | 27 | 27 | L | L-DOPA | 300 | 2 |
| 15 | 61 | M | 5 | 16 | 22 | 16 | 19 | 20 | 28 | 28 | L | Combination | 390 | 2 |
| 16b | 74 | M | 5 | 14 | 17 | 20 | 27 | 26 | 29 | 28 | L | L-DOPA | 600 | 2 |
| 17 | 67 | M | 5 | 16 | 23 | 20 | 26 | 26 | 28 | 30 | R | L-DOPA | 1200 | 2 |
| 18 | 55 | M | 6 | 16 | 25 | 21 | 28 | 26 | 29 | 30 | L | Combination | 925 | 2 |
| 19 | 69 | M | 3 | 18 | 34 | 33 | 27 | 29 | 29 | 27 | L | L-DOPA | 300 | 2 |
| 20 | 65 | F | 3 | 15 | 11 | 13 | 29 | 26 | 30 | 29 | R | Combination | 600 | 2 |
| 21c | 84 | F | 5 | 14 | 29 | 25 | 21 | 27 | 30 | 30 | R | L-DOPA | 300 | 2 |
| 22 | 61 | M | 3 | 18 | 14 | 15 | 26 | 26 | 29 | 29 | L | L-DOPA | 700 | 2 |
| 23d | 68 | M | 1 | 16 | 15 | 14 | 22 | 30 | 29 | 29 | L | L-DOPA | 800 | 2 |
| 24 | 61 | M | 1 | 16 | 12 | 10 | 28 | 25 | 29 | 30 | L | L-DOPA | 250 | 3 |
| 25 | 63 | M | 3 | 20 | 29 | 28 | 24 | 28 | 28 | 29 | L | DA Agonist | 160 | 3 |
| 26e | 79 | M | 4 | 8 | 30 | 27 | 21 | 25 | 27 | 27 | L | L-DOPA | 300 | 3 |
| 27 | 72 | F | 8 | 13 | 18 | 18 | 25 | 22 | 28 | 30 | L | L-DOPA | 600 | 3 |
| 28 | 55 | M | 3 | 12 | 18 | 18 | 27 | 29 | 30 | 30 | R | L-DOPA | 898 | 3 |
|
| ||||||||||||||
| Mean | 67.3 | 5.2 | 15.4 | 21.6 | 19.7 | 25.9 | 26.3 | 28.9 | 28.8 | 662.23 | ||||
| SD | 7.5 | 3.2 | 2.6 | 7.2 | 7.2 | 3.1 | 2.7 | 1.1 | 1.2 | 357.67 | ||||
Abbreviations: --- = No Data; UPDRS-Motor = Unified Parkinson’s Disease Rating Scale-Motor Examination; MMSE = Mini-Mental State Exam; MOCA = Montreal Cognitive Assessment; MA Hemisphere = most affected hemisphere; L-DOPA = Patients treated only with L-DOPA; DA Agonist = Patients treated with only DA agonists; Combination = Patients treated with a combination of L-DOPA and DA agonists; LED = L-DOPA equivalency dose [70]; SD = standard deviation.
Data missing for all 500 ms conditions
Data missing for the 1500 ms OFF medication condition with the more affected hand
Data missing for the 1000 and 1500 ms ON medication conditions with the less affected hand
Data missing for the 1000 ms ON medication with the more affected hand
Data missing for the 1000 ms OFF medication condition with the more affected hand
We collected sensorimotor synchronization data from 45 healthy control participants (65.3 years of age ± 8.2 ; 8 females) for behavioral comparisons with patients. Controls participated in a single testing session that followed the same procedure, except for PET scanning. We present the average control group data graphically rather than statistically as a reference for patient performance since our focus is on patient subgrouping. All participants signed a consent form approved by the Institutional Review Board of the University of Michigan.
2.2 Apparatus
E-Prime software (Psychology Software Tools, Inc., Pittsburgh, PA) controlled stimulus presentation and response collection. Stimuli were acoustic sequences (comprised of 500 Hz sine-wave tones with a 50 ms duration) delivered at a clearly audible volume through a speaker located in front of patients. Patients responded via key presses (‘Z’) on a computer keyboard.
2.3 Procedure
Patients participated in two behavioral testing sessions corresponding to ON and OFF medication states; medication order was counterbalanced (13 patients tested ON L-DOPA first). We used a double-blind placebo controlled design with a single dose of L-DOPA (200 mg) for all patients to reduce the variability of the medication effect (e.g. different dosages and/or combinations of anti-Parkinson’s medications between patients) and patient knowledge of their medication state. Patients arrived to both sessions in an OFF state, achieved by overnight withdrawal from their anti-Parkinson’s medication (12–18 hours). For the ON session, we gave patients a 50 mg dose of carbidopa followed after 30 minutes by a single dose of L-DOPA (50 mg carbidopa/200 mg levodopa). All patients tolerated the L-DOPA dosage well. For the OFF session, we gave patients 50 mg of carbidopa followed by placebo 30 minutes later. Testing began one hour after administration of L-DOPA or placebo, by which time L-DOPA reaches its peak plasma dose [35].
2.3.2 Sensorimotor Synchronization Task
We instructed patients to synchronize a series of 12 index-finger taps to an equally timed (isochronous) tone sequence. The inter-onset interval between tones demarcated the target time interval. Three target time intervals (500, 1000 and 1500 ms) were presented.
Patients completed six test blocks of finger tapping, each block containing six trials. A test block began with a familiarization trial (1250 ms target time interval), followed by five test trials. The target time interval and the hand with which patients tapped were constant within a block and performed in a counterbalanced fashion. A visual marker (“Ready, Go”) signaled the beginning of a trial. Patients listened to the tone sequence until they were ready to begin tapping.
2.3.3 MRI and 11C-DTBZ PET
We acquired MRI and 11C-DTBZ PET data from the 28 patients who performed the sensorimotor synchronization task. MRI was performed on a 3 Tesla Philips Achieva system (Philips, Best, The Netherlands). A standard T1-weighted series of a 3D inversion recovery-prepared turbo field echo was performed in the sagittal plane (TR/TE/TI = 9.8/4.6/1041 ms; FOV = 240×200×160 mm). One hundred and sixty slices were reconstructed to 1mm isotropic resolution.
11C-DTBZ PET imaging was performed in 3D imaging mode using an ECAT HR+ tomograph (Siemens Molecular Imaging, Inc., Knoxville, TN), which acquires 63 transaxial slices (slice thickness = 2.4 mm; intrinsic in-plane resolution = 4.1 mm; FWHM = 15.2 cm). No-carrier-added (+)-11C-DTBZ (250–1000 Ci/mmol) was prepared as reported previously [36]. Dynamic PET scanning was performed for 60 minutes immediately following a bolus injection of 55% of 666 MBq of (+)-11C-DTBZ dose over the first 15–30 seconds of the study, while the remaining 45% of the dose was continuously infused over the next 60 min, resulting in stable arterial tracer levels and equilibrium with brain tracer levels after 30 min [37]. A series of 15 frame sequences of scans over 60 min were obtained as follows: four×30 s; three×1 min; two×2.5 min; two×5 min; and four×10 min. All patients were scanned supine, with eyes and ears unoccluded, resting quietly in a dimly lit room.
2.4 Data Analysis
2.4.1 Behavior
We filtered inter-tap intervals (ITIs) according to the following criteria: 1) ITIs 50% greater or less than the target time interval were removed from analyses, as these ITIs were indicative of missed or accidental ‘taps’ and 2) the first four synchronization ITIs were removed from each trial to allow for the stabilization of synchronization. An equivalent number of ITIs were removed between the variables of affected hand, medication state and target time interval conditions using this criteria; moreover, the number of ITIs removed did not differ between patients and controls (ps > .1). We averaged the ITIs of the five trials (40 total ‘taps’) for each level of affected hand, medication state and target time interval.
Our analysis focused on the accuracy and variability of sensorimotor synchronization. We used normalized (relative) accuracy and variability measures to compare synchronization at the three target time intervals, as duration production tends to be time-scale invariant [38]. Preliminary inspection of the data revealed that patients produced ITIs shorter than the target time interval (underproduction), or the characteristic anticipatory tapping observed for this task, on the majority of trials. However, patients produced an ITI longer than the target time interval (overproduction) on a few trials; overproductions of the target time interval were not systematic for an individual patient or our variables of interest, but biased condition means toward better accuracy. We used an absolute accuracy measure to address this issue without reducing statistical power through data removal. Relative accuracy was calculated in the following manner: |(Target Time Interval - ITI)/Target Time Interval|. Coefficient of variation (CV) measured ITI variability: Standard Deviation/ITI. For both metrics, low values reflect better synchronization and high values reflect worse synchronization.
We performed separate 2 (affected hand: more, less) × 2 (medication state: ON, OFF) × 3 (target time interval: 500 ms, 1000 ms, 1500 ms) ANOVAs for repeated-measures on our synchronization metrics. The Huynh-Feldt epsilon [39] was used to determine whether data met the assumption of sphericity (Σ > 0.75). The F statistic was evaluated for significance using the Huynh-Feldt adjusted degrees of freedom when the sphericity assumption was violated.
2.4.2 VOI Implementation and Data Extraction
All dynamic PET imaging frames were spatially co-registered within subjects with a rigid body transformation to reduce the effects of patient motion during the imaging session [40]. These motion corrected PET frames were spatially co-registered to the MRI using SPM8 software (Wellcome Trust Centre for Neuroimaging, London, UK). IDL image analysis software (Research systems, Inc., Boulder, CO) was used to manually trace volumes of interest (VOI) on the MRI scan. Traced VOIs included the striatum (anteroventral striatum, middle caudate, caudate head, ventral, dorsal anterior and dorsal posterior putamen) and neocortex (Figure 1A). Neocortical VOI definition used semi-automated thresholding delineation of the neocortical gray matter signal on the MRI images.
Figure 1.
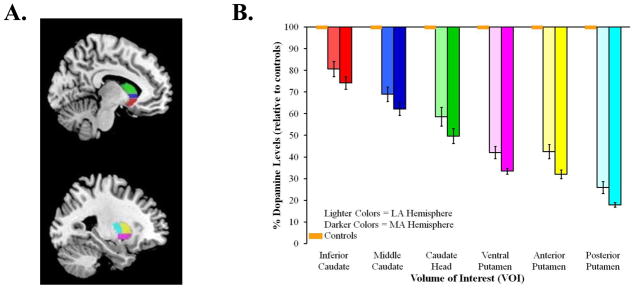
(A.) Striatal VOIs overlaid on an MNI template: anteroventral striatum (red), middle caudate (blue), caudate head (green), ventral putamen (pink), dorsal anterior putamen (yellow) and dorsal posterior putamen (light blue). (B.) Mean percent decrease of dopaminergic binding potential, relative to controls, for the most (MA) and least (LA) affected hemispheres of the six VOIs. Orange boxes represent age-matched controls; error bars for controls are indistinguishable from the x-axis. Standard error bars represent standard error of the mean (SEM).
Time activity curves for each VOI were generated from the spatially aligned PET frames. [11C]-DTBZ PET distribution volume ratio (DVR), a measure of binding, was estimated by using the Logan plot graphical analysis method [41] with the time activity curves as the input function and the neocortex as reference tissue for [11C]-DTBZ. Binding potential was calculated from DVR by subtracting 1.
The more and less affected hemispheres were defined as being contralateral to the clinically more and less affected body side, as determined by patient report and confirmed by a PD specialist. We measured the percent decrease of 11C-DTBZ binding potential from the average binding potential of a sample of 32 healthy control subjects, who were scanned for a different study, in the same age range (65.9 ± 10.4 yrs, 14 females) for each VOI in each patient using the following equation: (binding potentialcontrol − binding potentialPD)/binding potentialcontrol × 100.
We used two statistical approaches to examine whether dopaminergic denervation predicted synchronization performance in patients. First, we used multiple regression to determine whether striatal denervation predicted synchronization accuracy and variability for the affected hand, medication state or target time interval. Second, we used cluster analysis to subgroup patients based upon striatal denervation and, then, compared the patient subgroups on synchronization accuracy and variability [8, 28]. Statistical analyses were performed using SPSS version 20 (IBM, Chicago).
3. Results
3.1 Medication Effects on Motor Performance
We compared disease severity and bradykinesia while patients were ON and OFF medication to determine the effectiveness of our controlled L-DOPA dose. Patients’ PD severity improved when they were ON (M = 19.74, SEM = 1.38) compared to OFF (M = 21.59, SEM = 1.38) medication, (t(26) = −2.17, p = .04), as assessed by the motor section of the UPDRS. Patients were also faster at completing the Grooved Pegboard test when ON (M = 139.67 seconds, SEM = 12.31) compared to OFF (M = 150.50 seconds, SEM = 14.40) medication F(1, 25) = 4.58, p = .04. Thus, on average, our controlled L-DOPA dose significantly improved motor PD symptoms relative to placebo.
3.2 Sensorimotor Synchronization Accuracy and Variability
Separate ANOVAs determined whether patients tapping with their most and least affected hand, their medication state or the target time interval affected synchronization accuracy and variability (Figure 2). Only a main effect of target time interval was found for synchronization accuracy, F(1.06, 23.28) = 4.46, MSE = .005, ηp2 = .17, p = .04. Patients were more accurate when synchronizing with the 1000 ms (M = .01, SEM = .002) and 1500 ms (M= .01, SEM = .002) target time intervals compared to 500 ms (M = .03, SEM = .01). Post-hoc Fisher’s LSD comparisons indicated that this difference was driven by patients being more accurate when synchronizing with the 1500 ms target time interval compared to the 500 ms target time interval (p = .04); patients’ synchronization accuracy with the 1000 ms target time interval was only marginally better than for the 500 ms target time interval (p = .06). No other main effects or interactions were found for synchronization accuracy or variability (ps > .16).
Figure 2.
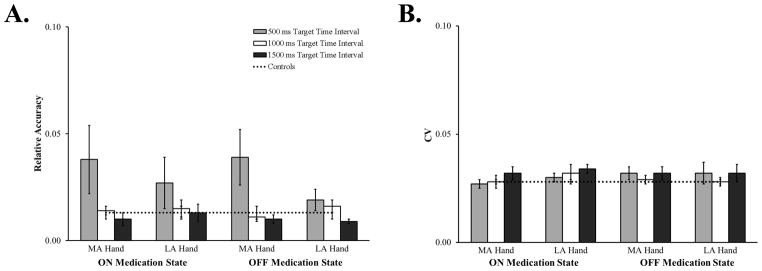
Relative sensorimotor synchronization accuracy (A.) and CV (B.) for the more (MA) and less (LA) affected hand, while patients were ON and OFF medication, at the three target time intervals. Data from control participants are included for comparison. Error bars represent SEM.
To ensure that our accuracy results were not driven by our correction (absolute accuracy) for the few overproductions we observed in patients, we performed the same analysis on the non-absolute values of synchronization accuracy. The general pattern of results held, except that a few overproductions of the target time interval biased the means toward better accuracy.
Finally, we considered whether either practice (Day 1 vs. Day 2) or medication testing order (ON-OFF order vs. OFF-ON order) affected synchronization accuracy or variability. We found no evidence of practice on either synchronization accuracy or variability (ps > .09).
In sum, the hand with which patients synchronized, their medication state nor practice affected synchronization accuracy or variability. However, patients were less accurate when synchronizing with the 500 ms target time interval.
3.3 Volume 11C-DTBZ binding in the striatum
We performed a 2 (affected hemisphere: more, less) × 6 (VOIs: anteroventral striatum, middle caudate, caudate head, ventral, dorsal anterior and dorsal posterior putamen) ANOVA for repeated measures to confirm the characteristic spatial distribution (asymmetric, dorsal-to-ventral, posterior-to-anterior) of striatal denervation in our sample of PD patients [42, 43]. Figure 1B shows the percent dopamine levels, relative to controls, for the six VOIs. Consistent with the characteristic spatial distribution of striatal denervation in PD, we found main effects of affected hemisphere, F(1, 27) = 27.55, p < .001 and VOI, F(2.86, 77.20) = 219.71, p < .001, but no interaction between the two factors. As expected, average percentage of binding potential decrease was greater in the more affected hemisphere (M = 55.08, SEM = 2.1) than the less affected hemisphere (M = 46.87, SEM = 3.0). Pairwise comparisons between the six VOIs, averaged across the more and less affected hemispheres, revealed significant differences between all VOIs (ps < .001), except the ventral putamen and dorsal anterior putamen (p = .65). These results confirm that our patient sample showed the typical dorsal-to-ventral and posterior-to-anterior gradient of striatal denervation of PD [42, 43].
3.4 Association Between Striatal Dopaminergic Denervation and Synchronization
3.4.1 Multiple regression
To reduce the number of factors in our multiple regression models, we performed a principal component analysis (PCA) using varimax rotation to explore the percentage of binding potential decrease for the 12 VOIs. The PCA suggested a 2-factor solution that explained 86.0 % of the total variance (factor 1 = 46.5%; factor 2 = 39.5%). Factor 1 better explained all of the putamen VOIs and the caudate head of the more affected hemisphere, while factor 2 better explained the remaining caudate VOIs (Table 2).
Table 2.
Principal component analysis factor loadings for the six striatal VOIs
| Factor
|
||
|---|---|---|
| 1 | 2 | |
|
| ||
| MA Posterior Putamen | .91 | .10 |
| LA Posterior Putamen | .80 | .45 |
| MA Anterior Putamen | .91 | .22 |
| LA Anterior Putamen | .82 | .49 |
| MA Ventral Putamen | .76 | .57 |
| LA Ventral Putamen | .70 | .60 |
| MA Caudate Head | .73 | .59 |
| LA Caudate Head | .57 | .74 |
| MA Middle Caudate | .63 | .65 |
| LA Middle Caudate | .41 | .86 |
| MA Inferior Caudate | .37 | .79 |
| LA Inferior Caudate | .06 | .95 |
Note: Factor loadings for dopaminergic denervation of the six striatal VOIs revealed a division of the putamen/MA caudate head (factor 1) and caudate (factor 2), closely matching our a priori putamen and caudate division. LA = less affected hemisphere; MA = more affected hemisphere.
We submitted the PCA data-driven factor loadings to hierarchical multiple regression models to test whether striatal dopaminergic denervation predicted synchronization accuracy or variability for the affected hand, medication state and target time interval. A natural log transform was applied to our measures to adjust skew. Table 3 summarizes the multiple regression models. In general, neither the overall regression models nor the two denervation factors strongly predicted synchronization accuracy or variability. However, there was some evidence of a negative relationship between the caudate denervation factor (factor 2) and both synchronization accuracy and variability, primarily for the 500 and 1000 ms target time intervals. While these results should be interpreted with caution due to the number of model tests and uncorrected p-values, they are generally suggestive of a rather counterintuitive finding. Specifically, we see a trend for a negative relationship between the caudate denervation factor and synchronization, which suggests that patients are more accurate and less variable during synchronization when they have greater denervation in the caudate.
Table 3.
Multiple regression analysis predicting accuracy and CV from denervation factor scores
| Overall Model
|
Putamen/MA Caudate Head
|
Caudate
|
|||||
|---|---|---|---|---|---|---|---|
| R2 | F | p | β | p | β | p | |
| Accuracy | |||||||
| 500 ms | |||||||
| ON state | |||||||
| More affected hand | .13 | 2.97 | .07 | .30 | .12 | −.34 | .08 |
| Less affected hand | −.07 | .11 | .89 | .07 | .75 | .07 | .74 |
| OFF state | |||||||
| More affected hand | .11 | 1.51 | .24 | −.09 | .63 | −.32 | .11 |
| Less affected hand | .14 | 3.11 | .06 | .19 | .32 | −.42 | .03 |
| 1000 ms | |||||||
| ON state | |||||||
| More affected hand | .08 | 2.06 | .15 | .16 | .42 | −.37 | .07 |
| Less affected hand | −.02 | .79 | .47 | −.01 | .97 | −.25 | .22 |
| OFF state | |||||||
| More affected hand | .05 | 1.75 | .20 | −.21 | .29 | −.29 | .14 |
| Less affected hand | −.02 | .70 | .51 | .23 | .25 | −.00 | .99 |
| 1500 ms | |||||||
| ON state | |||||||
| More affected hand | −.01 | .84 | .45 | −.22 | .26 | −.12 | .56 |
| Less affected hand | .06 | 1.80 | .19 | .02 | .92 | −.36 | .07 |
| OFF state | |||||||
| More affected hand | −.07 | .13 | .88 | −.08 | .69 | −.06 | .77 |
| Less affected hand | −.06 | .25 | .78 | .08 | .71 | .12 | .56 |
|
| |||||||
| CV | |||||||
| 500 ms | |||||||
| ON state | |||||||
| More affected hand | .19 | 3.99 | .03 | .14 | .42 | −.48 | .01 |
| Less affected hand | .18 | 3.88 | .04 | .33 | .08 | −.38 | .04 |
| OFF state | |||||||
| More affected hand | .09 | 2.24 | .13 | .13 | .50 | −.38 | .06 |
| Less affected hand | .05 | 1.75 | .20 | −.04 | .85 | −.35 | .08 |
| 1000 ms | |||||||
| ON state | |||||||
| More affected hand | .18 | 3.87 | .04 | .20 | .29 | −.48 | .01 |
| Less affected hand | .06 | 1.87 | .18 | −.12 | .54 | −.35 | .08 |
| OFF state | |||||||
| More affected hand | .02 | 1.30 | .29 | −.13 | .52 | −.29 | .15 |
| Less affected hand | −.05 | .35 | .71 | −.16 | .43 | −.04 | .83 |
| 1500 ms | |||||||
| ON state | |||||||
| More affected hand | .08 | 2.20 | .13 | −.33 | .09 | −.20 | .28 |
| Less affected hand | .00 | .98 | .39 | −.27 | .18 | −.04 | .86 |
| OFF state | |||||||
| More affected hand | .03 | 1.34 | .28 | −.29 | .14 | −.12 | .55 |
| Less affected hand | −.08 | .00 | .99 | −.01 | .95 | .01 | .96 |
R2 reflects adjusted value
3.4.2 Cluster analysis
Previous studies have shown that temporal processing is differentially affected in PD patient subgroups [19, 28, 29]. We performed a cluster analysis on the 12 striatal VOIs to examine whether patient subgroup differences in denervation might explain our counterintuitive multiple regression results. We performed a hierarchical cluster analysis, using the between-groups linkage method and the Euclidian distance interval for this analysis [44]. Hierarchical cluster analysis afforded patient subgrouping based on the similarity of dopaminergic denervation as opposed to subgrouping patients into a pre-determined number of subgroups, which is in accord with the exploratory nature of this hypothesis. Visual inspection of the dendrogram revealed three cluster groups (Figure 3). Cluster groups 1, 2 and 3 consisted of 12, 11 and 5 patients, respectively.
Figure 3.

Dendrogram yielded by hierarchical cluster analysis of striatal dopaminergic denervation in the most and least affected hemispheres of the six VOIs. Three cluster groups were identified: cluster group 1 (light grey), cluster groups 2 (white) and cluster group 3 (dark grey).
3.4.2.1 Factors that differentiate patient subgroups
We performed subgroup analyses on patients’ demographic and neurological evaluation variables to determine what factors underlie cluster group differences. Most notably, PD subgroups differed on their degree of striatal denervation. A 2 (Factor Score: factor 1—putamen/MA caudate head, factor 2—caudate) × 3 (Cluster Group: 1, 2, 3) ANOVA revealed a main effect of cluster group, F(2, 25) = 96.57, MSE = .12, ηp2 = .86, p < .001, but no effect of factor score nor an interaction between these variables (ps > .76; Figure 4). Bonferroni-corrected pairwise comparisons indicated that patients in cluster group 1 had significantly greater denervation compared to patients in cluster groups 2 and 3 (ps< .001) and that cluster group 2 had significantly greater denervation than cluster group 3 (p < .001). We performed Bonferroni-corrected pairwise comparisons of the most and least affected hemispheres of the six VOIs as a follow up analysis to determine which VOIs differentiated the PD subgroups. Groups 1 and 3 differed in the most and least affected hemisphere of all VOIs. Groups 1, 2 and 3 differed from each other primarily in denervation of the caudate head, ventral putamen and anterior putamen (ps < .001; see supplementary fig. s1).
Figure 4.

PCA-derived factor scores as a function of factor. Positive values reflect greater denervation, while negative values reflect less denervation. Error bars represent SEM.
PD duration was the only other variable that significantly differed between cluster groups, F(2, 26) = 5.08, MSE = 7.97, p = .01. On average, participants in cluster group 1 had been diagnosed with PD for more years (M = 7.27 years, SEM = 1.13) relative to cluster groups 2 (M= 3.73, SEM = 0.47) and 3 (M= 3.80, SEM= 1.16).
3.4.2.1 Sensorimotor synchronization in the patient subgroups
We reassessed sensorimotor synchronization to examine whether the PD subgroups identified by our cluster analysis of dopaminergic denervation showed differences in behavioral performance. Subgrouping patients by denervation revealed a rather different pattern of results compared to our group-level analysis (Figure 5). PD patients with an asymmetric pattern of striatal dopaminergic denervation (cluster group 3) showed worse accuracy only when tapping with their most affected hand, whereas patients with more symmetric denervation (cluster group 2) showed worse accuracy when tapping with both the more and less affected hands. However, the patient subgroup with the most denervation (cluster group 1) was the most accurate when synchronizing to the 500 ms target time interval compared to the other subgroups. No clear subgroup differences were found for synchronization variability.
Figure 5.

Mean percent decrease of dopaminergic binding potential, relative to controls, for the most and least affected hemispheres of the six VOIs (left column), relative accuracy (middle column) and CV (right column) for cluster groups 1, 2 and 3. Orange boxes represent age-matched controls; error bars for controls are indistinguishable from the x-axis. Behavioral data from control participants are included for comparison. Error bars represent SEM.
We performed separate 2 (affected hand) × 2 (medication state) × 3 (target time interval) × 3 (cluster group) ANOVAs on sensorimotor synchronization accuracy and CV to determine whether these differences were statistically reliable. Critically, the results of our sensorimotor synchronization accuracy analysis showed a four-way affected hand, medication state, target time interval and cluster group interaction, F(3.54, 35.39) = 2.96, MSE < .001, ηp2 = .23, p = .04, and a significant three-way affected hand, medication state and cluster group interaction, F(2, 20) = 5.97, MSE < .001, ηp2 = .37, p = .01. These interactions suggest that synchronization accuracy changed differentially by affected hand and medication state across the three cluster groups. Furthermore, the hypothesized cluster group and affected hand interaction was significant, which suggests that synchronization accuracy changed differentially between the most and least affected hands for the cluster groups, F(2, 20) = 3.42, MSE = .001, ηp2 = .26, p < .05. These results support statistically reliable cluster group differences in synchronization accuracy.
Our analysis of synchronization variability between the three cluster groups showed little support for differences between the patient subgroups. A significant three-way affected hand, target time interval and cluster group interaction was found, F(4, 40) = 2.92, MSE < .001, ηp2= .23, p = .03, but this interaction was driven primarily by differential performance by cluster group 3 across the conditions.
While our cluster group results should be interpreted with caution due to the low number of patients within each subgroup, the results generally support clear differential changes in synchronization accuracy across the three cluster groups, but no differences in variability between cluster groups. Interestingly, the accuracy findings reflect the dorsal-to-ventral and posterior-to-anterior pattern of striatal dopaminergic denervation associated with PD. Worse synchronization accuracy for the 500 ms target time interval was only found for the most affected hand in cluster group 3 patients, which is consistent with the asymmetric pattern of striatal denervation found for this subgroup. Alternatively, patients in cluster group 2 had worse synchronization at the 500 ms target time interval for both their least and most affected hands, which mirrors the more symmetrical pattern of denervation for this subgroup. Finally, a rather unexpected finding is that patients in cluster group 1, who had the highest overall percentage of relative binding potential decrease, showed better sensorimotor synchronization accuracy relative to the other cluster groups. In contrast, we did not find strong cluster group differences for variability.
4. Discussion
The aim of this study was to determine whether striatal dopaminergic denervation in PD patients was associated with sensorimotor synchronization performance. We measured dopaminergic denervation within the putamen and caudate nucleus using 11C-DTBZ PET imaging in patients. In separate sessions, patients synchronized finger taps to three different target time intervals with their most and least affected hands while ON L-DOPA or placebo. Based on the hypothesized roles of the basal ganglia and dopamine in duration perception and production, we predicted that greater dopaminergic denervation would relate to worse sensorimotor synchronization in PD patients. Additionally, we predicted that subgrouping patients based on striatal dopaminergic denervation would reveal subgroup differences in sensorimotor synchronization.
Four findings emerged from this study. First, we replicated previous PET imaging work showing dorsal-to-ventral and posterior-to-anterior gradients of striatal denervation in PD [42, 43]. Second, the group-level analysis of sensorimotor synchronization revealed worse accuracy for the 500 ms target time interval compared to the 1000 ms and 1500 ms target time intervals; neither synchronization accuracy nor variability were affected by the hand with which patients tapped or their medication state. Third, dopaminergic denervation did not show a strong relationship with either synchronization accuracy or variability; yet, we found some counterintuitive evidence for better synchronization accuracy and less variability with greater denervation. Fourth, cluster analysis of the 12 VOIs yielded three patient subgroups. An exploratory analysis examining subgroup differences in synchronization accuracy revealed differences in accuracy for the 500 ms target time interval that paralleled the pattern of dopaminergic denervation in our PD subgroups. That is, PD patients with an asymmetric pattern of striatal dopaminergic denervation (cluster group 3) showed worse accuracy only when tapping with their most affected hand, whereas patients with symmetric denervation (cluster group 2) showed worse accuracy when tapping with both the more and less affected hands. However, the patient subgroup with the most denervation (cluster group 1) was the most accurate during synchronization compared to the other subgroups.
Our findings demonstrate two important points regarding sensorimotor synchronization in PD patients. First, our findings support the role of the basal ganglia and dopamine in motor timing. Specifically, we show that striatal dopaminergic denervation is associated with sensorimotor synchronization performance. Second, our findings extend previous work that suggests the need to consider PD patient subgroups when investigating duration perception and production [28]. Interestingly, our group-level analysis revealed only an effect of short interval (500 ms) sensorimotor synchronization accuracy in PD patients, but we found no differences of affected hand or medication state. However, subgrouping PD patients by striatal dopaminergic denervation revealed clear behavioral differences between patient subgroups for sensorimotor synchronization. While the low number of patients within each subgroup and multiple statistical comparisons limits the interpretation of our statistical results, our results provide a potential explanation for the mixed literature on impaired temporal processing in PD patients.
4.1 Effects of Target Time Interval
In the current study, we found worse synchronization accuracy for the 500 ms target time interval compared to the 1000 ms and 1500 ms target time intervals. It is noteworthy that we did not find support for worse sensorimotor synchronization performance at the 1000 and 1500 ms target time intervals. This finding conflicts with recent work showing that temporal processing impairments are more pronounced for suprasecond durations in PD patients [23, 45]. However, these studies only consider the perception and production of single (isolated) time intervals, as opposed to a sequence of time intervals. One reconciliation of these conflicting findings is that the striatum may play a less important role in suprasecond sequence timing than it does for subsecond sequence timing, which is consistent with recent work highlighting the role of the striatum in subsecond perceptual sequence timing [20, 46, 47]. Moreover, this explanation is partially consistent with recent proposals that motor areas of the brain are more involved in timing sequential, subsecond durations, while more cognitive regions (e.g., prefrontal and parietal lobes) are strongly involved in timing single, subsecond durations [7, 10, but see 48].
4.2 Effects of Medication
We did not find strong support for anti-Parkinson’s medications improving sensorimotor synchronization. The literature addressing this issue is also rather mixed, with some studies showing that medications improve temporal processing impairments in PD patients [18, 26, 49] while others do not [50, 51]. Our use of a controlled dose of L-DOPA may partially explain our lack of a medication effect. We used a double-blind placebo controlled design to reduce the variability of medication effects and patient knowledge of medication state in this study. While the significant improvements in PD motor symptoms demonstrate that this L-DOPA dosage was clinically effective for most patients, our controlled dose may have weakened the effect of anti-Parkinson’s medications on sensorimotor synchronization. Furthermore, we did not use the synchronization-continuation task, which has patients continue tapping in the absence of pacing tones. Studies using this task to investigate medication effects often focus on the continuation phase of tapping, which may also explain our lack of a medication effect [49, 51].
4.3 Association Between Dopaminergic Denervation and Sensorimotor Synchronization
One rather surprising result was that we found some support for better synchronization accuracy with greater striatal dopaminergic denervation. Our cluster analysis revealed that this counterintuitive finding was driven by the most denervated PD patient subgroup (cluster group 1) having better synchronization accuracy compared to the other PD patient subgroups. Visual comparisons between cluster group 1 and healthy controls reveal that both synchronization accuracy and variability were equivalent between the groups, in contrast to the clear differences observed between cluster groups 2 and 3 compared to controls. The current finding of better synchronization accuracy with greater denervation conflicts with a few studies of duration perception and production in PD that report the opposite relationship of worse temporal processing with greater disease severity or years since PD diagnosis for both subsecond vs. suprasecond durations and perceptual vs. production temporal processing tasks [21, 24, 49, 52]. One potential resolution of these conflicting results is that the few studies that report a positive relationship between disease severity and temporal processing may have sampled a subgroup of patients with a similar degree of dopaminergic denervation, thus finding a positive relationship within this subgroup. Additionally, we should note, that time since diagnosis and the degree of dopaminergic denervation do not share a direct relationship; while the patients who had greater denervation also had, on average, been diagnosed with PD for longer, there was heterogeneity between the cluster groups which suggests that the rate of denervation is variable between patients. We cannot directly assess these issue in the current study, but future research is necessary to determine the relationship between direct measures of neurodegenerative changes associated with PD and temporal processing. Such approaches may help to further explain the heterogeneity of temporal processing performance in patients.
4.4 Subgrouping Patients by Dopaminergic Denervation
It is unclear why we found better synchronization accuracy for the PD subgroup with the most striatal denervation. One potential explanation for this finding is that patients with greater denervation honed a compensatory strategy over their disease progression to improve subsecond timing performance. This explanation is consistent with cluster group 1 having greater denervation and, on average, longer disease duration relative to the other cluster groups. Moreover, this explanation parallels reports of greater medial temporal lobe activation in Alzheimer’s disease and mild cognitive impairment (MCI) patients that correlate with longitudinal decline [53–55]. One interpretation for the increased medial temporal lobe activation with longitudinal decline is that individuals with MCI might recruit compensatory memory strategies to counteract progressive memory decline [53].
We can only speculate about what type of compensatory strategy patients might have used to improve synchronization. Recent research demonstrates individual differences in the way that young adults perceive a short tone sequence [56]. Individuals can use a strategy in which they hear the tone sequence as a discrete series of time intervals or a strategy in which they hear the tone sequence as a unified rhythm; an individuals’ chosen strategy may be subconscious. One potential explanation for the worse synchronization observed in cluster groups 1 and 2 is that patients within these subgroups might recruit a suboptimal timing strategy in light of declining temporal processing ability associated with PD. However, patients in cluster group 1 may have adapted or modified their timing strategy over the course of their disease progression, which resulted in the improved synchronization accuracy that we observed.
Taken together, both the current study and previous work highlight that individuals may recruit a compensatory strategy to maintain performance in the face of progressive behavioral decline due to neurodegenerative disease. While future studies are necessary to directly test this hypothesis, identifying and considering compensatory strategies to counter neurodegeneration may explain the rather mixed literature of behavioral performance in patient populations.
An alternative explanation for better synchronization accuracy in cluster group 1 is that severe striatal dopaminergic denervation triggers the recruitment of a compensatory timing mechanism for short-interval timing. In accord, recent work shows greater cerebellar activation in PD patients, relative to controls, while performing a similar multiple-interval, duration production task [57]. This interpretation is consistent with the reported structural and functional connectivity between the basal ganglia and cerebellum [58–60] and cerebellar hyperactivation in PD patients relative to age-matched controls [61, 62]. While this study cannot directly address this issue, the cerebellum is a plausible candidate as a compensatory timing mechanism, as it is often activated during duration perception and production tasks [7, 10], particularly for subsecond durations [63–65].
Finally, we considered how our subgrouping approach compared to other methods used in the sensorimotor synchronization literature. Previous studies have subgrouped patients based on PD stage, dominant PD symptoms and variability on a battery of temporal processing tasks [29, 49]. We subgrouped patients as having either mild (Hoehn and Yahr < 2; n = 23) or moderate (Hoehn and Yahr = 3; n = 5) PD, but found no differences in timing performance between disease stage subgroups (ps > .11). Subgrouping patients based upon whether they had tremor or postural instability and gait difficulty dominant symptoms [see 66] also revealed no differences in sensorimotor synchronization (ps> .16). We were unable to directly compare our subgrouping approach to the one used by Merchant et al. [28], since we only used a single measure of temporal processing, but separate cluster analyses on synchronization accuracy and variability revealed no clear patient subgroups. Our comparison of different patient subgrouping approaches suggests that our brain-behavior subgrouping findings are not explained by a known behavioral subgrouping factor, but rather suggest that using neural measures to subgroup patients may be a useful approach in the future. We do not mean to suggest that our subgrouping approach is superior to behavioral subgrouping approaches, but rather think that approach may be more sensitive to distinguishing subtle brain-behavior difference between patient subgroups than behavioral measures alone.
The primary contribution of this work is that it highlights how the degree of striatal dopaminergic denervation in PD patients is associated with sensorimotor synchronization performance. Specifically, our findings demonstrate subgroup differences in sensorimotor synchronization accuracy that mirror subgroup patterns of dopaminergic denervation. In other words, our results show a brain-behavior relationship that may explain the mixed literature on duration perception and production in PD. While previous studies have considered PD patient subgroup differences in temporal processing, these subgrouping metrics were derived from PD symptoms, PD severity or behavioral performance [19, 28, 29]. One issue that arises when subgrouping patients by behavioral measures is that this approach is unable to identify the neural mechanism underlying subgroup differences. Our findings suggest the need for future research to consider neural measures of neurodegenerative changes in PD to understand better the changes in duration perception and production across disease progression, as these measures may be more sensitive than behavioral measures alone.
While our findings speak directly to temporal processing in PD patients, they also have broader implications for clarifying mixed literatures on impaired behavior in PD patients. Heterogeneity is often reported in research examining both behavioral and clinical aspects of PD, such as presenting symptoms, age of onset, disease progression and cognitive impairment [67, 68]. At the same time, behavioral studies examining PD patients show high inter-individual variability and report rather mixed results [68, 69]. Based on our current findings, one fruitful approach for future behavioral research in PD is to consider how subgroup differences of dopaminergic denervation in PD affect behavioral performance, which may potentially clarify some of the mixed literature in this area.
5. Conclusions
The current study contributes to the literature on temporal processing in PD patients in two ways. First, we provide further evidence for the role of the basal ganglia and dopamine in duration production. However, the role of the basal ganglia for duration production in PD patients appears less straightforward than originally hypothesized. This may be due to the recruitment of compensatory timing strategies or mechanisms, particularly with greater striatal dopaminergic denervation. Second, this study highlights a critical need to account for PD subgroups when investigating temporal processing and potentially other behaviors in PD patients.
Supplementary Material
Research Highlights.
We assessed paced finger tapping in Parkinson’s disease (PD) patients.
We measured striatal dopaminergic denervation using 11C-dihydrotetrabenazine PET.
Cluster analysis subgrouped PD patients based on dopaminergic denervation.
PD patient subgroups qualitatively differed in paced finger tapping accuracy.
Subgrouping patients may explain the mixed literature of temporal processing in PD.
Acknowledgments
This work was supported by the Gustavus and Louise Pfeiffer Research Foundation (to R.D.S), Award number H133P090008 from the National Institute on Disability and Rehabilitation Research at the U.S. Department of Education and Award number 2UL1TR000433 from the National Center for Advancing Translational Sciences of the National Institutes of Health supported N.S.M. The authors are grateful to Jin Bo for her programming assistance and Melanie Sottile for her help with patient recruitment and data collection. Additionally, we thank the members of the Neuromotor Behavior Laboratory at the University of Michigan for their valuable comments on this work.
Role of the Funding Sources
The funding sources played no role in the study design, data collection, analysis or interpretation of data, writing the report or the decision to submit the paper for publication.
Footnotes
Disclosures
The authors have no conflicts of interest to disclose.
Publisher's Disclaimer: This is a PDF file of an unedited manuscript that has been accepted for publication. As a service to our customers we are providing this early version of the manuscript. The manuscript will undergo copyediting, typesetting, and review of the resulting proof before it is published in its final citable form. Please note that during the production process errors may be discovered which could affect the content, and all legal disclaimers that apply to the journal pertain.
Contributor Information
Nathaniel S. Miller, Email: natmille@umich.edu.
Youngbin Kwak, Email: youngbin.kwak@duke.edu.
Nicolaas I. Bohnen, Email: nbohnen@umich.edu.
Martijn L. T. M. Müller, Email: mtmuller@umich.edu.
Praveen Dayalu, Email: pravd@med.umich.edu.
Rachael D. Seidler, Email: rseidler@umich.edu.
References
- 1.Lewis PA, Miall RC. Brain activity during non-automatic motor production of discrete multi-second intervals. Neuroreport. 2002;13:1731–5. doi: 10.1097/00001756-200210070-00008. [DOI] [PubMed] [Google Scholar]
- 2.Penney TB, Vaitilingam L. Imaging Time. In: Grondin S, editor. Psychology of Time. Bingley, U.K: Emerald Group; 2008. pp. 261–94. [Google Scholar]
- 3.Coull JT, Cheng RK, Meck WH. Neuroanatomical and neurochemical substrates of timing. Neuropsychopharmacology. 2011;36:3–25. doi: 10.1038/npp.2010.113. [DOI] [PMC free article] [PubMed] [Google Scholar]
- 4.Ruspantini I, Maki H, Korhonen R, D’Ausilio A, Ilmoniemi RJ. The functional role of the ventral premotor cortex in a visually paced finger tapping task: a TMS study. Behav Brain Res. 2011;220:325–30. doi: 10.1016/j.bbr.2011.02.017. [DOI] [PubMed] [Google Scholar]
- 5.Bangert AS, Reuter-Lorenz PA, Seidler RD. Dissecting the clock: Understanding the mechanisms of timing across tasks and temporal intervals. Acta Psychol (Amst) 2011;136:20–34. doi: 10.1016/j.actpsy.2010.09.006. [DOI] [PMC free article] [PubMed] [Google Scholar]
- 6.Grondin S. Timing and time perception: A review of recent behavioral and neuroscience findings and theoretical directions. Attention, Perception and Psychophysics. 2010;72:561–82. doi: 10.3758/APP.72.3.561. [DOI] [PubMed] [Google Scholar]
- 7.Lewis PA, Miall RC. Distinct systems for automatic and cognitively controlled time measurement: Evidence from neuroimaging. Curr Opin Neurobiol. 2003;13:250–5. doi: 10.1016/s0959-4388(03)00036-9. [DOI] [PubMed] [Google Scholar]
- 8.Merchant H, Zarco W, Bartolo R, Prado L. The context of temporal processing is represented in the multidimensional relationships between timing tasks. PLoS ONE. 2008;3:1–9. doi: 10.1371/journal.pone.0003169. [DOI] [PMC free article] [PubMed] [Google Scholar]
- 9.Merchant H, Zarco W, Prado L. Do we have a common mechanism for measuring time in the hundreds of millisecond range? Evidence from multiple-interval timing tasks. J Neurophysiol. 2008;99:939–49. doi: 10.1152/jn.01225.2007. [DOI] [PubMed] [Google Scholar]
- 10.Stevens MC, Kiehl KA, Pearlson G, Calhoun VD. Functional neural circuits for mental timekeeping. Hum Brain Mapp. 2007;28:394–408. doi: 10.1002/hbm.20285. [DOI] [PMC free article] [PubMed] [Google Scholar]
- 11.Jahanshahi M, Jones CRG, Dirnberger G, Frith CD. The substantia nigra pars compacta and temporal processing. J Neurosci. 2006;26:12266–73. doi: 10.1523/JNEUROSCI.2540-06.2006. [DOI] [PMC free article] [PubMed] [Google Scholar]
- 12.Wiener M, Turkeltaub P, Coslett HB. The image of time: A voxel-wise meta-analysis. Neuroimage. 2010;49:1728–40. doi: 10.1016/j.neuroimage.2009.09.064. [DOI] [PubMed] [Google Scholar]
- 13.Matell MS, Meck WH. Cortico-striatal circuits and interval timing: Coincidence detection of oscillatory processes. Cognitive Brain Research. 2004;21:139–70. doi: 10.1016/j.cogbrainres.2004.06.012. [DOI] [PubMed] [Google Scholar]
- 14.Pastor MA, Artieda J, Jahanshahi M, Obeso JA. Time estimation and reproduction is abnormal in Parkinson’s disease. Brain. 1992;115:211–25. doi: 10.1093/brain/115.1.211. [DOI] [PubMed] [Google Scholar]
- 15.Meck WH. Neuropharmacology of timing and time perception. Cognitive Brain Research. 1996;3:227–42. doi: 10.1016/0926-6410(96)00009-2. [DOI] [PubMed] [Google Scholar]
- 16.Rammsayer TH. On dopaminergic modulation of temporal information processing. Biol Psychol. 1993;36:209–22. doi: 10.1016/0301-0511(93)90018-4. [DOI] [PubMed] [Google Scholar]
- 17.Rammsayer TH. Effects of body core temperature and brain dopamine activity on timing processes in humans. Biol Psychol. 1997;46:169–92. doi: 10.1016/s0301-0511(97)05251-4. [DOI] [PubMed] [Google Scholar]
- 18.Malapani C, Rakitin B, Levy R, Meck WH, Deweer B, Dubois B, et al. Coupled temporal memories in Parkinson’s disease: A dopamine-related dysfunction. J Cogn Neurosci. 1998;10:316–31. doi: 10.1162/089892998562762. [DOI] [PubMed] [Google Scholar]
- 19.Artieda J, Pastor MA, Lacruz F, Obeso JA. Temporal discrimination is abnormal in Parkinson’s disease. Brain. 1992;115:199–210. doi: 10.1093/brain/115.1.199. [DOI] [PubMed] [Google Scholar]
- 20.Grahn JA, Brett M. Impairment of beat-based rhythm discrimination in Parkinson’s disease. Cortex. 2009;45:54–61. doi: 10.1016/j.cortex.2008.01.005. [DOI] [PubMed] [Google Scholar]
- 21.Harrington DL, Haaland KY, Hermanowicz N. Temporal processing in the basal ganglia. Neuropsychology. 1998;12:3–12. doi: 10.1037//0894-4105.12.1.3. [DOI] [PubMed] [Google Scholar]
- 22.Riesen JM, Schnider A. Time estimation in Parkinson’s disease: Normal long duration estimation despite impaired short duration discrimination. J Neurol. 2001;248:27–35. doi: 10.1007/s004150170266. [DOI] [PubMed] [Google Scholar]
- 23.Smith JG, Harper DN, Gittings D, Abernethy D. The effect of Parkinson’s disease on time estimation as a function of stimulus duration range and modality. Brain Cogn. 2007;64:130–43. doi: 10.1016/j.bandc.2007.01.005. [DOI] [PubMed] [Google Scholar]
- 24.Wearden JH, Smith-Spark JH, Cousins R, Edelstyn NMJ, Cody FWJ, O’Boyle DJ. Stimulus timing by people with Parkinson’s disease. Brain Cogn. 2008;67:264–79. doi: 10.1016/j.bandc.2008.01.010. [DOI] [PubMed] [Google Scholar]
- 25.Schwartze M, Keller PE, Patel AD, Kotz SA. The impact of basal ganglia lesions on sensorimotor synchronization, spontaneous motor tempo and the detection of tempo changes. Behav Brain Res. 2011;216:685–91. doi: 10.1016/j.bbr.2010.09.015. [DOI] [PubMed] [Google Scholar]
- 26.Geiser E, Kaelin-Lang A. The function of dopaminergic neural signal transmission in auditory pulse perception: evidence from dopaminergic treatment in Parkinson’s patients. Behav Brain Res. 2011;225:270–5. doi: 10.1016/j.bbr.2011.07.019. [DOI] [PubMed] [Google Scholar]
- 27.Almeida QJ. Timing Control in Parkinson’s Disease. In: Dushanova J, editor. Mechanisms in Parkinson’s Disease--Models and Treatment. Tech Open Access Publishers; 2012. [Google Scholar]
- 28.Merchant H, Luciana M, Hooper C, Majestic S, Tuite P. Interval timing and Parkinson’s disease: Heterogeneity in temporal performance. Exp Brain Res. 2008;184:233–48. doi: 10.1007/s00221-007-1097-7. [DOI] [PubMed] [Google Scholar]
- 29.Yahalom G, Simon ES, Thorne R, Peretz C, Giladi N. Hand rhythmic tapping and timing in Parkinson’s disease. Parkinsonism and Related Disorders. 2004;10:143–8. doi: 10.1016/j.parkreldis.2003.10.001. [DOI] [PubMed] [Google Scholar]
- 30.Repp BH. Sensorimotor synchronization: A review of the tapping literature. Psychonomic Bulletin & Review. 2005;12:969–92. doi: 10.3758/bf03206433. [DOI] [PubMed] [Google Scholar]
- 31.Bohnen NI, Albin RL, Koeppe RA, Wernette KA, Kilbourn MR, Minoshima S, et al. Positron emission tomography of monoaminergic vesicular binding in aging and Parkinson disease. J Cereb Blood Flow Metab. 2006;26:1198–212. doi: 10.1038/sj.jcbfm.9600276. [DOI] [PubMed] [Google Scholar]
- 32.Fahn S, Elton RL. The UPDRS Development Committee. In: Fahn SMC, Calne DB, Goldstein M, editors. Recent Developments in Parkinson’s Disease. Florham Park, NJ: MacMillan; 1987. pp. 153–63. [Google Scholar]
- 33.Folstein MF, Folstein SE, McHugh PR. “Mini-mental state”: A practical method for grading the cognitive state of patients for the clinician. J Psychiatr Res. 1975;12:189–98. doi: 10.1016/0022-3956(75)90026-6. [DOI] [PubMed] [Google Scholar]
- 34.Nasreddine ZS, Phillips NA, Bedirian V, Charbonneau S, Whitehead V, Collin I, et al. The Montreal Cognitive Assessment, MoCA: A brief screening tool for mild cognitive impairment. J Am Geriatr Soc. 2005;53:695–9. doi: 10.1111/j.1532-5415.2005.53221.x. [DOI] [PubMed] [Google Scholar]
- 35.Zappia M, Crescibene L, Arabia G, Nicoletti G, Bagala A, Bastone L, et al. Body weight influences pharmacokinetics of levodopa in Parkinson’s disease. Clin Neuropharmacol. 2002;25:79–82. doi: 10.1097/00002826-200203000-00004. [DOI] [PubMed] [Google Scholar]
- 36.Jewett DM, Kilbourn MR, Lee LC. A simple synthesis of [11C]dihydrotetrabenazine (DTBZ) Nucl Med Biol. 1997;24:197–9. doi: 10.1016/s0969-8051(96)00213-2. [DOI] [PubMed] [Google Scholar]
- 37.Koeppe RA, Frey KA, Kume A, Albin R, Kilbourn MR, Kuhl DE. Equilibrium versus compartmental analysis for assessment of the vesicular monoamine transporter using (+)-alpha-[11C]dihydrotetrabenazine (DTBZ) and positron emission tomography. J Cereb Blood Flow Metab. 1997;17:919–31. doi: 10.1097/00004647-199709000-00001. [DOI] [PubMed] [Google Scholar]
- 38.Malapani C, Fairhurst S. Scalar timing in animals and humans. Learn Motiv. 2002;33:156–76. [Google Scholar]
- 39.Huynh H, Feldt LS. Conditions under which mean square ratios in repeated measurement designs have exact F-distributions. Journal of the American Statistical Association. 1970;65:1582–9. [Google Scholar]
- 40.Minoshima S, Frey KA, Koeppe RA, Foster NL, Kuhl DE. A diagnostic approach in Alzheimer’s disease using three-dimensional stereotactic surface projections of fluorine-18-FDG PET. J Nucl Med. 1995;36:1238–48. [PubMed] [Google Scholar]
- 41.Logan J, Fowler JS, Volkow ND, Wang GJ, Ding YS, Alexoff DL. Distribution volume ratios without blood sampling from graphical analysis of PET data. J Cereb Blood Flow Metab. 1996;16:834–40. doi: 10.1097/00004647-199609000-00008. [DOI] [PubMed] [Google Scholar]
- 42.Frey KA, Koeppe RA, Kilbourn MR, VanderBorght TM, Albin RL, Gilman S, et al. Presynaptic monoaminergic vesicles in Parkinson’s disease and normal aging. Ann Neurol. 1996;40:873–84. doi: 10.1002/ana.410400609. [DOI] [PubMed] [Google Scholar]
- 43.Rakshi JS, Uema T, Ito K, Bailey DL, Morrish PK, Ashburner J, et al. Frontal, midbrain and striatal dopaminergic function in early and advanced Parkinson’s disease: A 3D F-18 dopa-PET study. Brain. 1999;122:1637–50. doi: 10.1093/brain/122.9.1637. [DOI] [PubMed] [Google Scholar]
- 44.Everitt BS. Cluster analysis. New York: Edward Arnold; 1993. [Google Scholar]
- 45.Koch G, Costa A, Brusa L, Peppe A, Gatto I, Torriero S, et al. Impaired reproduction of second but not millisecond time intervals in Parkinson’s disease. Neuropsychologia. 2008;46:1305–13. doi: 10.1016/j.neuropsychologia.2007.12.005. [DOI] [PubMed] [Google Scholar]
- 46.Grahn JA, Brett M. The role of the basal ganglia in beat-based rhythm processing. J Cogn Neurosci. 2005;19:893–906. doi: 10.1162/jocn.2007.19.5.893. [DOI] [PubMed] [Google Scholar]
- 47.Grahn JA, Brett M. Rhythm and beat perception in motor areas of the brain. J Cogn Neurosci. 2007;19:1–14. doi: 10.1162/jocn.2007.19.5.893. [DOI] [PubMed] [Google Scholar]
- 48.Jones CR, Jahanshahi M. The substantia nigra, the basal ganglia, dopamine and temporal processing. J Neural Transm Suppl. 2009:161–71. doi: 10.1007/978-3-211-92660-4_13. [DOI] [PubMed] [Google Scholar]
- 49.Pastor MA, Jahanshahi M, Artieda J, Obeso JA. Performance of repetitive wrist movements in Parkinson’s disease. Brain. 1992;115:875–91. doi: 10.1093/brain/115.3.875. [DOI] [PubMed] [Google Scholar]
- 50.Ivry RB, Keele SW. Timing functions of the cerebellum. J Cogn Neurosci. 1989;1:136–52. doi: 10.1162/jocn.1989.1.2.136. [DOI] [PubMed] [Google Scholar]
- 51.O’Boyle DJ, Freeman JS, Cody FWJ. The accuracy and precision of timing of self-paced, repetitive movements in subjects with Parkinson’s disease. Brain. 1996;119:51–70. doi: 10.1093/brain/119.1.51. [DOI] [PubMed] [Google Scholar]
- 52.Perbal S, Deweer B, Pillon B, Vidailhet M, Dubois B, Pouthas V. Effects of internal clock and memory disorders on duration reproductions and duration productions in patients with Parkinson’s disease. Brain Cogn. 2005;58:35–48. doi: 10.1016/j.bandc.2005.02.003. [DOI] [PubMed] [Google Scholar]
- 53.Dickerson BC, Salat DH, Bates JF, Atiya M, Killiany RJ, Greve DN, et al. Medial temporal lobe function and structure in mild cognitive impairment. Ann Neurol. 2004;56:27–35. doi: 10.1002/ana.20163. [DOI] [PMC free article] [PubMed] [Google Scholar]
- 54.Hamalainen A, Pihlajamaki M, Tanila H, Hanninen T, Niskanen E, Tervo S, et al. Increased fMRI responses during encoding in mild cognitive impairment. Neurobiol Aging. 2007;28:1889–903. doi: 10.1016/j.neurobiolaging.2006.08.008. [DOI] [PubMed] [Google Scholar]
- 55.Dickerson BC, Sperling RA. Functional abnormalities of the medial temporal lobe memory system in mild cognitive impairment and Alzheimer’s disease: Insights from functional MRI studies. Neuropsychologia. 2008;46:1624–35. doi: 10.1016/j.neuropsychologia.2007.11.030. [DOI] [PMC free article] [PubMed] [Google Scholar]
- 56.Grahn JA, McAuley JD. Neural bases of individual differences in beat perception. Neuroimage. 2009;47:1894–903. doi: 10.1016/j.neuroimage.2009.04.039. [DOI] [PubMed] [Google Scholar]
- 57.Jahanshahi M, Jones CR, Zijlmans J, Katzenschlager R, Lee L, Quinn N, et al. Dopaminergic modulation of striato-frontal connectivity during motor timing in Parkinson’s disease. Brain. 2010;133:727–45. doi: 10.1093/brain/awq012. [DOI] [PubMed] [Google Scholar]
- 58.Bostan AC, Dum RP, Strick PL. The basal ganglia communicate with the cerebellum. Proc Natl Acad Sci U S A. 2010;107:8452–6. doi: 10.1073/pnas.1000496107. [DOI] [PMC free article] [PubMed] [Google Scholar]
- 59.Hoshi E, Tremblay L, Féger J, Carras PL, Strick PL. The cerebellum communicates with the basal ganglia. Nat Neurosci. 2005;8:1491–3. doi: 10.1038/nn1544. [DOI] [PubMed] [Google Scholar]
- 60.Kwak Y, Peltier S, Bohnen NI, Muller ML, Dayalu P, Seidler RD. Altered resting state cortico-striatal connectivity in mild to moderate stage Parkinson’s disease. Frontiers in Systems Neuroscience. 2010;4:143. doi: 10.3389/fnsys.2010.00143. [DOI] [PMC free article] [PubMed] [Google Scholar]
- 61.Wu T, Hallett M. A functional MRI study of automatic movements in patients with Parkinson’s disease. Brain. 2005;128:2250–9. doi: 10.1093/brain/awh569. [DOI] [PubMed] [Google Scholar]
- 62.Yu H, Sternad D, Corcos DM, Vaillancourt DE. Role of hyperactive cerebellum and motor cortex in Parkinson’s disease. Neuroimage. 2007;35:222–33. doi: 10.1016/j.neuroimage.2006.11.047. [DOI] [PMC free article] [PubMed] [Google Scholar]
- 63.Lee KH, Egleston PN, Brown WH, Gregory AN, Barker AT, Woodruff PWR. The role of the cerebellum in subsecond time perception: Evidence from repetitive transcranial magnetic stimulation. J Cogn Neurosci. 2007;19:147–57. doi: 10.1162/jocn.2007.19.1.147. [DOI] [PubMed] [Google Scholar]
- 64.Ivry RB, Spencer RMC. The neural representation of time. Curr Opin Neurobiol. 2004;14:225–32. doi: 10.1016/j.conb.2004.03.013. [DOI] [PubMed] [Google Scholar]
- 65.Grube M, Cooper FE, Chinnery PF, Griffiths TD. Dissociation of duration-based and beat-based auditory timing in cerebellar degeneration. Proc Natl Acad Sci U S A. 2010;107:11597–601. doi: 10.1073/pnas.0910473107. [DOI] [PMC free article] [PubMed] [Google Scholar]
- 66.Jankovic J, McDermott M, Carter J, Gauthier S, Goetz C, Golbe L, et al. Variable expression of Parkinson’s disease: a base-line analysis of the DATATOP cohort. The Parkinson Study Group. Neurology. 1990;40:1529–34. doi: 10.1212/wnl.40.10.1529. [DOI] [PubMed] [Google Scholar]
- 67.Foltynie T, Brayne C, Barker RA. The heterogeneity of idiopathic Parkinson’s disease. J Neurol. 2002;249:138–45. doi: 10.1007/pl00007856. [DOI] [PubMed] [Google Scholar]
- 68.Lewis SJG, Foltynie T, Blackwell AD, Robbins TW, Owen AM, Barker RA. Heterogeneity of Parkinson’s disease in the early clinical stages using a data driven approach. J Neurol Neurosurg Psychiatry. 2005;76:343–8. doi: 10.1136/jnnp.2003.033530. [DOI] [PMC free article] [PubMed] [Google Scholar]
- 69.Graham JM, Sagar HJ. A data-driven approach to the study of heterogeneity in idiopathic Parkinson’s disease: Identification of three distinct subtypes. Mov Disord. 1999;14:10–20. doi: 10.1002/1531-8257(199901)14:1<10::aid-mds1005>3.0.co;2-4. [DOI] [PubMed] [Google Scholar]
- 70.Tomlinson CL, Stowe R, Patel S, Rick C, Gray R, Clarke CE. Systematic review of levodopa dose equivalency reporting in Parkinson’s disease. Mov Disord. 2010;25:2649–53. doi: 10.1002/mds.23429. [DOI] [PubMed] [Google Scholar]
Associated Data
This section collects any data citations, data availability statements, or supplementary materials included in this article.