Abstract
Infection by human papillomavirus (HPV) can cause cervical intraepithelial neoplasia (CIN) and cancer. Down-regulation of E6 and E7 expression may be responsible for the positive clinical outcomes observed with IFN treatment, but the molecular basis has not been well determined. As miRNAs play an important role in HPV induced cervical carcinogenesis, we hypothesize that IFN-β can regulate the expressions of specific miRNAs in cervical cancer cells, and that these miRNAs can mediate E6 and E7 expression, thus modulate their oncogenic potential. In this study, we found that miR-129-5p to be a candidate IFN-β inducible miRNA. MiR-129-5p levels gradually decrease with the development of cervical intraepithelial lesions. Manipulation of miR-129-5p expression in Hela cells modulates HPV-18 E6 and E7 viral gene expression. Exogenous miR-129-5p inhibits cell proliferation in Hela cells, promotes apoptosis and blocks cell cycle progression in Hela cells. SP1 is a direct target of miR-129-5p in Hela cells. This study is the first report of a cellular miRNA with anti-HPV activity and provides new insights into regulatory mechanisms between the HPV and the IFN system in host cells at the miRNA level.
Introduction
Cervical carcinoma and cervical intraepithelial neoplasia (CIN) are caused by persistent infection with high-risk human papillomavirus (HPV) serotypes, most commonly HPV16 and HPV18 [1]. Therefore, treatment of HPV infection is the key to preventing cervical cancer and CIN. Two oncoproteins, E6 and E7, which encoded by HPV16 and HPV18, can bind to and stimulate the degradation of the tumor suppressors p53 and pRb [2]–[5]. IFN has been widely used in the treatment of CIN and cervical cancer. Down-regulation of E6 and E7 expression may be responsible for the positive clinical outcomes observed with IFN treatment, but the molecular basis has not been well determined.
MicroRNAs (miRNAs) are 19–25 nt regulatory RNAs that participate in the regulation of various biological functions as well as in defense against pathogens in numerous eukaryotic lineages. They are generally believed to act by binding to imperfectly complementary sequences in the 3′untranslated (UTR) region of the target genes, resulting in decreased translation or degradation of the target transcript. In particular, the sequence complementarily in the 6–8 base pair “seed region” at the 5′ end of the miRNA-mRNA heteroduplex seems to determine the specificity of miRNA-targetRNA interactions. MiRNAs can have pleiotropic effects on cell proliferation, apoptosis and cell differentiation [6]. Alterations in cellular miRNA patterns in cervical cancer tissue or cervical cancer cells have been reported. Downregulation of human miR-218 [7], [8] and miR-34a [9] in cervical cancer cells were addressed to the HPV 16 E6 oncogene, while inhibition of miR-21 in HPV 18-containing Hela cervical cancer cells causes a strong suppression of cell proliferation [10]. It thus seems that miRNAs play an important role in cervical carcinogenesis by HPV.
MiRNAs may play a role in IFN-β induced E6 and E7 repression. It has been 1shown miRNAs can be induced by IFN-β. In RSa cells, IFN-β can induce miR-431 expression, which may down-regulate IGF1R and IRS2 expression and consequently inhibit cell proliferation by suppressing the MAPK pathway [11]. In hepatocytes, IFN-β mediates modulation of the expression of numerous cellular miRNAs with nearly perfect complementarity in their seed sequences with the HCV RNA genome that are capable of inhibiting HCV replication and infection [12]. As miRNAs play an important role in HPV induced cervical carcinogenesis, we hypothesize that IFN-β can regulate the expressions of specific miRNAs in cervical cancer cells, and that these miRNAs can mediate E6 and E7 expression, thus modulate their oncogenic potential. To verify this, we screened for miRNAs expressed and differentially regulated in HPV-18 positive Hela cells following exposure to IFN-β, and we found that miR-129-5p to be a candidate IFN-β inducible miRNA which can downregulate E6 and E7 expression.
Materials and Methods
Cell lines and human tissues
The HPV 18-positive Hela cell line [13], HPV 16-negative Siha cell line [13], HPV-negative C33A cervical cancer cell line [13] and well-differentiated cervical squamous cell carcinoma HCC94 cell line [14] were used in this study. All of these cells were grown in Dulbecco's modified Eagle's medium (DMEM) with 10% FBS at 37°C and 5% CO2. The cell lines were harvested after IFN-β (3× 10⁵IU L−1) treatment for 2 h.
Normal cervix and cervical cancer tissues were obtained from women ranging in age from 28 to 77 years old. Four normal cervical samples were obtained from patients who underwent hysterectomy to treat other types of diseases such as myoma or adenomyosis. None of the patients had undergone hormone therapy, radiotherapy or chemotherapy before surgery. The stages and histological grades of these tumors were established according to the criteria of the International Federation of Gynecology and Obstetrics (FIGO). Each tissue sample was immediately snap-frozen in liquid nitrogen and stored at −80°C until RNA extraction. Prior written and informed consent was obtained from each patient, and the study was approved by the ethics committee of the Medical Faculty of Shanghai Jiao Tong University. Clinical and pathological data relating to the clinical samples are presented in Table 1.
Table 1. Clinicopathological parameters of endometrial cancer samples.
| Characteristics | No. of patients(%) |
| Total | 33 (100) |
| Age (years) | |
| ≤50 | 22 (66) |
| >50 | 11 (34) |
| Histological type | |
| CIN I-II | 6 (18.18) |
| CIN III | 13 (39.39) |
| Ib2 | 9 (27.27) |
| IIa | 5 (15.15) |
| Human papillomavirus | 33 (100) |
Microarray expression profiling and data analysis
Total RNA in cells or tissues were isolated using Tri-reagent (Molecular Research Center, Cincinnati, OH) according to the manufacturer's instructions. After passing RNA quality measurements in a Nanodrop instrument, the samples were labeled using the miRCURY™ Hy3™/Hy5™ Power labeling kit and hybridized on the miRCURY™ LNA Array (v.11.0). The samples were hybridized on a hybridization station following the protocol outlined by the manufacturer. Scanning was performed with the Axon GenePix 4000B microarray scanner. GenePix pro V6.0 was used to read the raw intensity of the image. The threshold values used to screen differentially expressed miRNAs were fold changes ≥1.5 or ≤0.7, and P values ≤0.05 in t-tests were considered significant.
Crucial seed sequence complementarity analysis
Array data processing and crucial seed sequence complementarity analysis were performed using the web sites (http://www.mirbase.org/, http://www.ncbi.nlm.nih.gov/sites/entrez?db=pubmed and http://www.ebi.ac.uk/Tools/emboss/align/).
Analysis of miRNA and mRNA by qPCR
Total RNA was extracted from cultured cells and tissues using Tri-reagent. For miRNA analysis, mature miRNAs were reverse transcribed from total RNA using specific miRNA RT primers in the TaqMan MicroRNA Assays and reagents in the TaqMan MicroRNA Reverse Transcription kit. qPCR was performed using TaqMan MicroRNA Assay primers with the TaqMan Universal PCR Master Mix and analyzed with an ABI Prism 7000 Sequence Detection System (Applied Biosystems, Foster City, CA) according to the manufacturer's instructions. U6B was detected as an internal control to normalize all data. The assay names for miR-129-5p and U6B were hsa-mir-129-5p and RNU6B, respectively (Applied Biosystems). The cDNA was generated using the Prime Script RT Reagent Kit (TaKaRa, Dalian, PRC). For quantification of HPV18 E6, HPV18 E7 and ISG54, real-time PCR was carried out on the ABI Prism 7000 Sequence Detection System with SYBR Premix Ex Taq (TaKaRa). The primer sequences are shown in Table 2. For all qPCR assays, expressions were calculated by the formula 2(−ΔΔCt), where ΔCt is the difference between gene Ct and normalizer gene Ct. Ct represents the threshold cycle at which fluorescence rises statistically significantly above the baseline. Experiments were performed in triplicate in three independent experiments.
Table 2. Primer sequences for real-time PCR.
| mRNA | Size (bp) | Primer sequence |
| ISG54 | 144 | forward 5′–TTCAGCATTTATTGGTGGCAGAAG-3′ |
| reverse 5′- AACTCTAAAATCCCACCCTGCC-3′ | ||
| ISG56 | 131 | forward 5′- GTCGTCTCTGCGCATCTTGTT-3′ |
| reverse 5′- TGCAGATAGAAAGCCTGCCTG-3′ | ||
| β-ACTIN | 251 | forward 5′- CAGCCATGTACGTTGCTATCCAGG-3′ |
| reverse 5′- AGGTCCAGACGCAGGATGGCATG-3′ | ||
| HPV-18 E6 | forward 5′- ATCCAACACGGCGACCCTACAA-3′ | |
| reverse 5′- CTGGATTCAACGGTTTCTGG-3′ | ||
| HPV-18 E7 | forward 5′- ACCTTCTATGTCACGAGCAAT-3′ | |
| reverse 5′- CGGACACACAAAGGACAGGGT-3′ |
Cell transfections
Cells were washed with PBS and switched to antibiotic-free growth medium for 24–48 h before transfection. Cells were transiently transfected with pre-miR-129-5p, non-specific miRNA control (pre-miR-negative) or blank control (Applied Biosystems) in Opti-MEM (Invitrogen, Carlsbad, CA) using siPORT NeoFX Transfection agent (Applied Biosystems) following the manufacturer's protocol. Medium was replaced 8 h later. Equal copy numbers of plasmids were transfected using Lipofectamine 2000 (Invitrogen) following the manufacturer's protocol. Luciferase reporter vector bearing the target sites for miR-129-5p of the SP1 3′-UTR region was purchased by Shanghai choseasy co., Ltd. The detailed information on the constructs used in this experiment is shown in Table 3.
Table 3. Sequences of inserted fragments in the luciferase constructs.
| Name | Sequence |
| Sp1 | 5′tcgagTGAAATACTTTTTAACAAAAAACAGATTCTATTGAAATACTTTTTAACAAAAAACAGATTCTATgc-3′ |
| 5′ggccgcATAGAATCTGTTTTTTGTTAAAAAGTATTTCAATAGAATCTGTTTTTTGTTAAAAAGTATTTCAc-3′ | |
| Mutant SP1 (negative construct) | 5′tcgagTGAAATACTTTTTAAGtttttACAGATTCTATTGAAATACTTTTTAAGtttttACAGATTCTATgc-3′ |
| 5′ggccgcATAGAATCTGTAAAAACTTAAAAAGTATTTCAATAGAATCTGTAAAAACTTAAAAAGTATTTCAc-3′ |
Proliferation assays
Cells (3000 per well) were plated in 96-well plates and grown for 72 h after transfection (final miRNA concentration of 100 nM) in DMEM/F12 containing 10% FBS. Cell proliferation was documented every 24 h for 3 days using the colorimetric MTT assay (Sigma, St. Louis, MO), and absorbance at 490 nm was evaluated by a Spectra Max 190 microplate reader (Molecular Devices, Sunnyvale, CA).
Cells, including transfected cells, were starved for 24 h by replacing the medium with phenol red-free and serum-free DMEM/F12 medium (HyClone Laboratories, Logan, UT), and appropriate vehicle control with phenol red–free medium containing 5% charcoal-stripped FBS (HyClone Laboratories) for 48 h. Cell proliferation was documented every 24 h for 2 days. Within an individual experiment, proliferation under each condition was tested in triplicate, and the overall experiment was repeated at least twice.
Cell cycle analysis
Cells were fixed with 70% ethanol at 72 h after transfection and stained with 25 µg/mL PI (Roche Molecular Biochemicals, Indianapolis, IN) in FACS buffer (PBS containing 0.1% bovine serum albumin (BSA), 0.05% of Triton X-100, and 50 µg/mL of RNase A). After 30 min at room temperature protected from light, the cells were analyzed via flow cytometry using a Becton Dickinson FACScan, and the fractions of the cells in the G0/G1, S and G2/M phases were analyzed using Cell Quest Pro Software (BD Biosciences, San Jose, CA). Experiments were performed in triplicate in three independent experiments.
Annexin V assay
The samples were washed with PBS and using Annexin V-FITC and PI staining for determination of phosphatidylserine exposure on the outer plasma membrane. After incubation for 30 min at room temperature protected from light, the samples were quantified by flow cytometry, using a Becton Dickinson FACScan. Experiments were performed in triplicate in three independent experiments.
Luciferase reporter assays
For luciferase assays, cells (15,000 per well) were plated 24 h before transfection onto white, clear-bottom 96-well plates. The cells were co-transfected with 100 ng of SP1 3′-UTR reporter plasmid with 50 nM pre-miR construct using Lipofectamine 2000 (Invitrogen) according to the manufacturer's protocol. Luciferase activity was assayed 24 h after transfection with the Dual-Glo Luciferase Assay System (Promega, Madison, WI) and was measured with an Envision Plate-reader (Perkin Elmer Inc., Wellesley, MA). Samples were tested in triplicate in three independent experiments.
Western blot analysis
After the indicated treatments, the cells were harvested and proteins prepared using NE-PER Nuclear and Cytoplasmic Extraction Reagent (Pierce, Rockford, IL) with protease inhibitor cocktail (Roche Diagnostics). All extracts were lysed according to the manufacturer's protocol. Total protein content was determined by the Bradford protein method using the BCA protein assay kit (Pierce). Proteins (60 μg) were loaded onto precast 4% stacking, 10% Tris glycine gels and separated by gel electrophoresis followed by electrophoretic blotting onto a PVDF membrane. After washing with Tris-buffered saline, membranes were blocked with 5% BSA/PBS for 1 h. Membranes were incubated with polyclonal rabbit antibodies directed against SP1 and p21 (1∶1000 dilution) (Abcam, UK). The membranes were then incubated with a goat anti-rabbit secondary antibody (1∶1000; Santa Cruz Biotechnology, Santa Cruz, CA), and the blotted proteins were visualized using the enhanced chemi-luminescence detection system (Pierce), with pre-stained markers (Bio-Rad Laboratories, Hercules, CA) as molecular size standards. The intensities of protein bands were quantified using Image J software (National Institutes of Health, Bethesda, MD).
Statistical analysis
All tests were carried out with the Statistical Package for the Social Sciences software version 17.0 (Chicago, IL, USA). Data are represented as means with standard deviation (SD). Statistical significance was determined with Student t-tests, and P values less than 0.05 were considered statistically significant. All statistical tests were two-sided.
Results
MiRNA expression profiling in Hela cells induced by IFN-β
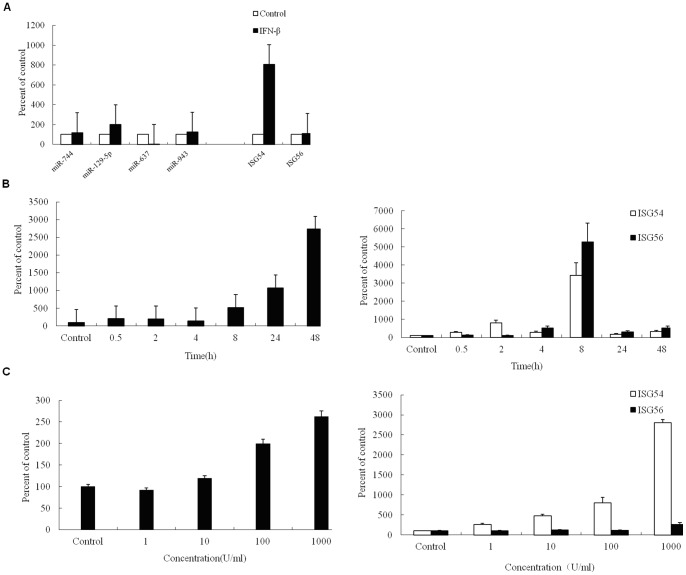
The differentially expressed miRNAs between untreated and IFN-β induced Hela cells were analyzed using microarrays. The expressions of miR-129-5p, miR-637, miR-744 and miR-943 were found to be most highly induced in Hela cells by IFN-β and selected for further analysis (Table 4, and Fig. S1). The seed sequence of miR-129-5p displayed perfect complementarity with the HPV-18 genome (Fig. 1). Quantitative real-time PCR (qPCR) was then carried out to validate the microarray analysis, and the results demonstrated that expressions of miRNA-744, miR-943 and miR-129-5p were basically consistent with that of the microarray; Time course analysis of expression revealed that induction of miR-129-5p occurred rapidly, peaking within 48 h. Similar to the induction of ISG54, a well-characterized IFN-β regulated gene, upregulation of miR-129-5p followed a classical dose-response curve between 3 and 3000 IU−1 ml of IFN-β (Fig. 2).
Table 4. Differentially expressed miRNA in Hela cells by IFN-β treatment.
| Name | ID | Fold change | P value | |
| Upregulated miRNAs | hsa-miR-744 | 27568 | 1.96 | 0.03 |
| hsa-miR-129-5p | 42467 | 1.83 | 0.03 | |
| hsa-miR-637 | 17354 | 1.64 | 0.07 | |
| hsa-miR-943 | 42696 | 1.56 | 0.12 | |
| hsa-miR-2223 | 11024 | 1.46 | 0.13 | |
| Downregulated miRNAs | hsa-miR-1279 | 45775 | 0.66 | 0.03 |
| hsa-miR-526b* | 46758 | 0.69 | 0.03 | |
| hsa-miR-203 | 11004 | 0.64 | 0.07 | |
| hsa-miR-2295p | 11038 | 0.50 | 0.09 |
Figure 1. The seed sequence of miR-129-5p displays perfect complementarity with the HPV-18 genome.

Figure 2. MiR-129-5p can be induced by IFN-β in Hela cells.
(A) Validation of the microarray data by qPCR. Triplicate assays were performed for each sample. Inductions of known IFN-regulated genes ISG54 and ISG56 are shown for comparsion. (B) Time course of miRNA induction by IFN-β. Hela cells were stimulated with 300 IU ml−1 IFN-β for the indicated times, and miR-129-5p and ISG54/ISG56 expressions were quantified by qPCR. (C) Dose-response analysis of miRNA induction by IFN-β. Hela cells were stimulated with the indicated doses of IFN-β for 2 h, and miR-129-5p and ISG54/ISG56 expressions were quantified by qPCR.
MiR-129-5p levels gradually decrease with the development of cervical intraepithelial lesions and correlate with HPV-18 E6 and E7 expression
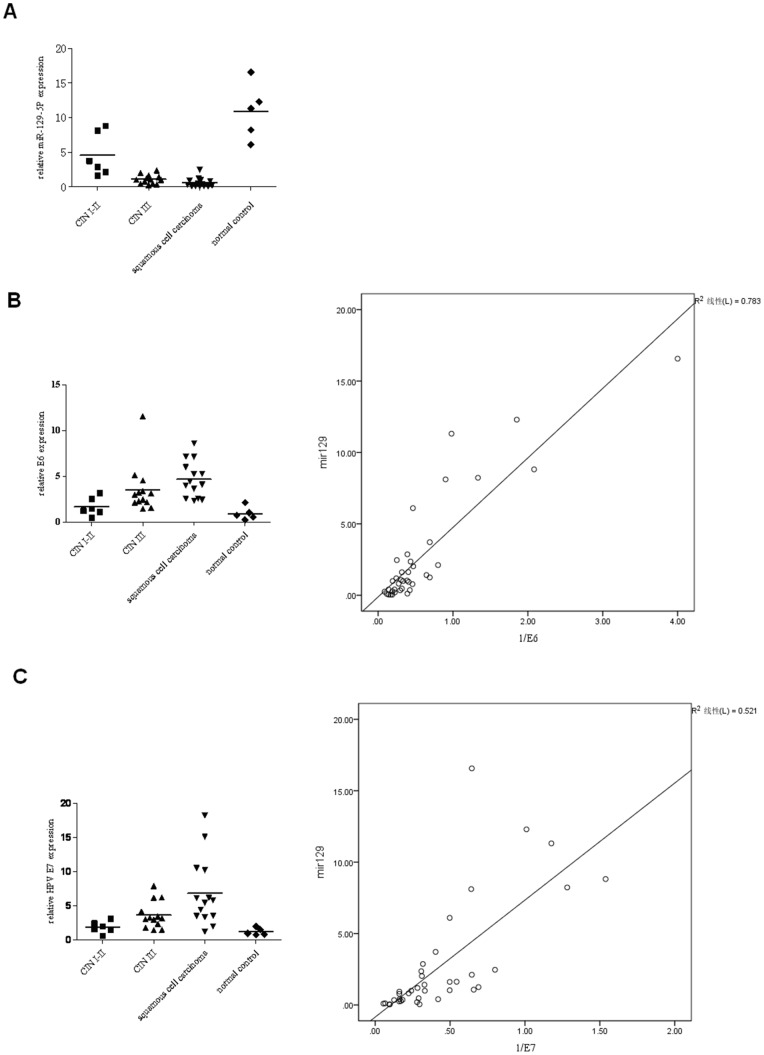
By qPCR analysis in human cervical intraepithelial lesion samples and normal cervical tissues, the miR-129-5p expression levels were much lower in cancer than in CIN I-II and normal cervical samples (Fig. 3 A). the average expressions of miR-129-5p were 10.90±4.01, 4.54±3.12, 1.07±0.65 and 0.57±0.67, respectively, in the normal cervical tissues (control), CIN I-II group, CIN III group, and squamous cell carcinoma groups. Statistically significant differences in the miR-129-5p expressions were found when comparing the four groups (P<0.05). The clinical stages and pathological grades of the CIN I-II group compared to the other groups were confirmed to be significantly different (P<0.05). HPV-18 E6 and E7 expression were significant increased from the normal cervix group, CIN I-II group, CIN III group, and squamous cell carcinoma group (P<0.05, Fig. 3 B, C). The average expressions of HPV-18 E6 were 1.67±0.41, 3.55±0.73, 4.70±0.53 and 0.94±0.33, respectively, in the normal cervical tissues (control), CIN I-II group, CIN III group, and squamous cell carcinoma groups, while the average expressions of HPV-16 E7 were 1.90±0.35, 3.67±0.55, 6.87±1.33 and 1.23±0.24 in these samples. Negative correlation has been found between the expression of miR-129-5p and HPV-18 E6/E7 in cervical tissue samples (P<0.05, Fig. 3 D, E).
Figure 3. The expression of miRNA-129-5p and HPV-18 E6/E7 in human cervical intraepithelial lesion samples and normal cervical tissues.
(A) The expression of miRNA-129-5p in human cervical intraepithelial lesion samples and normal cervical tissues. (B) The expression of HPV-18 E6 in the same samples. (C) The expression of HPV-18 E7 in these samples. (D, E) Correlation between the expressions of HPV-18 E6/E7 and miR-129 in these samples.
Manipulation of miR-129-5p expression in Hela cells modulates HPV-18 E6 and E7 viral gene expression
To assess whether miR-129-5p has a functional role in the down-regulation of HPV18 E6 and E7, we manipulated the expression level of miR-129-5p in Hela cells. The three groups included control cells (untreated), cells transfected with non-specific miRNA control (pre-miR-negative), cells transfected with pre-miR-129. At 72 h after transient transfection of pre-miRNAs, the mRNA expressions of HPV-18 E6 and E7 in Hela cells were detected by qPCR. Transfection of pre-miR-129-5p significantly decreased HPV-18 E6 and E7 mRNAs (Fig. 4B, Fig. 4C and Fig. S2), and this effect was highly specific, as pre-miR-negative transfection showed no effect on HPV-18 E6 and E7 expression.
Figure 4. Increase of miR-129-5p expression in Hela cells decreased HPV-18 E6 and E7 viral gene expressions.
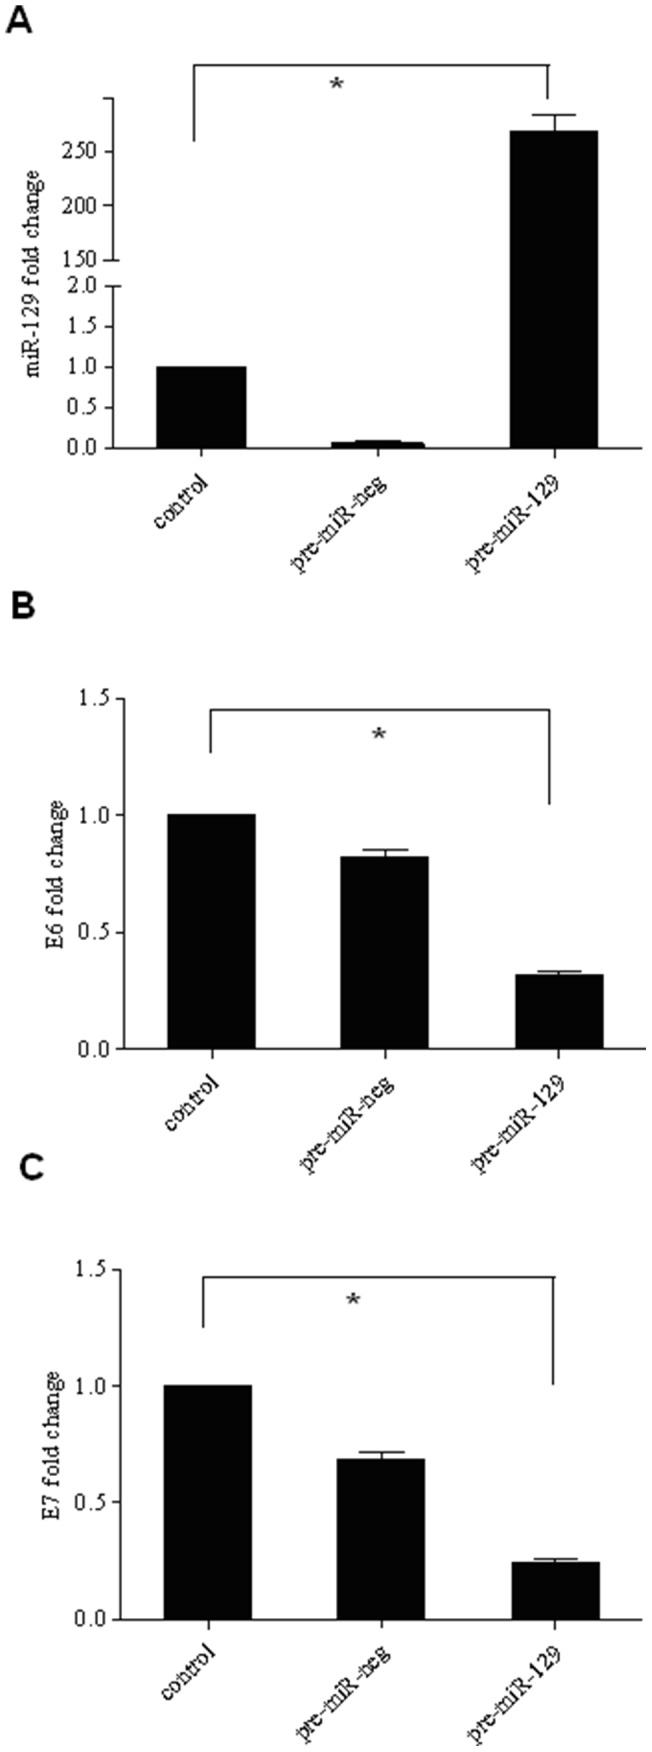
Fig.(A) showed the efficiency of miR-129 transfection. Fold changes of the expressions of (B) HPV-18 E6 and (C) HPV-18 E7 in Hela cells determined by qPCR. The experiment was repeated twice, each with three replicates. Means (bars) and SDc (error bars) are shown. *P<0.001.
Exogenous miR-129-5p inhibits cell proliferation in Hela cells
We next tested whether increased levels of miR-129-5p could decrease the proliferative potential of Hela cells as reported in bladder cancer cells. An MTT-based assay was performed to assess the proliferation of Hela cells for up to 72 h after transfection with miR-129-5p. The proliferation assay revealed that miR-129-5p over-expression inhibited cell growth (Fig. 5), whereas cells transfected with control miRNA continued to grow during this period.
Figure 5. Exogenous miR-129-5p inhibited cell proliferation and promoted apoptosis of Hela cells.
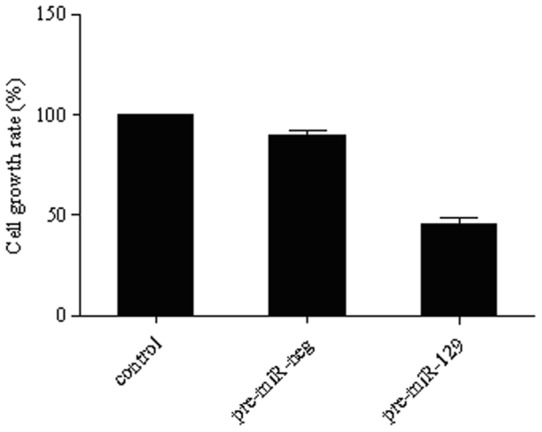
Cell growth was measured by an MTT assay. The experiment was repeated at least twice, each with three replicates, and the data are expressed as mean absorbances with SD. *P<0.001; #P<0.05.
Exogenous miR-129-5p promotes apoptosis and blocks cell cycle progression in Hela cells
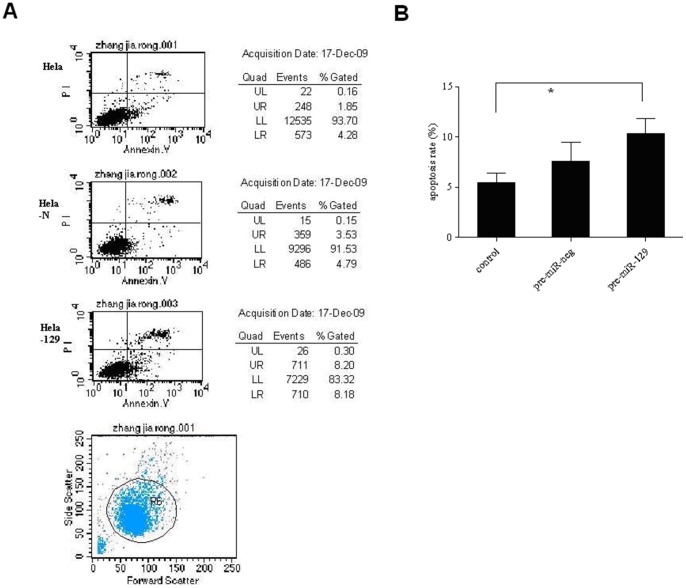
As determined by Annexin V labeling, untreated cells and those treated with pre-miR-negative controls remained viable and were primarily Annexin V and propidium iodide (PI) negative. A rightward shift in the fluorescence activated cell sorting (FACS) profile, indicative of apoptosis, was observed for Hela cells transfected with pre-miR-129-5p (Fig. 6).
Figure 6. Exogenous miR-129-5p promoted apoptosis of Hela cells.
Annexin V analysis showed that Hela cells transfected with pre-miR-129-5p displayed a significantly greater apoptosis level than the control groups. *P<0.01, #P<0.05.
Cell cycle analysis by flow cytometry demonstrated that proportions of cells in G0/G1 and S phases in the negative controls were unchanged compared to untreated cells. Transfection of Hela cells with pre-miR-129-5p resulted in an accumulation of cells in the G0/G1 phase and a decrease of cells in the S phase compared with control cells. Flow cytometric analysis suggested that miR-129-5p could arrest Hela cells at the G1/S checkpoint and delay the cell cycle from entering into the S phase. Consequently, miR-129-5p over-expression slowed down the cell cycle progression and caused a cell cycle G1 phase block, although the difference was not statistically significant.
SP1 is a direct target of miR-129-5p in Hela cells
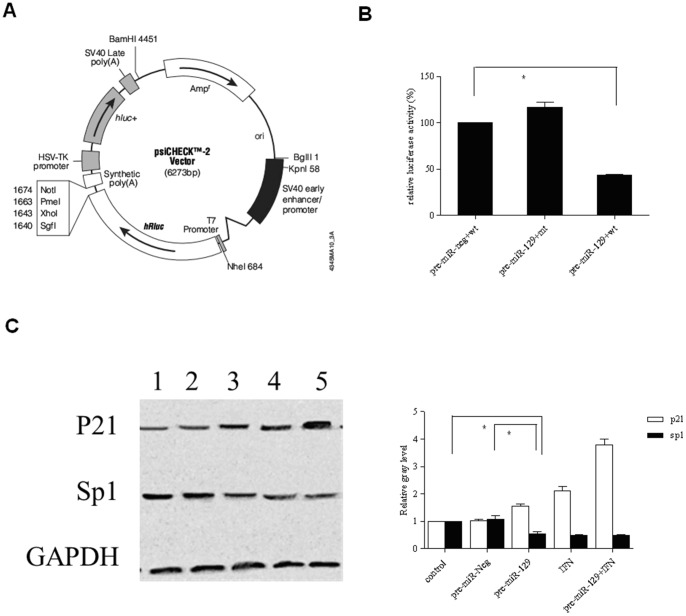
A dual-luciferase reporter assay was used to determine whether miR-129-5p could bind to the miR-129-5p target sites within the SP1 3′-UTR. We used constructs containing the predicted seed sequence to test the inhibitory effect of miR-129-5p. Transfection of pre-miR-129-5p in Hela cells for 48 h decreased luciferase activity as compared with the negative control. While no change in activity was observed when transfected with the control (Fig. 7B), Western blot analysis verified that exogenous miR-129-5p could reduce the protein levels of SP1 (Fig. 7C).
Figure 7. Negative regulation of SP1 by miR-129-5p in Hela cells.
(A) Vector restriction map. (B) SP1 was targeted by miR-129-5p via its 3′UTR in Hela cells as assessed using a luciferase assay. (C) Western blot analyses of p21, SP1 and GAPDH in Hela cells after miR-129-5p over-expression. Means (bars) and SD (error bars) are shown.*P<0.05.
Discussion
In this report, we identified IFN-β induced miRNAs in the HPV-18 positive Hela cells. miRNA microarray analysis showed the expressions of miR-129-5p, miR-637, miR-744 and miR-943 were increased, while miR-526* were downregulated after IFN-β stimulation. miR-129-5p was picked out for further study, as bioinformatic analysis revealed that miR-129-5p and the HPV-18 viral gene sequences are fully complementary. It has been shown that miR-129-5p was deregulated in several tumor types including endometrial cancer, esophageal cancer, colon cancer and bladder cancer, and its verified target genes included SOX4 [15]–[17], VCP/p97 [18] and Cdk6 [19]. Over-expression of miR-129-5p can inhibit cell growth and induce cell death in bladder cancer [17] and hepatocellular cancer [18], however, its role in cervical cancer is not clear.
We found that miR-129-5p over-expression could inhibit the growth of Hela cells to about 70.23% of control cells. Meanwhile, the transfected pre-miR-129-5p increased the arrest of Hela cells at G0-G1 phase (68.34%), while S phase cells decreased, indicating that cell proliferation was inhibited as DNA synthesis slowed. These results of the effect of miR-129-5p on cell proliferation and cell cycle along with its ability to increase apoptosis were in line with observations in bladder cancer cells [17]. Our study also showed that miR-129-5p expression was induced by IFN-β in a dose and time-dependent manner. These results imply that the anti-proliferation and pro-apoptosis effect of IFN- in cervical cancer may partly due to the induction of miR-129-5p expression.
Cervical cancer caused by HPV infection is mainly associated with the E6 and E7 viral oncogenes. By qPCR analysis, transfection of pre-miR-129-5p in Hela cells was found decrease the expressions of E6 and E7 by 69.01% and 77.15%, respectively. To our knowledge, this is the first report that a IFN-β induced microRNA can down-regulate HPV-18 E6 and E7 viral gene expression. Our further investigation found that the transcription factor SP1 is a direct downstream target of miR-129-5p. SP1 is a sequence-specific DNA binding protein which contains a miR-129-5p binding site in its 3′-UTR. The upstream regulatory regions of HPV-18 genes contain the SP1 binding site, and they have been shown to determine E6 and E7 gene expression [20]–[22]. In the present study, we found that SP1 expression could be down-regulated significantly by over-expressed miR-129-5p. Moreover, we confirmed the existence of a binding site for miR-129-5p at SP1 3′-UTR by luciferase activity assay. Taken together, our results suggest that the induced expression of miR-129-5p by IFN-β suppress the progression of cervical cancer by down-regulating HPV-18 E6 and E7 expression, and SP1 is a direct downstream target of miR-129-5p. An interesting result revealed by our investigation is that miR-129-5p expression was high in CIN I tumors, but it gradually decreased over the course of cancer development and the rise of pathological grade. HPV infection can induce alteration of cellular miRNA expression during the development of cervical cancer. Downregulation of human miR-218 and miR-34a in cervical cancer cells were addressed to the HPV 16 E6 oncogene. An recent study showed that 25 miRNAs were differentially regulated in two or three HPV types (HPV 11/16/45) [23]. It is reasonable that miR-129-5p expression may be suppressed by HPV infection, as the infection rate of high-risk HPV increased through CIN I to cervical cancer. Nevertheless, further study is needed to determine the exact mechanism of decreased miR-129-5p expression during the progression of cervical cancer.
Supporting Information
The heat map for the differentially expressed miRNAs between untreated and IFN-β induced Hela cells.
(TIF)
A The expression of HPV-18 E6 in hela cells; S2B The expression of HPV-18 E7 in hela cells.
(TIF)
Acknowledgments
A special thanks to Youji Feng and Feng Wang of Shanghai First People's Hospital Affiliated to Shanghai Jiao Tong University for providing technological guidance along the course of this study.
Funding Statement
The present study was supported by the National Natural Science Funds of China (Nos. 81072139 and 30872760) and the 2011 Shanghai municipal special foundation for health care (No.201002013). The funders had no role in study design, data collection and analysis, decision to publish, or preparation of the manuscript.
References
- 1. Bosch FX, Manos MM, Munoz N, Sherman M, Jansen AM, et al. (1995) Prevalence of human papillomavirus in cervical cancer: a worldwide perspective. International biological study on cervical cancer (IBSCC) Study Group. J Natl Cancer Inst 87: 796–802. [DOI] [PubMed] [Google Scholar]
- 2. Scheffner M, Werness BA, Huibregtse JM, Levine AJ, Howley PM (1990) The E6 oncoprotein encoded by human papillomavirus types 16 and 18 promotes the degradation of p53. Cell 63: 1129–1136. [DOI] [PubMed] [Google Scholar]
- 3. Scheffner M, Huibregtse JM, Vierstra RD, Howley PM (1993) The HPV-16 E6 and E6-AP complex functions as a ubiquitin-protein ligase in the ubiquitination of p53. Cell 75: 495–505. [DOI] [PubMed] [Google Scholar]
- 4. Werness BA, Levine AJ, Howley PM (1990) Association of human papillomavirus types 16 and 18 E6 proteins with p53. Science 248: 76–79. [DOI] [PubMed] [Google Scholar]
- 5. Dyson N, Howley PM, Munger K, Harlow E (1989) The human papilloma virus-16 E7 oncoprotein is able to bind to the retinoblastoma gene product. Science 243: 934–937. [DOI] [PubMed] [Google Scholar]
- 6. Cowland JB, Hother C, Gronbaek K (2007) MicroRNAs and cancer. APMIS 115: 1090–1106. [DOI] [PubMed] [Google Scholar]
- 7. Li Y, Liu J, Yuan C, Cui B, Zou X, et al. (2010) High-risk human papillomavirus reduces the expression of microRNA-218 in women with cervical intraepithelial neoplasia. J Int Med Res 38: 1730–1736. [DOI] [PubMed] [Google Scholar]
- 8. Martinez I, Gardiner AS, Board KF, Monzon FA, Edwards RP, et al. (2008) Human papillomavirus type 16 reduces the expression of microRNA-218 in cervical carcinoma cells. Oncogene 27: 2575–2582. [DOI] [PMC free article] [PubMed] [Google Scholar]
- 9. Wang X, Meyers C, Guo M, Zheng ZM (2011) Upregulation of p18Ink4c expression by oncogenic HPV E6 via p53-miR-34a pathway. Int J Cancer 129: 1362–1372. [DOI] [PMC free article] [PubMed] [Google Scholar]
- 10. Yao Q, Xu H, Zhang QQ, Zhou H, Qu LH (2009) MicroRNA-21 promotes cell proliferation and down-regulates the expression of programmed cell death 4 (PDCD4) in HeLa cervical carcinoma cells. Biochem Biophys Res Commun 388: 539–542. [DOI] [PubMed] [Google Scholar]
- 11. Tanaka T, Sugaya S, Kita K, Arai M, Kanda T, et al. (2012) Inhibition of cell viability by human IFN-beta is mediated by microRNA-431. Int J Oncol 40: 1470–1476. [DOI] [PubMed] [Google Scholar]
- 12. Pedersen IM, Cheng G, Wieland S, Volinia S, Croce CM, et al. (2007) Interferon modulation of cellular microRNAs as an antiviral mechanism. Nature 449: 919–922. [DOI] [PMC free article] [PubMed] [Google Scholar]
- 13.Ren C, Cheng X, Lu B, Yang G (2013) Activation of interleukin-6/signal transducer and activator of transcription 3 by human papillomavirus early proteins 6 induces fibroblast senescence to promote cervical tumourigenesis through autocrine and paracrine pathways in tumour microenvironment. Eur J Cancer: in press. [DOI] [PubMed]
- 14. Qin R, Chen Z, Ding Y, Hao J, Hu J, et al. (2013) Long non-coding RNA MEG3 inhibits the proliferation of cervical carcinoma cells through the induction of cell cycle arrest and apoptosis. Neoplasma 60: 486–92. [DOI] [PubMed] [Google Scholar]
- 15. Shen R, Pan S, Qi S, Lin X, Cheng S (2010) Epigenetic repression of microRNA-129-2 leads to overexpression of SOX4 in gastric cancer. Biochem Biophys Res Commun 394: 1047–1052. [DOI] [PubMed] [Google Scholar]
- 16. Huang YW, Liu JC, Deatherage DE, Luo J, Mutch DG, et al. (2009) Epigenetic repression of microRNA-129-2 leads to overexpression of SOX4 oncogene in endometrial cancer. Cancer Res 69: 9038–9046. [DOI] [PMC free article] [PubMed] [Google Scholar]
- 17. Dyrskjot L, Ostenfeld MS, Bramsen JB, Silahtaroglu AN, Lamy P, et al. (2009) Genomic profiling of microRNAs in bladder cancer: miR-129 is associated with poor outcome and promotes cell death in vitro. Cancer Res 69: 4851–4860. [DOI] [PubMed] [Google Scholar]
- 18. Liu Y, Hei Y, Shu Q, Dong J, Gao Y, et al. (2012) VCP/p97, Down-Regulated by microRNA-129-5p, Could Regulate the Progression of Hepatocellular Carcinoma. PLoS One 7: e35800. [DOI] [PMC free article] [PubMed] [Google Scholar]
- 19. Wu J, Qian J, Li C, Kwok L, Cheng F, et al. (2010) miR-129 regulates cell proliferation by downregulating Cdk6 expression. Cell Cycle 9: 1809–1818. [DOI] [PubMed] [Google Scholar]
- 20. Hoppe-Seyler F, Butz K (1992) Activation of human papillomavirus type 18 E6-E7 oncogene expression by transcription factor Sp1. Nucleic Acids Res 20: 6701–6706. [DOI] [PMC free article] [PubMed] [Google Scholar]
- 21. Demeret C, Desaintes C, Yaniv M, Thierry F (1997) Different mechanisms contribute to the E2-mediated transcriptional repression of human papillomavirus type 18 viral oncogenes. J Virol 71: 9343–9349. [DOI] [PMC free article] [PubMed] [Google Scholar]
- 22. Demeret C, Le Moal M, Yaniv M, Thierry F (1995) Control of HPV 18 DNA replication by cellular and viral transcription factors. Nucleic Acids Res 23: 4777–4784. [DOI] [PMC free article] [PubMed] [Google Scholar]
- 23. Dreher A, Rossing M, Kaczkowski B, Andersen DK, Larsen TJ, et al. (2011) Differential expression of cellular microRNAs in HPV 11, -16, and -45 transfected cells. Biochem Biophys Res Commun 412: 20–25. [DOI] [PubMed] [Google Scholar]
Associated Data
This section collects any data citations, data availability statements, or supplementary materials included in this article.
Supplementary Materials
The heat map for the differentially expressed miRNAs between untreated and IFN-β induced Hela cells.
(TIF)
A The expression of HPV-18 E6 in hela cells; S2B The expression of HPV-18 E7 in hela cells.
(TIF)


