Abstract
Solar radiation causes damage to human skin, and photoprotection is the main way to prevent these harmful effects. The development of sunscreen formulations containing nanosystems is of great interest in the pharmaceutical and cosmetic industries because of the many potential benefits. This study aimed to develop and evaluate an octyl methoxycinnamate (OMC) liposomal nanosystem (liposome/OMC) to obtain a sunscreen formulation with improved safety and efficacy by retaining OMC for longer on the stratum corneum.
Methods
The liposome/OMC nanostructure obtained was tested for enzymatic hydrolysis with lipase from Rhizomucor miehei and biodistribution with liposomes labeled with technetium-99m. The liposome/OMC formulation was then incorporated in a gel formulation and tested for ocular irritation using the hen’s egg test-chorio-allantoic membrane (HET-CAM) assay, in vitro and in vivo sun protection factor, in vitro release profile, skin biometrics, and in vivo tape stripping.
Results
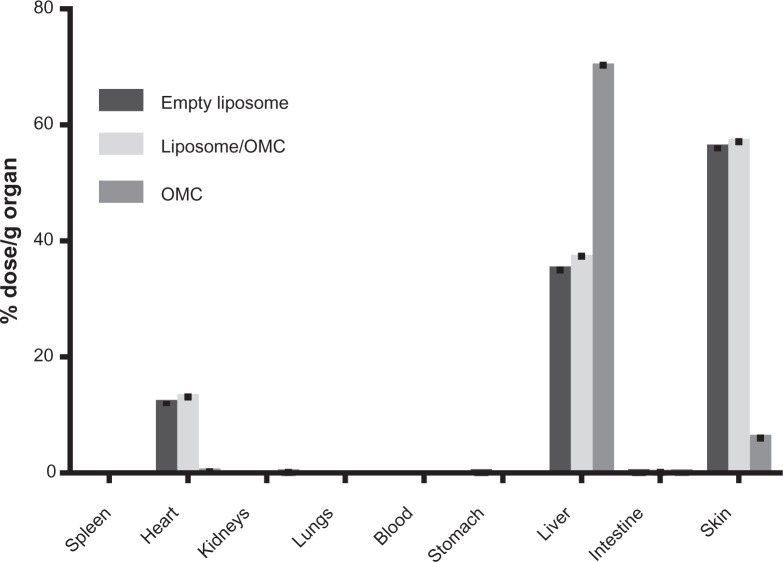
The liposome/OMC nanosystem was not hydrolyzed from R. miehei by lipase. In the biodistribution assay, the liposome/OMC formulation labeled with technetium-99m had mainly deposited in the skin, while for OMC the main organ was the liver, showing that the liposome had higher affinity for the skin than OMC. The liposome/OMC formulation was classified as nonirritating in the HET-CAM test, indicating good histocompatibility. The formulation containing liposome/OMC had a higher in vivo solar photoprotection factor, but did not show increased water resistance. Inclusion in liposomes was able to slow down the release of OMC from the formulation, with a lower steady-state flux (3.9 ± 0.33 μg/cm2/hour) compared with the conventional formulation (6.3 ± 1.21 μg/cm2/hour). The stripping method showed increased uptake of OMC in the stratum corneum, giving an amount of 22.64 ± 7.55 μg/cm2 of OMC, which was higher than the amount found for the conventional formulation (14.57 ± 2.30 μg/cm2).
Conclusion
These results indicate that liposomes are superior carriers for OMC, and confer greater safety and efficacy to sunscreen formulations.
Keywords: sunscreen, liposome, tape stripping, technetium-99-m, lipase
Introduction
Photoprotection is the main way of preventing damage caused by solar radiation, ie, erythema, aging, and skin cancer. Nonmelanoma skin cancer is the most common tumor type in Brazil.1 Currently, 2–3 million nonmelanoma skin cancers and 132,000 melanoma skin cancers occur globally each year. One in every three cancers diagnosed worldwide is a skin cancer, according to Skin Cancer Foundation statistics.2 Antisolar preparations contain sunscreens that absorb, reflect, or scatter ultraviolet radiation from sunlight. For more photostable formulations, with a high sun protection factor (SPF) and providing broad spectrum ultraviolet radiation protection, three or more sunscreen agents are used. These agents are generally lipophilic substances applied on a large area of the body. Therefore, systemic absorption is a factor to be considered.3–7
The anti-ultraviolet B organic filter, octyl p-methoxycinnamate (OMC), first developed in the 1950s, has been one of the most widely used sunscreens, and its use in pharmaceutical and cosmetic formulations is allowed by, among other entities, the US Food and Drug Administration, the European Cosmetics, Toiletry, and Perfumery Association (COLIPA) and the Brazilian Agência Nacional de Vigilância Sanitária. Several studies have shown that OMC present in conventional formulations can be systemically absorbed after skin application, being found in the deeper layers of the stratum corneum as well as urine, plasma, and breast milk.8–11
The development of sunscreen formulations containing nanoparticulate systems is of great interest in the pharmaceutical and cosmetic industries because of the many potential benefits, such as tailoring the release profile, improving SPF and stability, and reducing side effects.12–14 The crucial factor in assessing skin preparations containing nanostructures is the risk of permeation through transdermal, mucosal, or follicular pathways. Thus, it is necessary to know more about the cutaneous permeation, enzymatic metabolism, and biodistribution of these nanostructured systems in order to evaluate their safety.15,16
Liposomes can be defined as the result of colloidal association of phospholipids, which are spontaneously organized in closed spherical vesicles consisting of one or more phospholipid bilayers that completely surround an aqueous inner compartment. Liposome vesicles enable the incorporation of both hydrophilic and lipophilic compounds.17,18
The aim of this work was to develop and evaluate a liposome/OMC nanosystem and a gel formulation containing it in order to obtain a sunscreen formulation with improved safety and efficacy by keeping the OMC on the stratum corneum for a longer period of time.
Materials and methods
Materials
The following materials were used to prepare the formulations: octyl p-methoxycinnamate, (Merck KGaA, Darmstadt, Germany); cholesterol, Tris(hydroxymethyl)aminomethane (Tris) buffer, and stannous chloride (SnCl2, Sigma-Aldrich, St Louis, MO, USA); phosphatidylcholine (Lipoid S 100®; Gerbras, Germany); high-pressure liquid chromatography-ultraviolet grade methanol and ethanol (Tedia Brazil, Rio de Janeiro, Brazil); Aristoflex® AVC (ammonium acryloyldimethyltaurate vinylpyrrolidone copolymer) and alpha-tocopherol (Pharma Nostra, Rio de Janeiro, Brazil); methylparaben (Fagron, São Paulo, Brazil); polysorbate 80 (Viafarma, Araraquara, Brazil); lipase from Rhizomucor miehei (Lipozyme®, Novo Nordisk Bioindustrial, Curitiba, Brazil); technetium 99 metastable (Na99mTcO4, Institute of Nuclear and Energy Research, São Paulo, Brazil); and sodium hydroxide, chloroform, hexane, and ethanol PA (Vetec Quimica Fina Ltda. Duque de Caxias, Brazil).
Formulation containing free OMC
In order to establish a comparison with the liposome/OMC formulation, a gel formulation containing 8% free OMC was prepared. The formulation components and their concentrations are reported in Table 1. Methylparaben was solubilized in hot water, after which Aristoflex was slowly added to the water with vigorous mixing. The polysorbate 80 was then added, and finally OMC was incorporated into the formulation.
Table 1.
Composition of formulations containing free OMC and liposome/OMC
| Composition | Free OMC | Liposome/OMC |
|---|---|---|
| Phase A | ||
| Aristoflex®AVC | 3% w/w | 3% w/w |
| Methylparaben | 0.1% w/w | 0.1% w/w |
| Distilled water | qsp 100 mL | qs 100 mL |
| Phase B | ||
| OMC | 8% w/w | 5.5% w/w |
| Polysorbate 80 | 1% w/w | – |
| Liposome/OMC | – | 50 mL =2.5 g OMC |
Abbreviations: OMC, octyl methoxycinnamate; AVC, ammonium acryloyldimethyltaurate vinylpyrrolidone copolymerv; qs, quantity sufficient.
Formulation containing liposome/OMC
The liposomal OMC preparation was obtained by a thin lipid film hydration method. A lipid film was formed in a round-bottom flask by evaporation (R-114 rotary evaporator, Büchi, Essen, Germany) of a mixture of 10.5 g of Lipoid S 100, 1.55 g of cholesterol, 3.6 g of OMC, and 0.1 g of alpha-tocopherol in 20 mL of chloroform. Next, 50 mL of Tris buffer (pH 6.8) was added to detach the thin film deposited in the flask, by mixing it in a vortex (Marconi, Piracicaba, São Paulo, Brazil) for 15 minutes. Sequential extrusion through a 0.4 μm polycarbonate membrane (Nuclepore®, Whatman Inc., Piscataway, NJ, USA) under nitrogen pressure was carried out to homogenize the vesicle size.19 The nanostructured liposome/OMC system produced was characterized (Figure 1). To visualize the liposomes under an electron transmission microscope at 80 kV (Morgagni 268, FEI, Hillsboro, OR, USA), samples of the liposome/OMC formulation and empty liposomes were diluted with a 25% ethanol solution, stained with saturated uranyl acetate solution, and dried before microscopy. Images were captured using a Megaview G2 digital camera (Olympus, Tokyo, Japan). Incorporation efficiency was the ratio between the mass of OMC and the mass of OMC added to the liposome preparation measured by a ultraviolet-visible spectrophotometer (V630, Jasco, Tokyo, Japan).19,20 The particle size distribution, polydispersity index (PI), and zeta potential were obtained using a particle size analyzer (Zetasizer® Nano Z, Malvern Instruments, Malvern, UK).
Figure 1.
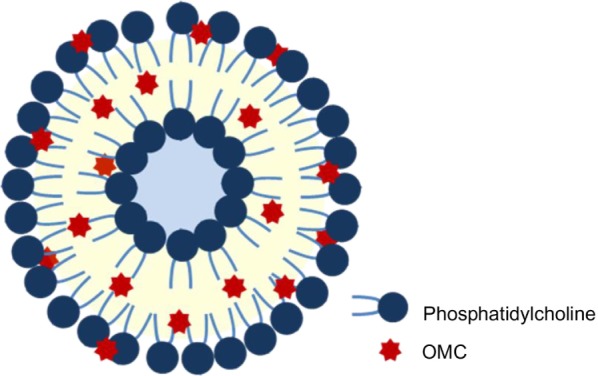
Schematic structure of the liposome containing OMC.
Abbreviation: OMC, octyl methoxycinnamate.
The liposome/OMC nanosystem was mixed with OMC and the mixture was incorporated into the gel base without using polysorbate 80. Two assays were performed with the nanostructured liposome/OMC formulation obtained, ie, enzymatic hydrolysis with lipase from R. miehei and biodistribution of the liposome/OMC formulation labeled with technetium-99 m. The formulations containing liposome/OMC and free OMC with a final concentration of 8% (Table 1) were tested for ocular irritability using the hen’s egg test-chorio-allantoic membrane (HET-CAM) assay, in vitro and in vivo SPF, release profile, skin biometrics, and tape stripping.
Enzymatic hydrolysis assay
These assays were conducted with the three substrates (OMC, empty liposomes, and liposome/OMC) to establish a comparison. For the lipophilic OMC (dissolved in hexane), a biphasic reaction medium composed of 20 mL of OMC in hexane solution (2 mg/mL) and 25 mL of Tris-HCl buffer 0.05 M (pH 8.0) was used. For the liposomes, 45 mL of the Tris-HCl buffer liposome solution (2 mg of liposome/mL) was used. Pretitration of the reaction mixtures with NaOH 0.025 N was carried out until pH 8 was reached. The reactions were then started by adding 5 mL of lipase (1:40,000 Tris buffer solution). A pH of 8.5 was kept constant by addition of NaOH 0.025 N using an automatic titrator (Titrando 905, Herisau, Metrohm, Switzerland). The hydrolysis rates of the substrates were obtained and compared.21
Biodistribution of liposome/OMC formulation labeled with technetium-99m
The ethics review board and animal ethics committee of Clementino Fraga Filho University Hospital (Radiopharmacy) associated with the Federal University of Rio de Janeiro (Rio de Janeiro, Brazil) approved the study protocol.
Technetium-99m labeling was used to mark any lipophilic material present in the samples with Na99mTcO4 by complexation. Three sample formulations were tested, ie, OMC, empty liposomes, and liposome/OMC. Labeling was carried out using 150 μL of each sample incubated with the same volume of SnCl2 solution (80 μL/mL) for 20 minutes at room temperature. These solutions were then incubated with 100 μCi (≈300 μL) of technetium-99 m for a further ten minutes to label their structures. Thin-layer chromatography was carried out using Whatman paper Number 1 (Maidstone, UK) and acetone as mobile phase to confirm correct labeling of the samples. The labeling procedure aimed to label OMC and the liposome structures (both empty liposomes and liposome/OMC).
Biodistribution studies were done using two Wistar rats for each sample. First, 1 cm2 areas of dorsal rat skin were trichotomized, and after 24 hours, 0.2 mL of the labeled samples (3.7 MBq) was administered to the skin. Counts were acquired for 5 minutes in a 15% window centered at 140 KeV. The mice were euthanized after 30 minutes and the organs were removed. The organs were weighed and radioactivity uptake was counted in a Cobra II gamma counter (Perkin-Elmer, Waltham, MA, USA). The results were expressed as a percentage of the doses administered per gram of tissue.22
HET-CAM testing for irritant potential of formulations
Chicken embryos have been used widely to give information on ocular irritant potential as an alternative to in vivo testing. This test is a borderline case between in vivo and in vitro systems and avoids problems in maintaining ethical and legal standards, especially with regard to animal protection laws.23 The HET-CAM test can be used as a screening method to reduce the number of animals tested, to limit or eliminate pain and injury during animal experiments, and to allow regulatory authorities to establish priority and toxicity categories. It has also been expanded to include the chorio-allantoic membrane (CAM) test as a mucous membrane irritation test.24
Only fresh fertile eggs weighing 50–60 g can be used in this test. The eggs were placed in an automatically rotating incubator and kept at a temperature of 37.5°C ± 0.5°C and relative humidity of 62.5% ± 7.5%. At day 10, the embryos were ready to be used in the test.23
With the aid of a saw, the egg shell around the air chamber was removed. The inner membrane was exposed and moistened using 0.9% saline solution at 37°C. Afterwards, it was possible to remove the inner membrane with the aid of tweezers, exposing the CAM. Visual analysis was done to verify if there were any conditions in the vascular system of the CAM that made the egg unsuitable for testing.23
Next 300 μL of each tested formulation was placed on the CAM surface. After 20 seconds, the formulation was washed with saline solution until completely removed. The egg was then observed under a magnifying glass for 5 minutes to determine if there were any irritant effects occurring within the CAM blood vessels (ie, hyperemia, hemorrhage, or coagulation). The procedure was repeated using four different eggs for each formulation.23
The irritant effects were scored (1, 3, 5, 7, or 9) according to the time that they occurred (less than 30 seconds, 30–60 seconds, or 60–300 seconds). The irritation level was considered according to the average score of the four eggs: 0.0–0.99 corresponds to nonirritating; 1.0–4.99 corresponds to slightly irritating; 5.0–8.99 corresponds to moderately irritating; and 9.0–21 corresponds to severely irritating.23
In vitro SPF determination
In vitro SPF values were determined according to the method described by Mansur et al,25 which was corroborated by Santos et al26 using similar experimental conditions. Absorbance values for each formulation were determined in triplicate at a final OMC concentration of 2 μL/mL in ethanol and an emission spectrum of 290–320 nm with intervals of 5 nm using an ultraviolet-visible spectrophotometer (Jasco V630).
The SPF determination, equation (1),25 and the correlation between the erythemogenic effect (EE) and the radiation intensity at each wavelength (EE × I) were adjusted according to Sayre et al:27
| (1) |
where the correction factor (CF) =10, EE (λ) is the erythemogenic effect of radiation on wavelength λ, I(λ) is the intensity of solar light with wavelength λ, and abs (λ) is the spectrophotometric absorbance value of a solution of the preparation at wavelength λ.
In vivo SPF
The SPF value is defined as the ratio between the ultraviolet energy required to produce a minimal erythemal dose or redness on protected skin and the ultraviolet energy required to produce a minimal erythemal dose on unprotected skin (equation 2).
| (2) |
The SPFs of the formulations were determined according to the COLIPA method.28–30
All studies were performed by Allergisa (Campinas, Brazil) according to Brazilian ethical protocols. Ten individuals aged 18–42 years with skin phototypes I, II or III were recruited as volunteers. The back of each volunteer was exposed to ultraviolet light using a multiport ultraviolet solar simulator Model 601 (Solar Light Company, Glenside, PA, USA). Volunteers were informed about the protocols, agreed to participate in the study, and gave their written consent.
On the first day, the volunteers’ backs were exposed to the ultraviolet simulator, and the exposure time was varied according to skin phototype. After about 20 hours, the minimal erythemal doses were observed for each volunteer. On the second day, the minimal erythemal doses without sunscreen were verified, and the tested sunscreen was then applied. The sunscreen samples and standard formulation were applied in 2 mg/cm2 amounts to an adjacent area of the same back of each volunteer. After application, the formulation was left for 15 minutes to dry before irradiation. Each test area was exposed to controlled amounts of simulated sunlight using a solar simulator with a continuous emission spectrum of 290–400 nm. A 5 × 6 cm area was irradiated at six points (diameter 1 cm) in a series of geometrically increasing doses. The standard formulation was a lotion with 7% octyl dimethyl para-aminobenzoic acid and 3% benzophenone-3. On the third day, the minimal erythemal doses of the sunscreens were again analyzed, and the SPF for the product was then calculated using the average of all the individual SPF values obtained for each volunteer.28,29
In vivo SPF determination after immersion
The SPF determined after immersion was carried out according to COLIPA with ten volunteers aged 18–42 years and skin phototypes I, II, or III, whose backs were exposed to ultraviolet light using the multiport ultraviolet solar simulator Model 601.28
The in vivo SPF after immersion was determined only for the liposome/OMC formulation. The free OMC formulation was an aqueous gel, and is already known not to be water-resistant. The objective of this test was to evaluate whether the liposome/OMC nanosystem was able to increase the water resistance of the formulation.
Water resistance was determined by evaluation of the volunteers after two cycles of 20-minute immersion intervals, with moderate activity in water at 29°C, each followed by a 20-minute rest/air dry period until the total water exposure time was reached. The test areas were air-dried without towels at the end of the final water immersion period.28–30
In vitro release studies
A vertical diffusion system with an artificial cellulose acetate membrane (27 mm diameter, 43 mm thickness, and 0.2 μm pore size, Sigma-Aldrich) was used. This membrane had previously been hydrated and placed between the two compartments (donor and receptor). The diffusion area was 5.73 cm2, and the receptor compartment consisted of 20 mL. The receptor solution consisted of 70% phosphate buffer (pH 7.4) containing 0.2% polysorbate 80 and 30% ethanol. The diffusion system was prepared, and the absence of bubbles between the membrane and the receptor solution was confirmed. The receptor compartment was kept under stirring with a magnetic bar at 900 rpm and at room temperature between 22°C and 25°C. After 30 minutes of stabilization, approximately 1 g of the formulation was added to the donor compartment and therefore the diffusion occurred under the condition of a infinite amount of active. Afterwards, 3.0 mL of the receptor solution was withdrawn, with volume replacement every 30 minutes for a total time of 180 minutes.19,31
Four determinations were made for each sample. Quantitative determination of OMC in the receptor fluid was done by ultraviolet spectrometry (Jasco V630). The values for steady-state flux diffusion were calculated for each of the six test units of the two formulations by linear regression analysis from 60 minutes onwards, considering that balance was achieved from this point.
In vivo skin biometrics and tape stripping
Skin biometrics and tape stripping were conducted after approval of the research protocol by the ethics committee of Clementino Fraga Filho University Hospital. Ten healthy female volunteers aged 22–60 years, without skin diseases or skin lesions, and with no history of OMC allergy were selected. The volunteers were informed about the protocols, agreed to participate in the study, and gave their written consent. They were not allowed to use cosmetics on their forearms in the 24 hours before the study.
Skin biometrics
Skin biometrics is a noninvasive method used to determine certain characteristics of skin for evaluation of skin barrier integrity.32,33 The volunteers washed their forearms with running water and neutral soap. After drying their forearms with a paper towel, the volunteers stayed for one hour in a room with a temperature of 22°C–23°C and relative humidity of 60%–65%. Afterwards, the degree of hydration, pH, and lipid content of both forearm skin surfaces were measured in triplicate using a combined unit comprising a Sebumeter® (SM 810), pHMeter® (pH 900), and Corneometer® (820 PC), from Courage Khazaka (Köln, Germany).
Tape stripping
On completion of skin biometrics, five areas measuring about 5 cm2 were delineated on the volunteers’ forearms (one as a control and four for testing the formulations). The formulation containing free OMC was applied on the right forearm and the liposome/OMC formulation was applied on the left forearm. The formulations were administered with the aid of a swab in an amount of approximately 10 mg. After defined periods of time (15, 60, 120, and 240 minutes), the formulations were removed with the aid of wet cotton. After drying the formulation area, 11 tape strips measuring 1 cm2 were sequentially applied to the skin and then quickly removed. The first tape was discarded, and the other ten were submitted to extraction with 90% ethanol. The OMC was then quantified from the extraction solution by high-performance liquid chromatography.34
High-performance liquid chromatography analysis
The concentration of OMC in the formulations and extraction solutions from tape stripping was determined by high-performance liquid chromatography. The chromatographic system consisted of a Gilson model 321 pump, a Gilson model 152 ultraviolet-visible detector, a Gilson model 831 temperature regulator, and a Rheodyne injector 7725i model (Shimadzu, Canby, OR, USA) with a 50 μL loop, a Gilson system interface module model 506C, and a Gilson Unipoint 3.0 software system controller (Gilson, Bedfordshire, UK).
The OMC was quantified using a chromatographic column (Kromasil 100 C18 reverse-phase, Sigma-Aldrich) 5 μm, 250 × 4.6 mm, operated at 40°C, eluted with a mobile phase consisting of a methanol to water ratio of 9:1 at a flow rate of 1.5 mL per minute, and detected by ultraviolet light at a wavelength of 310 nm. Quantification of the compound was performed by measuring the peak areas in relation to those of chromatography standards under the same conditions.35 The calibration curve was prepared with methanol solutions of OMC at concentrations ranging from 2 to 10 μg/mL. The standard curves were linear (r =0.999).35
Statistical analysis
Experimental data are presented as the mean ± standard deviation or standard error of the mean. The data were analyzed by paired and unpaired t-tests using Prism 6 for Windows software (free version 6.01, GraphPad, San Diego, CA, USA). P<0.05 was considered to be statistically significant.
Results
Liposome characterization
The liposomes showed multilayered and spherical vesicles with homogeneous morphology (Figure 2). The mean diameters of the liposome/OMC and empty liposome formulations (n=3) were, respectively, 982.00 ± 68.00 with a PI of 0.464 ± 0.050 and 483.20 ± 27.70 nm with a PI of 0.272 ± 0.033 (Table 2). The liposomes were stored in a refrigerator with a temperature range of 4°C–8°C. After 3 months, the mean empty liposome diameter was 621.93 ± 48.43 nm with a PI of 0.127 ± 0.021 and the mean liposome/OMC diameter was 1066 ± 32.66 nm with a PI of 0.545 ± 0.029. These data indicate a small increment in vesicle diameter over time. The PI indicates sample quality. PI values near 0.1 are associated with a monodispersed system, with a highly homogeneous population of particles, suggesting a monomodal size distribution. On the other hand, high PI values (near to 1.0) suggest a polymodal or a wide size distribution of particles.36 The results showed a PI <0.5, indicating that the vesicle population was homogeneous and monomodal. The liposome incorporation efficiency for OMC was 84.97 ± 2.02 (n=3). The zeta potentials of the liposome/OMC and empty liposome formulations (Table 2) were the same statistically (P<0.05), with values of −10.31 ± 0.58 and −11.27 ± 0.46, respectively.
Figure 2.
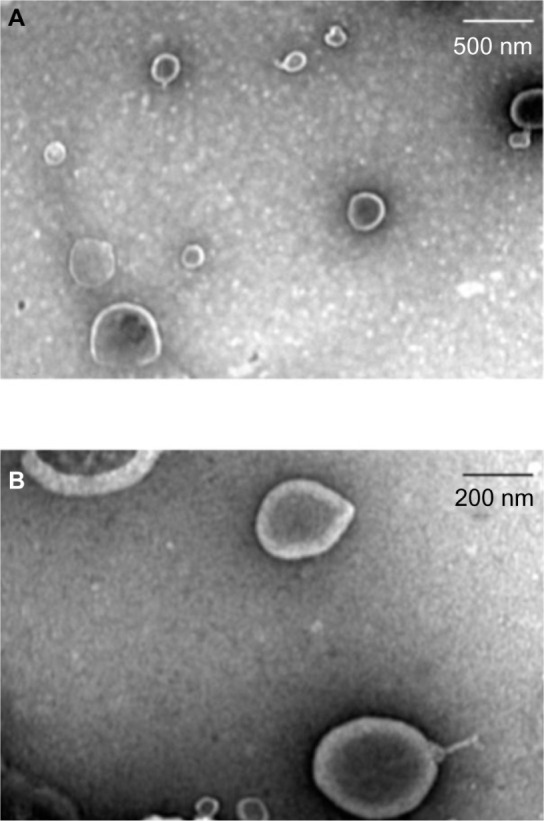
Electron transmission photomicrographs of empty liposome (A) and liposome/octyl methoxycinnamate (B).
Table 2.
Diameter, polydispersity index, and zeta potential of liposomes
| Sample | Diameter (nm) | PI | Zeta potential (mV) |
|---|---|---|---|
| Empty liposome | 483.20 ± 27.70 | 0.272 ± 0.033 | −11.27 ± 0.46 |
| Liposome/OMC | 982.00 ± 68.00 | 0.464 ± 0.050 | −10.31 ± 0.58 |
Note: Values are shown as the mean ± standard deviation.
Abbreviations: OMC, octyl methoxycinnamate; PI, polydispersity index.
Enzymatic hydrolysis assay
The aim of this test was to compare the hydrolysis rate of the OMC sunscreen agent with that of the liposome/OMC formulation to determine the skin metabolism of the two formulations. The hydrolysis rate of the OMC sunscreen under the experimental conditions used was 4.439 ± 0.028 μmol per minute. The other substrates tested, ie, the liposome/OMC and empty liposome formulations, were not hydrolyzed by lipase since the volume consumption of the blank samples was almost the same as that of the samples containing empty liposomes and liposome/OMC (0.096 mL and 0.19 mL, respectively).
Biodistribution of liposome/OMC labeled with technetium-99m
All the samples were successfully labeled (>90%). The use of acetone as mobile phase provided efficient separation from free technetium-99 m and the labeled formulations. These tests were performed with the empty liposomes, liposome/OMC, and free OMC to assess whether the liposome/OMC formulation is capable of forming a reservoir and being retained in the skin, since it is known that the OMC incorporated in conventional sunscreen formulations is able to cross the skin barrier and reach the systemic circulation.8–12,37 The results show that the empty liposomes and liposome/OMC formulation had similar biodistribution profiles. As shown in Figure 3, the main organ of OMC deposition was the liver, indicating that OMC is rapidly absorbed after application to the skin and undergoes hepatic metabolism. The second organ of deposition was the skin, while the amounts found in other tissues evaluated were not significant for OMC. Analyzing the bar graphs for the liposomes, it can be seen that the main organ of deposition for this nanosystem was the skin, suggesting that the empty liposomes and the liposome/OMC formulation have a higher affinity for this organ compared with free OMC, so remain on the skin for longer. The liposome samples showed some small deposition in the liver, which could be due to phospholipids or trapped OMC, but in lower amounts when compared with the OMC sample, suggesting that there was little systemic absorption of the liposomes or their components through the skin.
Figure 3.
Biodistribution of liposome/OMC labeled with technetium-99m. Values are shown as the mean ± standard deviation.
Abbreviation: OMC, octyl methoxycinnamate.
HET-CAM test for irritant potential of the formulations
The gel and liposome/OMC formulations had irritation scores of 0.45 and 0.25, respectively (Table 3), while the empty liposome and free OMC gel formulations had scores of zero. All test formulations had a final classification of “nonirritating” according to the HET-CAM test.
Table 3.
Score and classification of irritation obtained in the HET-CAM test
| Formulations | Irritation scores | Degree of irritation |
|---|---|---|
| Gel base | 0.45 | Nonirritant |
| Free OMC gel | 0 | Nonirritant |
| Empty liposome | 0 | Nonirritant |
| Liposome/OMC | 0.25 | Nonirritant |
Abbreviations: HET-CAM, hen’s egg test-chorio-allantoic membrane; OMC, octyl methoxycinnamate.
In vitro SPF determination
The liposome/OMC and free OMC formulations had SPF values of 13.88 ± 0.07 and 13.98 ± 0.66, respectively. These in vitro SPF values were not significantly different between the formulations (unpaired t-test, P<0.05), as seen in Figure 3.
In vivo SPF before and after immersion
SPF determination in vivo showed a value of 7.0 ± 1.6 for the formulation containing free OMC, and a value of 11.5 ± 2.7 for the liposome/OMC formulation (Figure 4). Statistical analysis showed that the in vivo SPF values for the formulations were significantly different. Therefore, it can be concluded that the liposome/OMC was able to increase the SPF of the formulation. The SPF after immersion of the liposome/OMC formulation was 5.8 ± 1.4 (Figure 4). This value was significantly different from the SPF before immersion. Therefore, it can be concluded that the liposome/OMC formulation has low water resistance.
Figure 4.
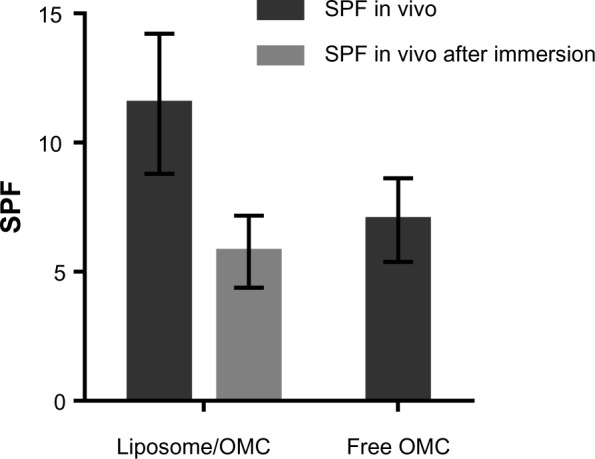
In vitro and in vivo SPF for the formulations containing liposome/OMC and free OMC. Values are shown as the mean ± standard deviation.
Abbreviations: OMC, octyl methoxycinnamate; SPF, sun protection factor.
In vitro release studies
The free OMC gel formulation showed a higher steady-state flux diffusion value of 6.3 ± 1.21 μg/cm2/hour, releasing higher amounts of filter to the receptor solution (24.06 ± 3.62 μg/cm2) at the end of 180 minutes (Figure 5). The higher standard error values indicate that there was greater variability between the six cells used.
Figure 5.
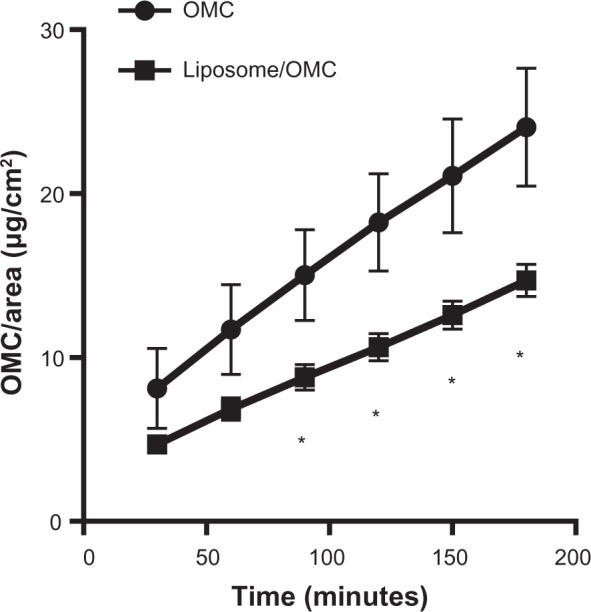
Release profile of OMC for formulations containing free OMC (•) and liposome/OMC (■). Values are shown as the mean ± standard error of the mean.*Statistically different points (P<0.05).
Abbreviation: OMC, octyl methoxycinnamate.
The liposome/OMC gel formulation had a steady-state flux diffusion value of 3.9 ± 0.33 μg/cm2/hour and released 14.70 ± 0.98 μg/cm2 of OMC after 180 minutes (Figure 5). This formulation showed a low standard deviation, indicating small variability between the six cells used. Statistical analysis showed that there was a significant difference between the steady-state flux diffusion values of the liposome/OMC and conventional gel formulations. The amounts of sunscreen released per area were significantly different from the 90-minute point (Figure 4), indicating that the two formulations release OMC in a different manner and that the liposome is able to modify OMC release.
In vivo skin biometrics
The lipid content of the forearms was zero in all cases. The degree of hydration of the skin was below 80 AU in all volunteers.32,33 For this reason, all were classified as having dry skin.
The pH of the skin showed a large variation between volunteers, with the majority having higher pH values than the range reported in the literature, ie, 5.5–5.8.32,33 To investigate the results further, the volunteers were divided into two groups, ie, those with cutaneous pH ≤7.4 and those with cutaneous pH >7.4 (Figure 6). Applying the same reasoning to the degree of hydration, the volunteers were divided into those with skin hydration ≤35 AU and those with skin hydration >35 AU (Figure 7). These data were analyzed together with the amounts of OMC per area found in the stratum corneum in order to determine if different ranges of pH or degree of hydration influenced OMC uptake by the stratum corneum. Statistical analysis of the graphs for the free OMC formulation showed that there were no statistically significant differences between the amounts of OMC retained in the stratum corneum in skin with pH ≤7.4 and skin with pH >7.4. The same occurred with the hydration graphs, in that there were no statistically significant differences between the groups with hydration degrees ≤35 AU and >35 AU. The differences in pH and degree of hydration in volunteer skin did not significantly alter OMC uptake by the stratum corneum.
Figure 6.
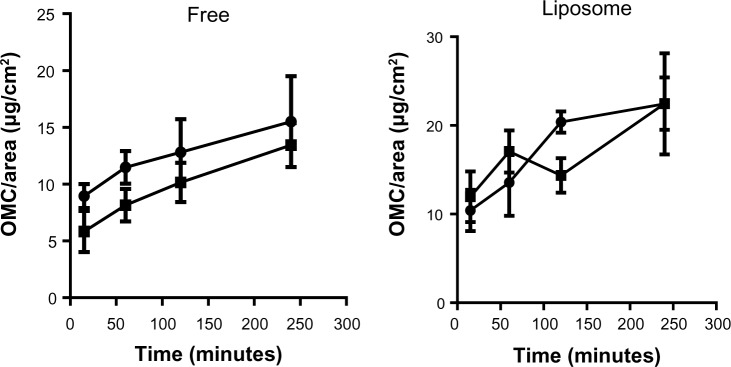
Amounts of OMC retained in the stratum corneum obtained using the tape stripping method when skin pH is up to 7.4 (•) or above 7.4 (■). Values are shown as the mean ± standard error of the mean.
Abbreviation: OMC, octyl methoxycinnamate.
Figure 7.
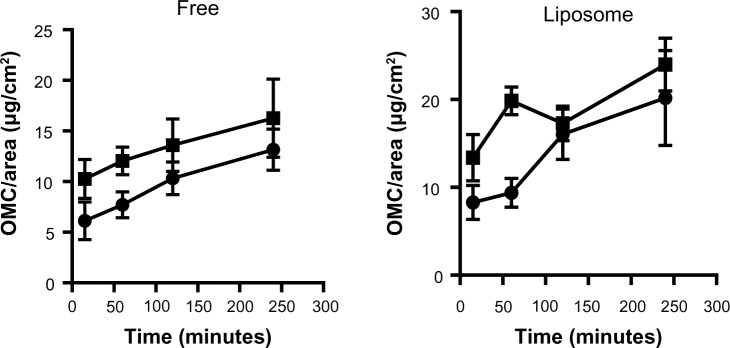
OMC amounts retained in the stratum corneum obtained using the tape stripping method when skin hydration is up to 35 (•) or above 35 (■). Values are shown as the mean ± standard error of the mean.
Abbreviation: OMC, octyl methoxycinnamate.
Tape stripping
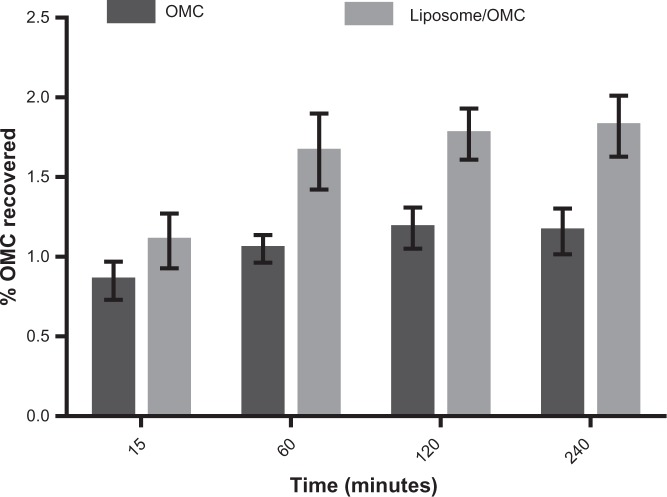
Based on the results shown in Figure 8, it can be seen that after 240 minutes the amount of OMC recovered per area in the total number of strips was 22.64 ± 7.55 μg/cm2 in the stratum corneum of forearms treated with the liposome/OMC formulation and 14.57 ± 2.30 μg/cm2 in those treated with the free OMC formulation. The formulations were significantly different at 60, 120, and 240 minutes (Figure 8). OMC uptake by the stratum corneum was higher after treatment with the liposome/OMC formulation compared with conventional free OMC. Figure 9 shows the percentage amount of OMC recovered in the total number of strips removed after different durations of application. The results are the mean values for the ten volunteers at each time point. After 4 hours, the percentage of the initial dose recovered from the ten tape strips did not exceed 2%. However, the liposomes showed a higher percentage recovery than the conventional formulation.
Figure 8.
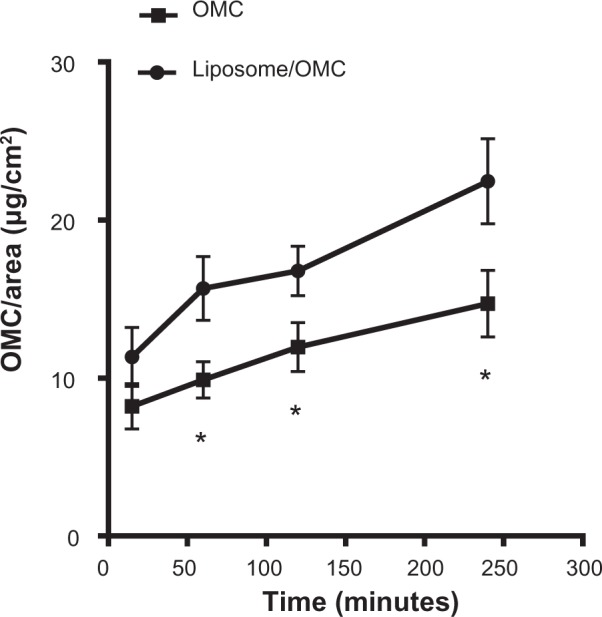
Amounts of OMC per area obtained after application of the free OMC formulation (■) and the liposome/OMC formulation (•) using the tape stripping method. Values are shown the mean ± standard error of the mean. *Statistically different points (P<0.05).
Abbreviation: OMC, octyl methoxycinnamate.
Figure 9.
Percentage of OMC recovered in the ten strips removed after 15, 60, 120, and 240 minutes from ten volunteers. Values are shown as the mean ± standard error of the mean for ten volunteers.
Abbreviation: OMC, octyl methoxycinnamate.
Discussion
Characterization of liposome/OMC formulation
Liposome/OMC vesicles were successfully prepared by the thin film hydration method. After preparation, physicochemical characterization showed that the liposome/OMC formulation had a greater mean diameter and PI compared with the empty liposomes. This probably happened because OMC makes the liposome more unstable, causing coalescence of vesicles, thus increasing the mean diameter and PI of the liposome/OMC formulation. The OMC sunscreen agent demonstrated high encapsulation efficiency when incorporated into the phosphatidylcholine liposome, which was expected since OMC is a lipophilic compound and remains mixed in the phospholipid bilayer formed.38
Although there were no charged components in the liposome vesicle, the liposomes had negative zeta potential values. This is due to the phosphate group present in the polar head of phosphatidylcholine, which is directed towards the outside of the vesicle. This direction is probably due to the low ionic strength of the liposomal suspension. The fact that liposomes are negatively charged is important, because the repulsion of charges increases stability and prevents coalescence of vesicles. However, this low negative charge is not enough to keep them stable for long.12,39,40
Enzymatic hydrolysis assay
The liposome/OMC formulation was not hydrolyzed by lipase in the enzymatic hydrolysis assay. This was probably due to the arrangement of phosphatidylcholine in the liposome bilayer. The phosphatidylcholine fatty acid moieties are turned towards the inner side of the vesicles, preventing enzymatic hydrolysis of the ester groups. Therefore, it can be concluded that the liposome is capable of protecting the filter against the lipase enzymatic degradation caused by lipases present in the stratum corneum, thereby increasing the residence time of the vesicle on the skin.39,34
Biodistribution of liposome/OMC labeled with technetium-m99
The technetium-labeled liposomes showed higher affinity for the skin than the ultraviolet-filtered OMC, confirming that OMC can be systemically absorbed after application to the skin, and demonstrating the potential of liposomes to form a reservoir on the skin while minimizing systemic absorption of OMC.
In vitro and in vivo SPF
The in vitro SPF values for the formulations tested were not significantly different. This may be because of the limitations of the spectrophotometric method in assessing the interactions of the formulations with the skin. This result is based on the total concentration of the ultraviolet filter in the formulations. The in vitro SPF test is rapid and cost-effective, and can estimate the SPF of formulations prior to in vivo SPF tests in humans.25,26
Inclusion of OMC in liposomes increased the in vivo SPF values for the formulation. However, the SPF decreased after immersion, indicating that the liposome/OMC formulation had low water resistance. This is probably because the liposome/OMC is embedded in a totally aqueous gel formulation. The liposome itself did not provide the formulation with water resistance.
HET-CAM test
As expected, the liposome formulation was deemed nonirritating to the mucous membranes, since the components of the liposome vesicles are substances present in skin phospholipids and cholesterol. The vehicle gel and free OMC formulations were also considered nonirritating to the mucous membranes. This test is important given that photoprotective formulations can be applied to the face, so may reach the eyes and mouth.
In vitro release studies
The release profile for the liposome/OMC formulation was significantly different from that of the conventional free OMC formulation. The amounts of sunscreen transferred per area were different from the 90-minute point onwards, showing that the liposome is able to modify OMC release from the gel formulation. The liposome probably alters the thermodynamic activity of the formulation, ie, slowing down diffusion of OMC to the receptor fluid. The liposome provides a lipophilic environment for OMC, which hinders diffusion to the receptor solution. This does not occur with the formulation containing free OMC because it is totally hydrophilic.37,41
Skin biometrics and tape stripping
Skin biometrics showed that the differences in pH and hydration of the volunteers’ forearm surfaces did not significantly influence (P<0.05) uptake of OMC by the stratum corneum. This result is important because pH and hydration of the stratum corneum can modify skin barrier properties, giving different OMC uptake results.42
Penetration of these two formulations containing OMC (liposome and conventional) into the skin was investigated by tape stripping, a technique that allows removal of the stratum corneum and quantification of drugs and cosmetic active ingredients on the skin surface.42,43 The results demonstrated that higher amounts of OMC per area were recovered from the strips for the liposome/OMC formulations (Figure 8) and the percentage of OMC in relation to the dose applied was higher for the liposome/OMC formulation in comparison with the conventional free OMC formulation. The liposome/OMC formulation may mix with intercellular lipids and cause them to swell without altering the multiple bilayer structure of the stratum corneum, producing an extra lipid barrier in the skin, given that intercellular lipids are important in controlling percutaneous absorption.44 Our results are similar to those reported by Monteiro et al,19 whose work demonstrated that larger amounts of OMC were found on pig ear epidermis following application of a liposomal formulation containing OMC. In their work, approximately 56% of the liposomal OMC applied remained in the epidermis and only 29% passed to the dermis. Thus, the liposome can provide a modified-release carrier system and act as a reservoir for OMC, causing OMC to remain for longer in the upper layers of the stratum corneum, increasing SPF, diminishing enzymatic degradation of OMC by epidermal metabolism, and avoiding systemic absorption. These results strongly indicate that liposomes are superior carriers for OMC as a sunscreen due to their higher retention in the stratum corneum, their ability to minimize penetration into the deeper skin layers, and their ability to provide a higher in vivo SPF value.
Conclusion
Liposomes prepared by the thin film hydration method could be a better carrier for OMC, an anti-ultraviolet B filter, compared with conventional free OMC formulations, because it has a higher SPF, no irritation potential, an ability to resist lipase enzymatic degradation, and a capacity to modify OMC release and form a reservoir, thus remaining in greater amounts in the stratum corneum and minimizing systemic absorption of OMC. The liposome/OMC formulation is therefore a better vehicle for OMC than conventional formulations.
Footnotes
Disclosure
The authors report no conflicts of interest in this work.
References
- 1.Inca.gov.br. [National Insitute of Cancer Estimation 2012] Instituto Nacional do Câncer. Estimativa 2012. Brazil: [Accessed April 15, 2012]. Available from: http://www1.inca.gov.br/estimativa/2012/ [Google Scholar]
- 2.World Health Organization Ultraviolet radiation and the Intersun Program. Skin Cancer. How common is skin cancer? [Accessed April 15, 2012]. Available from: http://www.who.int/uv/faq/skincancer/
- 3.Gonzalez S, Fernandez-Lorenti M, Gilberte-Calzada Y. The latest on skin photoprotection. Clin Dermatol. 2008;26:614–626. doi: 10.1016/j.clindermatol.2007.09.010. [DOI] [PubMed] [Google Scholar]
- 4.Gammer AO, Leibold E, Van Ravenzwaay B. The in vitro absorption of microfine zinc oxide and titanium dioxide through porcine skin. Toxicol In Vitro. 2006;20:301–307. doi: 10.1016/j.tiv.2005.08.008. [DOI] [PubMed] [Google Scholar]
- 5.Schulz J, Hohenberg H, Pflücker F, et al. Distribution of sunscreen on skin. Adv Drug Deliv Rev. 2002;54(Suppl 1):S157–S163. doi: 10.1016/s0169-409x(02)00120-5. [DOI] [PubMed] [Google Scholar]
- 6.González S, Fernández-Lorente M, Gilberte-Calzada Y. The latest on skin photoprotection. Clin Dermatol. 2008;26:614–626. doi: 10.1016/j.clindermatol.2007.09.010. [DOI] [PubMed] [Google Scholar]
- 7.Gilaberte Y, González S. Update on photoprotection. Actas Dermosifiliogr. 2010;101:659–672. [PubMed] [Google Scholar]
- 8.Hayden CG, Roberts MS, Benson HA. Systemic absorption of sunscreen after topical application. Lancet. 1997;350:863–864. doi: 10.1016/S0140-6736(05)62032-6. [DOI] [PubMed] [Google Scholar]
- 9.Sarveiya VP, Risk S, Benson HA. Skin penetration and systemic absorption of sunscreens after topical application. J Am Acad Dermatol. 2004;50(Suppl 3):P75. [Google Scholar]
- 10.Gonzalez HG, Farbrot A, Larkö O. Percutaneous absorption of benzophenone-3, a common component of topical sunscreens. Clin Exp Dermatol. 2002;27:691–694. doi: 10.1046/j.1365-2230.2002.01095.x. [DOI] [PubMed] [Google Scholar]
- 11.Janjua NR, Kongshoj B, Andersson AM, Wulf HC. Sunscreens in human plasma and urine after repeated whole-body topical application. J Eur Acad Dermatol Venereol. 2008;22:456–461. doi: 10.1111/j.1468-3083.2007.02492.x. [DOI] [PubMed] [Google Scholar]
- 12.Gillet A, Compère P, Lecomte F, et al. Liposome surface charge influence on skin penetration behavior. Int J Pharm. 2011;411:223–231. doi: 10.1016/j.ijpharm.2011.03.049. [DOI] [PubMed] [Google Scholar]
- 13.Jain SK, Jain NK. Multiparticulate carriers for sun-screening agents. Int J Cosmet Sci. 2010;32:89–98. doi: 10.1111/j.1468-2494.2010.00547.x. [DOI] [PubMed] [Google Scholar]
- 14.Detoni CB, Paese K, Beck RCR, Pohlmann AR, Guterres SS. Nanosized and nanoencapsulated sunscreens. In: Beck R, Guterres S, Pohlmann A, editors. Nanocosmetics and Nanomedicines: New Approaches for Skin Care. Berlin, Germany: Springer; 2011. [Google Scholar]
- 15.Fronza T, Guterres SS, Pohlmann AR, Teixeira HF. Nanocosméticos. Em Direção ao Estabelecimento de Marcos Regulatórios. Porto Alegre, Brazil: Gráfica da UFRGS; 2007. [Google Scholar]
- 16.Nohynek GJ, Antignac E, Re T, Toutain H. Safety assessment of personal care products/cosmetics and their ingredients. Toxicol Appl Pharmacol. 2010;243:239–259. doi: 10.1016/j.taap.2009.12.001. [DOI] [PubMed] [Google Scholar]
- 17.Santos NC, Castanho MARB. [Liposomes: has the magic bullet hit the target?] Lipossomas: a bala mágica acertou? Quim Nova. 2002;25(6B):1181–1185. [Google Scholar]
- 18.Ramon E, Alonso C, Coderch L, et al. Liposomes as alternative vehicles for sun filter formulations. Drug Deliv. 2005;12:83–88. doi: 10.1080/10717540490446080. [DOI] [PubMed] [Google Scholar]
- 19.Monteiro MS, Ozzetti RA, Vergnanini AL, et al. Evaluation of octyl-methoxycinnamate included in liposomes and cyclodextrins in anti-solar preparations: preparations, characterizations and in vitro penetration studies. Int J Nanomedicine. 2012;7:3045–3058. doi: 10.2147/IJN.S28550. [DOI] [PMC free article] [PubMed] [Google Scholar]
- 20.Bartlett GR. Phosphorus assay in column chromatography. J Biol Chem. 1959;234:466–468. [PubMed] [Google Scholar]
- 21.de Freitas ZM, dos Santos EP, da Rocha JF, Dellamora-Ortiz GM, Gonçalves JC. A new sunscreen of the cinnamate class: synthesis and enzimatic hydrolisis evaluation of glyceryl esters of p-methoxycinnamic acid. Eur J Pharm Sci. 2005;25:67–72. doi: 10.1016/j.ejps.2005.01.018. [DOI] [PubMed] [Google Scholar]
- 22.Sa LT, Albernaz Mde S, Patricio BF, et al. Biodistribution of nanoparticles: initial considerations. J Pharm Biomed Anal. 2012;70:602–604. doi: 10.1016/j.jpba.2012.06.008. [DOI] [PubMed] [Google Scholar]
- 23.Luepke NP. Hen’s egg chorioallantoic membrane test for irritation potential. Food Chem Toxicol. 1995;23:287–291. doi: 10.1016/0278-6915(85)90030-4. [DOI] [PubMed] [Google Scholar]
- 24.Lagarto A, Vega R, Guerra I, González R. In vitro quantitative determination of ophthalmic irritancy by the chorioallantoic membrane test with trypan blue staining as alternative to eye irritation test. Toxocol In Vitro. 2006;56:718–728. doi: 10.1016/j.tiv.2005.10.003. [DOI] [PubMed] [Google Scholar]
- 25.Mansur JS, Breder MN, Mansur MC, Azulay RD. [Determination of sun protection factor by specrophotometry] Determinação do fator de proteção solar por espectrofotometria. An Bras Dermatol. 1986;61:121–124. [Google Scholar]
- 26.Santos EP, Freitas ZM, Souza KR, Garcia S, Vergnanini A. In vitro and in vivo determinations of sun protection factors of sunscreen lotions with octylmethoxycinnamate. Int J Cosmet Sci. 1999;21:1–5. doi: 10.1046/j.1467-2494.1999.181658.x. [DOI] [PubMed] [Google Scholar]
- 27.Sayre RM, Agin PP, LeVee GJ, Marlowe E. Comparison of in vivo and in vitro testing of sunscreening formulas. Photochem Photobiol. 1979;29:559–566. doi: 10.1111/j.1751-1097.1979.tb07090.x. [DOI] [PubMed] [Google Scholar]
- 28.Colipa.com Europe: The European Cosmetic, Toiletry and Perfumery Association. International sun protection factor (SPF) test method. 2006. [Accessed June 24, 2010]. Available from: www.colipa.com.
- 29.Ruvolo Júnior EC. [Sun protection: Comparison of human trial determination methods (in vivo)] Proteção solar: comparação dos métodos de determinação por testes em humanos (in vivo), FDA, COLIPA, SAA. Cosmetics On Line. 1997;19(105):37–46. [Google Scholar]
- 30.Shaath NA. The Encyclopedia of Ultraviolet Filters. Chicago, IL: Allured Publishing Corporation; 2007. [Google Scholar]
- 31.Santis AK, de Freitas ZM, Ricci-Junior E, de Brito-Gitirana L, Fonseca LB, Santos EP. Nifedipine in semi-solid formulations for topical use in peripheral vascular disease: preparation, characterization, and permeation assay. Drug Dev Ind Pharm. 2013;39:1098–1106. doi: 10.3109/03639045.2012.711833. [DOI] [PubMed] [Google Scholar]
- 32.Serup J, Jemec EBG. Handbook of Non-invasive Methods and the Skin. 1st ed. Boca Raton, FL: CRC Press; 1995. [Google Scholar]
- 33.Gaspar LR, Gonçalves GMS, Pereira LHTR, Maia Campos PMBG. [Application and standardization of noninvasive techniques for evaluation of efficacy]. Aplicação e padronização de metodologias não invasivas para avaliação de eficácia. Cosmet Toilet. 2001;13:68–73. [Google Scholar]
- 34.Freitas ZM. 154f. Tese de Doutorado em Fármaco e Medicamentos – Faculdade de Ciências Farmacêuticas. Universidade de São Paulo; São Paulo: 2005. Dermatological biopharmaceutical evaluation of semisolid formulations of ketoconazole]. Avaliação biofarmacotécnica de formulações dermatológicas semissólidas de cetoconazol. [Google Scholar]
- 35.Mota ACV, Volpato NM, Freitas ZMF, Santos EP. [In vitro release study of sunscreen p-octylmethoxycinnamate included in liposomes and β-cyclodextrin]. Estudo de liberação in vitro do filtro solar p-metoxicinamato de octila incluso em lipossoma e β-ciclodextrina. Rev Ciênc Farm Básica e Apl. 2008;29:285–289. [Google Scholar]
- 36.Gaumet M, Vargas A, Gurny R, Delie F. Nanoparticles for drug delivery: the need for precision in reporting particle size parameters. Eur J Pharm Biopharm. 2008;69:1–9. doi: 10.1016/j.ejpb.2007.08.001. [DOI] [PubMed] [Google Scholar]
- 37.Bouwstra JA, Honeywell-Nguyen PL. Skin structure and mode of action of vesicles. Adv Drug Deliv Rev. 2002;54(Suppl 1):S41–S55. doi: 10.1016/s0169-409x(02)00114-x. [DOI] [PubMed] [Google Scholar]
- 38.Egbaria K, Weiner N. Liposomes as a topical delivery system. Adv Drug Deliv Rev. 1990;5:287–300. [Google Scholar]
- 39.Jones MN. Surface properties and interactions of vesicles. Curr Opin Colloid Interface Sci. 1996;1:91–100. [Google Scholar]
- 40.Vemuri S, Rhodes CT. Preparation and characterization of liposomes as delivery systems: a review. Pharm Acta Helv. 1995;70:95–111. doi: 10.1016/0031-6865(95)00010-7. [DOI] [PubMed] [Google Scholar]
- 41.El Maghraby GM, Barry BW, Williams AC. Liposomes and skin: from drug delivery to model membranes. Eur J Pharm Sci. 2008;34:203–222. doi: 10.1016/j.ejps.2008.05.002. [DOI] [PubMed] [Google Scholar]
- 42.Darlenski R, Sassning S, Tsankov N, Fluhr JW. Non-invasive in vivo methods for investigation of the skin barrier physical properties. Eur J Pharm Biopharm. 2009;72:295–303. doi: 10.1016/j.ejpb.2008.11.013. [DOI] [PubMed] [Google Scholar]
- 43.Shah VP, Bon C, Kaplan SA, et al. Bioequivalence of topical dermatological dosage forms – methods of evaluation of bioequivalence. Pharm Res. 1998;15:167–171. doi: 10.1023/a:1011941929495. [DOI] [PubMed] [Google Scholar]
- 44.Verma DD, Verma S, Blume G, Fahr A. Particle size of liposomes influences dermal delivery of substances into skin. Int J Pharm. 2003;258:141–151. doi: 10.1016/s0378-5173(03)00183-2. [DOI] [PubMed] [Google Scholar]


