Abstract
The review will describe experiments inspired by the rich variety of bundles and networks of interacting microtubules (MT), neurofilaments, and filamentous-actin in neurons where the nature of the interactions, structures, and structure-function correlations remain poorly understood. We describe how three-dimensional (3D) MT bundles and 2D MT bundles may assemble, in cell free systems in the presence of counter-ions, revealing structures not predicted by polyelectrolyte theories. Interestingly, experiments reveal that the neuronal protein tau, an abundant MT-associated-protein in axons, modulates the MT diameter providing insight for the control of geometric parameters in bio-nanotechnology. In another set of experiments we describe lipid-protein-nanotubes, and lipid nano-tubes and rods, resulting from membrane shape evolution processes involving protein templates and curvature stabilizing lipids. Similar membrane shape changes, occurring in cells for the purpose of specific functions, are induced by interactions between membranes and proteins. The biological materials systems described have applications in bio-nanotechnology.
Keywords: Microtubules, Neuronal Proteins, Block Liposomes, X-ray Scattering, Cryo-TEM
1. Introduction
An important objective in biological materials research and biophysics is to clarify the nature of interactions between biological molecules, which are responsible for large-scale structures observed in living systems. This would lead to a more rational design of synthetic building-block mimics, where the hierarchical structures arise from the built-in functionality at the molecular level controlling intermolecular interactions. Indeed, nature often assembles molecules into large structures through competing interactions. The biomimetic structures, in turn, may have important technological applications, for example, as templates for miniaturized materials for applications in nanotechnology.[1–7]
The experiments described in this review have a theme of learning from, and building upon, the many illuminating examples of “out-of-equilibrium” assembly occurring in nature. Indeed in this proteomics era there is additional emphasis in understanding the nature of assembling forces between cellular proteins and associated biomolecules leading to supramolecular structures, with the ultimate goal of relating structure to function. We emphasize that while assembly occurs far from equilibrium in living cells (i.e. typically consuming the energy of hydrolysis), many cell free experiments (including those described in this review), conducted at or near equilibrium under physiological buffer and salt conditions, result in self-assembled structures, where the average structure is often similar to those occurring in vivo. Examples include lipid self-assembly [8,9] and neurofilaments [10–13] reconstituted in vitro, which mimic in vivo structures. [14–17] Thus, structures from living systems remain an invaluable source of information even for equilibrium studies.
There remain of course important differences between equilibrium and nonequilibrium structures, for example, living eukaryotic cell membranes maintain lipid asymmetry in their outer and inner leaflets through the action of enzymes consuming energy, [17] while equilibrium membranes of mixed lipids usually (but not always) possess symmetric bilayer composition. [8,9] Similarly, the average structure of bundles of filamentous (F)-actin, [9,18–26] and bundles and networks of neuronal microtubules, [27–30] which are assembled from their monomeric units (G-actin and tubulun) in the presence of a finite amount of ATP or GTP, but then stabilized with phallodin or taxol respectively, are often found to have average structures mimicking those found in living systems. [14–17,31–33] However, we expect important differences between the two systems, for example, in the distribution of filament lengths or protofilament number in the case of microtubules.
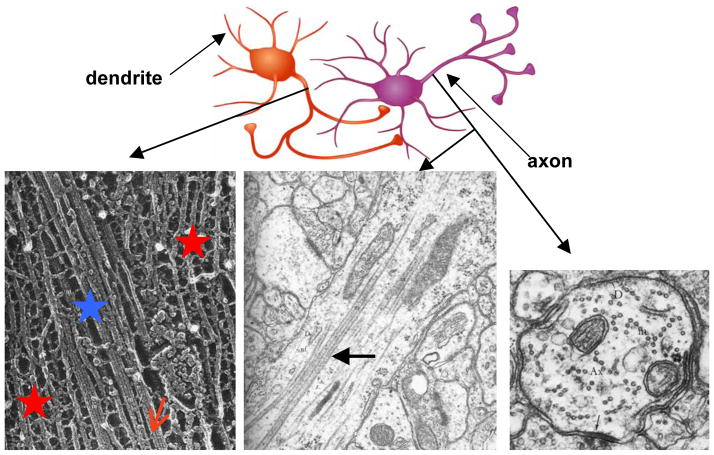
Cell interiors provide sophisticated examples of assembly with unprecedented control over distinct shapes and sizes over multiple length scales (i.e. hierarchical) from the nanometer to the micron scales. Figure 1 displays electron micrographs, which show distinct cytoskeleton structures within the axons of neurons, from microfilament networks to bundles of microtubules (MTs). These structures serve as an inspiration to elucidate and mimic, in synthetic systems, intermolecular interactions leading to distinct assembled structures. The high-magnification micrograph (Fig. 1, bottom left) shows a section near the initial axon segment comprised of a bundle of MTs (blue star), embedded within a neurofilament network (red stars). MT bundles are thought to be stabilized by microtubule-associated-proteins (MAPs), [33,15] which non-covalently cross-link neighboring MTs through mostly non-specific electrostatic interactions (Fig. 1, bottom left, red arrow points to a MAP). The bundles are important in imparting mechanical stability to axons in mature neurons. Furthermore, dynamical MT bundles are a critical component in the development and extension of axons in developing neurons. [31,32] A lower-magnification view of the initial axon segment from rat cerebral cortex shows that MTs may form loosely organized two-dimensional (2D) sheet-like bundles (Fig. 1, bottom middle and right). [14] This is in stark contrast to filamentous actin bundles of the cell cytoskeleton, which often form highly ordered 3D bundles with actin-binding proteins both in cells[17,34] and in vitro. [20–22]
Figure 1.
Top: Cartoon of two interacting nerve cells. The axon of the cell on the left is forming synaptic junctions with the cell body and dendrite of the cell on the right. Bottom Left: High resolution EM (quick freeze, deep etch; by N. Hirokawa) of a frog spinal nerve axon (x 400,000) shows a microtubule (MT) bundle (blue star) embedded within the NF network (red stars), where microtubule-associated proteins (MAPs) (red arrow points to one MAP) appear to cross-link neighboring MTs. Reprinted with permission from [33]. Bottom Middle and Right: Lower magnification electron micrographs of the initial axon segment from the cerebral cortex of an adult rat. The middle panel (x 75,000) shows a typical bundle of microtubules (MTs) (large arrow). The right panel is a transverse cut (x 90,000) revealing the “bead-on-a-string” two-dimensional (2D) bundle structure of the MTs. The diameter of a MT is 25 nm. Reprinted in part by permission of Oxford University Press, Inc. from pages 107 and 185 of [14].
In the axons of neurons, MAP-tau is believed to be responsible for bundling MTs. [33] However, there is no evidence as to whether MAP-tau directs MT assembly into loose 2D bundles. The current model is that in neuronal axons, different isoforms of MAP tau enhance tubulin assembly and regulate MT dynamics. [17,34–39] It is further known that tau has a key role in the establishment of neuronal cell polarity, [40] and the outgrowth and maintenance of neuronal axons. [37, 41] (MAP tau has attracted much attention world-wide because aberrant tau behavior invariably leads to neurodegenerative diseases, including Alzheimer’s, Pick’s, supra-nuclear palsy, and fronto-temporal dementia with Parkinsonism linked to chromosome 17 (FTDP-17). [42,43]) In its biologically active state, MAP-tau is known to be an unstructured (random coil) polyampholyte (i.e., a charged biopolymer containing both positive and negative charges). This is consistent with recent experiments, which have revealed that the binding of MAP-tau to the MT surface is primarily electrostatic in nature. [44] As we describe below, previous studies on MTs in the presence of simple counter-ions [27] indicate that competing attractive and repulsive interactions at different length scales may mediate distinct MT bundled states, including tight 3D and loose 2D bundles qualitatively similar to what is observed in neurons.
The review is organized as follows. First, we describe experiments on the development of distinct microtubule assembled structures through a subtle competition between counter-ion induced short-range attractions and longer-ranged repulsions (whose origins are described below). This will be followed by a brief review of recent studies of the effect of MAP tau on the assembly structure of MTs. In contrast to the MT ordering induced by counter-ions, tau isoforms do not bundle taxol-stabilized MTs in the physiological tau concentration regime suggesting the presence of a kinetic barrier. MAP tau is found to modify the diameter of MTs thus suggesting strategies to control nanotubule geometric parameters important in biomaterials applications. The review will then turn to two sets of experiments, describing alternative pathways of producing lipid nanotubes through dynamical membrane shape evolution processes. One pathway involves the use of MTs as a protein templates while the other explores the properties of curvature stabilizing lipids on membrane shape dynamics leading to stable block liposome formation (with the blocks consisting of nanometer scale spheres, tubes, or rods). Both pathways mimic out-of-equilibrium membrane shape changes in cells mediated by protein-membrane interactions. The lipid-protein nanotubes and block liposomes have potential applications in templating, metallization to produce nanowires, or chemical delivery. The structures described are derived from synchrotron small angle x-ray scattering, electron microscopy including cryogenic transmission electron microscopy, and optical imaging.
2. Hierarchical Assembly Inspired by Nature: Competing Interactions and Counter-Ion Induced Assembly of Microtubules in Sheet-Like 2D and Tight 3D Bundles
Microtubules are hollow nanometer scale tubules consisting of dimeric α/β-tubulin subunits. Tubulin subunits align end-to-end to form linear protofilaments, which interact laterally in stabilizing the tubular wall (Fig. 2). MTs are rigid charged polymers with inner and outer diameters of ≈ 15 nm and ≈ 25 nm, a persistence length between 2 mm and 6 mm, and an overall negative charge of −41.5 e/tubulin dimer. [45] They are involved in a range of cell functions, including as tracks for intracellular trafficking and segregation of chromosomes during mitosis. [16,17,34]
Figure 2.
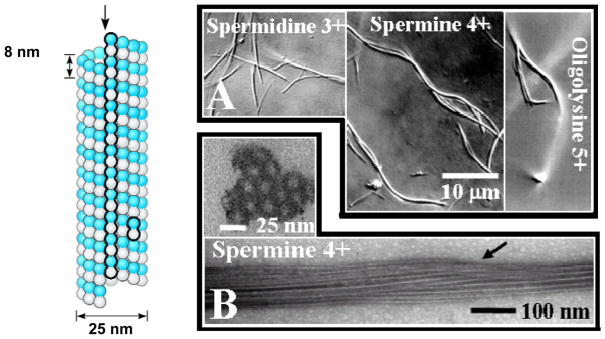
Microtubule (MT) bundling by 3+, 4+, and 5+ counter-ions. A schematic of a MT with a protofilament and a dimeric tubulin subunit outlined is shown to the left (redrawn from [16]). (A) Differential-interference-contrast (DIC) optical micrographs of MTs bundled by counter-ions with valence 3+ (spermidine), 4+ (spermine), and 5+ (penta-lysine). (B) Plastic-embedded TEM cross-section and whole-mount TEM side-view (bottom) of tight 3D MT bundles formed in the presence of 10 mM spermine (4+). The MTs were stabilized by taxol (1/1 taxol/tubulin dimer mole ratio). DIC and TEM images reprinted with permission from [27]. © 2004 National Academy of Sciences, U.S.A..
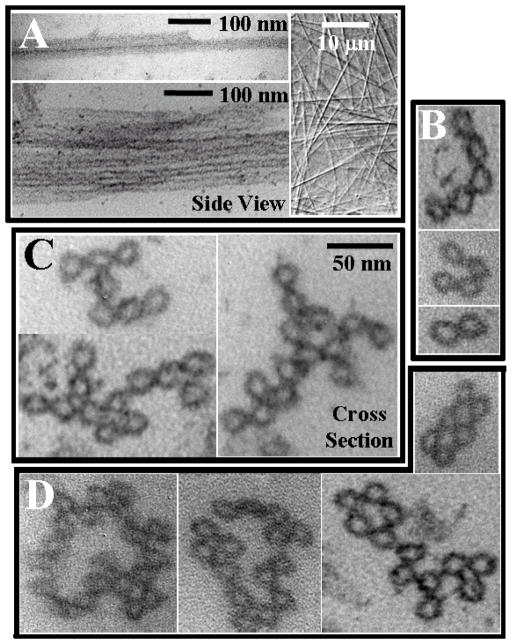
In previous experiments it was found that tri-, tetra-, and pentavalent cationic counter-ions induce the formation of tight 3D MT bundles. [27] Figure 2(A) shows differential-interference-contrast (DIC) optical micrographs, displaying MT-bundles with counter-ions spermidine (3+), spermine (4+), and oligolysine (5+). Figure 2(B) displays TEM cross-sections and side views of MTs bundled with spermine (4+) on the nanometer scale. It is clear that MT bundles are in a highly close-packed geometry. Tight 3D bundles are also observed with the other cations with charge Q equal to or more than +3e (spermidine (3+), and (lysine)n, n = 3,4,5). [27] In contrast, when MTs are bundled with divalent smaller counter-ions (Q = +2e), an entirely new bundle architecture is formed. DIC micrographs (with resolution on the submicron scale) again show the presence of bundles (Fig. 3A, right micrograph). However, TEM cross-sections, with nanometer scale resolution, reveal a much looser local structural arrangement for the MTs within sheet-like 2D bundles (Fig. 3B–D) where the bundles may be linear (B, showing bundles of 2, 4, and 5 MTs), branched (C), or even forming loops (D). TEMs in Fig. 3A (left two micrographs) show the sideview of MTs bundled with divalents where a MT dimer and a very loose bundle with several MTs are evident.
Figure 3.
Microtubule (MT) bundling by divalent counter-ions. (A) Left: Whole-mount TEM side-view showing a MT dimer (top) and a bundle with several MTs organized in a loose configuration (bottom). Right: Differential-interference-contrast (DIC) optical micrograph of divalent induced MT bundles. (B–D) Plastic-embedded TEM cross-sections of loose 2D MT bundles formed by divalent counterions (100 mM BaCl2) revealing (B) linear, (C) branched, and (D) loop morphologies. The MTs were stabilized by taxol (1/1 taxol/tubulin dimer mole ratio). Reprinted with permission from [27]. © 2004 National Academy of Sciences, U.S.A..
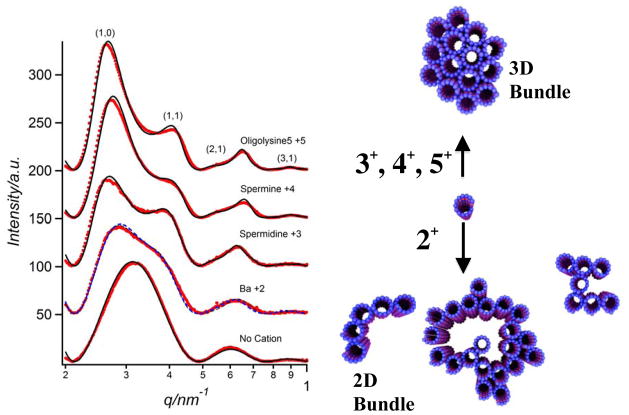
Synchrotron small-angle-x-ray scattering (SAXS) data of MT bundles are consistent with the electron microscopy data. Figure 4 (Left) shows SAXS profiles of MTs with no cation (bottom), in the presence of small divalent cations (Ba2+), and the more highly charged counter-ions, trivalent spermidine (3+), tetravalent spermine (4+), and pentavalent (lysine)5 (5+), above their critical bundling concentrations of 60 mM, 7.5 mM, 1.5 mM, and 0.75 mM, respectively. The SAXS profile with no added cation fits to the square of the x-ray form factor |F|2 of non-interacting MTs (solid line), modeled as a hollow cylinder with outer diameter 25.4 nm and wall thickness 4.9 nm. This is consistent with previous measurements for MTs comprised of 13 protofilaments. [45] In the presence of cations with valence 3+, 4+, and 5+, the profiles show well-defined peaks, which index precisely onto a hexagonal lattice (i.e., MTs form a tight 3D bundle consistent with TEM data, Fig. 2B). The data fit a Lorentzian-squared line-shape = a/(w2 +|q−G|2)2 for the structure factor (solid lines in profiles 3+, 4+, 5+ of Fig. 4 are the product of |F|2 and the structure factor). [27] For each sample, a single width w fits all peaks simultaneously and provides a quantitative measure of the bundle size L = (23/2π1/2)/w using Warren’s approximation. [46] The bundle size is found to increase from about 8 MTs for Z = 3+ to 14 MTs for Z = 5+, which is qualitatively evident from the sharpening of the SAXS peaks (Fig. 4, Left).
Figure 4.
(Left) Synchrotron SAXS profiles (background subtracted) of microtubules (MTs) with no added cation (bottom profile) and bundled MTs in the presence of cationic counter-ions with increasing charge: 115 mM BaCl2 (2+), 15 mM spermidine (3+), 5 mM spermine (4+), and 5 mM (lysine)5 (5+). For cations 5+, 4+, and 3+, the data index to hexagonal bundles consistent with EM data shown in Fig. 2B. Dots are data after background subtraction and solid lines are a model fit to the data as described in the text. For 2+ divalent cations, the SAXS data fits to a dimer of MTs. As described in the text, this is consistent with the EM data of Fig. 3 showing that MT bundles are loosely organized with only near neighbor correlations. MTs were stabilized by taxol (1/1 taxol/tubulin dimer mole ratio). (Right) Cartoon showing that divalent counterions induce loose 2D MT bundles while counterions with larger valence (3+, 4+, 5+) induce tight 3D bundles. Reprinted with permission from [27]. © 2004 National Academy of Sciences, U.S.A..
In contrast to the sharp peaks of the hexagonal bundles of MTs, the SAXS profile for MTs mixed with divalent cations (Fig. 4, Left, 2+) is broader and fits to the same line-shape with a domain size of a dimer of MTs. This is consistent with the TEM images of the 2D bundle phase (Fig. 3), which show loosely arranged, locally 2D bundles with short-range near-neighbor positional correlations (i.e., of the order of a dimer). Thus, as summarized schematically in Fig. 4 (Right), in the presence of counter-ions with charge Q ≥ +3e, MTs form tight 3D bundles with hexagonal symmetry, whereas counter-ions with charge Q = +2e lead to the formation of an unexpected sheet-like 2D bundle morphology.
Recent low temperature simulations and theories predict that bound counter-ions on adjacent polyelectrolytes (like MTs) develop positional correlations (i.e. a 1D Wigner lattice), resulting in a short-range salt-bridge-like exponentially decaying attractive force between neighboring polyelectrolytes, with strength and range increasing as Z2 and Z, respectively. [47–49] Thus, one expects the presence of a non-uniform cloud of multivalent counter-ions in the vicinity of the surface of MTs, to result in attractive interactions, which may overwhelm the electrostatic repulsions at short distances and lead to bundles. However, to our knowledge, current theories predict counter-ion-induced tight 3D bundles, while 2D bundles, which are observed in neurons (Fig. 1, bottom, middle and right micrographs) and in model experiments with divalent counterions (Fig. 3), have so far not been observed in either computer simulations or predicted in analytical models of polyelectrolytes.
The precise nature of the forces resulting in MT bundling in the two systems described above are clearly different: one due to multivalent counter-ions in vitro (Figs. 2, 3, 4) and the other due to a MAP (generally assumed to be MAP-tau) in neurons (Fig. 1). Nevertheless, as we describe below, competing interactions may indeed lead, in both cases, to either a tight 3D bundle or the unexpected 2D bundle state.
Figure 5 illustrates how one may begin to understand the formation of distinct MT bundled states as resulting from a competition between attractive and repulsive interactions. When short-range attractions (SRA) are dominant over longer-ranged repulsions (LRR), then pathway (i) is followed. In this pathway, a new MT (where the sand circles represent the MT cross section) will attach at the triangular position with more attractive contacts. Alternatively, if longer-ranged repulsions become competitive with short-range attractions (pathway (ii)), a linear arrangement is energetically more favorable as it represents a compromise between the interactions. In the linear arrangement, the new MT makes fewer contacts. This raises the adhesion energy but also lowers the repulsive component of the interaction energy, leading overall to a more favorable (lower) energetic configuration compared to the triangle configuration. For MTs, pathways (i) and (ii) ultimately lead to 3D and 2D bundles, respectively.
Figure 5.
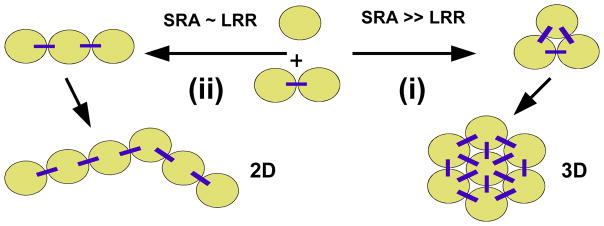
Schematic showing how competing short-range attraction (SRA) and longer-ranged repulsion (LRR) between MTs (shown in cross section as sand circles) may lead to either 3D (pathway (i), with SRA ≫ LRR) or 2D (pathway (ii), with SRA ≈ LRR) bundled states as described in the text.
As described above, the source of the short-range attractive interactions that lead to bundling of the anionic MTs is the presence of the multivalent counter-ions, which induce short-range salt-bridge-like attractions. [47–49] Because under physiological salt conditions (≈ 150 mM monovalent salt) the Debye screening length ≈ 8 Å is very short, the source of the longer-ranged repulsion cannot be electrostatic repulsions between the overall negative charged MTs. The longer-ranged repulsion between MTs most likely results from steric repulsions due to the unstructured, highly negatively charged (−11e) 22 residues of the C-terminal tail of the tubulin subunits. [50] A lower bound estimate for the size of each oligomeric repulsive chain on the MT surface is ≈ 2RG ≈ 25 Å, where the radius of gyration RG = 1.9*(22)3/5Å is taken from an experimentally determined universal curve for unstructured proteins in physiological salt conditions. [51] Thus, in the presence of repulsions due to tubulin’s protruding unstructured C-terminal tails, the transition from 2D to 3D bundles (Figs. 4, 5) may occur as a result of the increase in the relative strength of the attractive interactions between MTs as the charge of the counter-ion is increased from +2e to equal or larger than +3e, thereby increasing attractions between MTs.
3. Microtubule-Associated-Protein Tau Regulates the Number of Protofilaments in Microtubules
As we described earlier (Fig. 1), MAP-tau has been implicated in inducing MT bundles in neuronal axons. [14,15,33] However, the role of tau in inducing bundles in cell-free systems is less clear. Indeed, recently published SAXS studies of taxol-stabilized MTs showed no evidence of tau-induced microtubule bundling for tau/tubulin-dimer molar ratios (Φ) as large as Φ = 0.5. [44] Instead, upon binding to MTs, tau is found to modulate the diameter of MTs by increasing the MT protofilament number <Npf> (i.e. the average number of protofilaments in MTs) with increasing tau density.
The cationic MT binding domains of MAP tau isoforms are comprised of either 3 or 4 imperfect repeats of 18 amino acids (labeled 3R- or 4R-), and inter-repeat sections of 13–14 amino acids, resulting from exclusion or inclusion of exon 10-encoded sequences (Fig. 6, Left, colored rectangles depict the imperfect repeats). [50] The repeat region is flanked by a proline-rich basic region and the C-terminal tail. The six MAP tau isoforms consist of either 3R- or 4R-tau with 0, 1, or 2 N-terminal inserts resulting from exclusion or inclusion of exon 2 and 3-encoded sequences, thus giving rise to short (S-), medium (M-) and long (L-) N-terminal projection domains.
Figure 6.
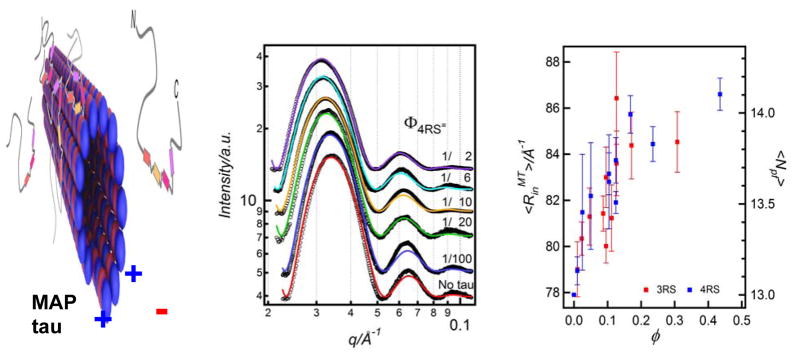
The binding of tau to MTs leads to an increase in the average MT inner radius through a redistribution of the number of protofilaments. Left: A schematic showing the binding of microtubule-associated-protein (MAP)-tau to taxol-stabilized microtubules (MTs). MAP tau contains C-terminal MT binding domains (colored rectangles) and a N-terminal projection domain with a dipole-like charge distribution. Middle: Synchrotron SAXS results of MTs with bound 4RS MAP-tau (one of six isoforms) as a function of MAP-tau to tubulin-dimer molar ratio in the reaction mixture (Φ). With increasing MAP-tau, the SAXS profiles shift to lower q, implying an increase in the MT radius. Colored lines are results of fits of the data to a model consisting of a hollow MT nanotube with the inner radius <RinMT> being the sole fitting parameter. Right: The inner radius <RinMT> for two tau isoforms (4RS and 3RS) plotted versus φ, the tau/tubulin-dimer molar ratio for the tau fraction bound to the MT surface. The radial size of MTs increases as a function of increasing tau. The figure also shows the corresponding increase in the MT protofilament number with increasing φ as described in the text. Reprinted with permission from [44]. © 2009 Biophysical Society.
Synchrotron small angle x-ray scattering (SAXS) was used to quantitatively study the assembly structure of taxol-stabilized microtubules in the presence of the six human MAP-tau isoforms (Fig. 6, Middle). [44] Most notably, SAXS data shows that MAP-tau regulates the distribution of protofilament numbers in MTs, as reflected in the observed increase in the average radius <RinMT> of MTs with increasing Φ (the tau to tubulin-dimer molar ratio in the reaction mixture) (Fig. 6, Right). Significantly, <RinMT> was observed to rapidly increase for 0 < φ < 0.2 and saturate for φ between 0.2 and 0.5, where φ denotes the tau/tubulin-dimer molar ratio for the tau fraction bound to the MT surface (measured through quantitative binding assays).[44]
Fig. 6 (Right) also plots the corresponding increase in protofilament number with increasing <RinMT>. In the absence of tau (φ =0) the fit of the SAXS data to the MT form factor consisting of a hollow nanotube yields <RinMT> = 77.9 Å with a wall thickness of 49 Å. [44] This is consistent with 13 protofilaments making up the MT from the literature values of the width and thickness of the protofilaments (i.e. looking down on the 13 protofilaments making up the MT wall). With the addition of tau the data shows an increase in <RinMT> from 77.9 Å to a value, which saturates near 86 Å. Thus, the radius of the nanotube measured from the center of the MT to the middle of the MT wall increases from ≈ 102.4 Å (= 77.9 Å + 24.5 Å) to a saturated value of 110.5 Å (= 86 Å + 24.5 Å) with added tau. We assume that the width of tubulin measured at the middle of the wall thickness does not change with added tau. This implies an increase in the MT radius (measured to the midpoint of the MT wall) by about 7.9%, which would correspond very closely to an increase in the average number of protofilaments <Npf> from 13 to 14 (as plotted in Fig. 6, Right).
The data provide strong evidence that even at tau coverages much less than a monolayer of the curved MT surface, a local shape distortion of the tubulin dimer, upon tau binding, is spread collectively over many dimers, perturbing the shape of the entire MT. The findings imply that MAP-tau regulates the shape of protofilaments and thus the spontaneous curvature of microtubules. The lack of tau-induced bundling for taxol-stabilized MTs suggests the presence of a kinetic barrier preventing the access of the regime where MAP tau-induced short-range attractions would dominate. Further studies are clearly needed to identify the parameters, which control the barrier height preventing MT bundling. Nevertheless, the observed results are quite interesting and provide insight into the regulation of the elastic properties of MTs by MAP-tau, and impact biological materials applications requiring nanotubes of controlled radial size.
4. The Development of Lipid Based Nanometer Scale Tubules
The microtubule structures described above are model systems for understanding hierarchical self-assembly of nanotubes and methods of modulating interactions to achieve various discrete shapes and morphologies (e.g. 3D bundles versus 2D bundles). However, for the purpose of developing biomaterials with real world applications lipid nanotubes have certain advantages. Indeed lipid tubules are increasingly explored for applications in chemical and drug delivery and as templates for processing metal nanotububes for electronic and magnetic materials applications. [52] Significantly, lipids are far more stable than protein nanotubes, which are susceptible to denaturation even at moderately elevated temperatures. As we describe below the experiments described in the next two sections are again inspired in part by lipid shape evolution and nanotube formation in living systems.
Lipid assemblies play an important role in cellular processes, including compartmentalization, macromolecular transport, and signal and energy transduction. [8,9,17,34] The evolution in the shapes of membranes is often a required feature enabling their cellular function. Indeed, much effort has been expended to elucidate membrane shapes in the context of their interactions with membrane-associated, curvature generating and stabilizing proteins. Among the better studied membrane curvature-generating proteins are those from the dynamin superfamily, which participate in a broad range of membrane shape remodeling events. [53–56] Examples of dynamin function include budding of clathrin-coated vesicles (CCVs), such as in receptor-mediated endocytosis and in inter-organelle trafficking (Fig. 7). In the process of budding of CCVs, the protein dynamin assembles into stacks of rings inducing the negative curvature region of the invaginated membrane vesicle and forcing dynamical bilayer shape changes, where a transient tubular neck formation, is followed by membrane fission in the presence of GTP hydrolysis. One may view the role of dynamin assembly into rings and spirals on membranes, both in vivo (Fig. 7, Left) and in vitro (Fig. 7, Right), as a highly dynamical curvature-generating protein template for membrane shape evolution.
Figure 7.
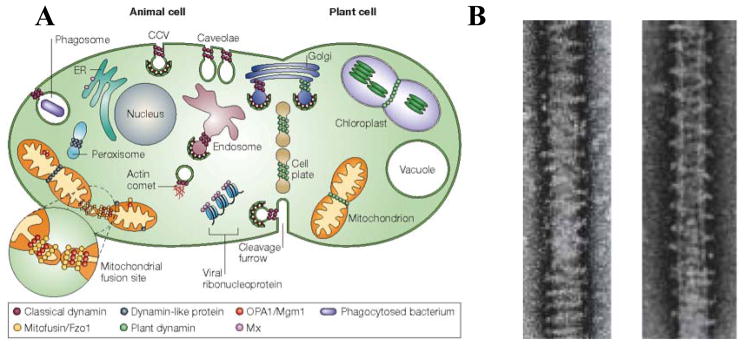
The role of the dynamin protein family (a family of membrane-associated proteins) in lipid bilayer shape evolution. (A) A schematic showing examples of how dynamin proteins (purple/green spheres) induce membrane shape changes in animal (purple spheres) and plant cells (green spheres) upon recruitment to specific membrane locations. The illustration shows stacked ring-like assemblies of dynamin proteins involved in shape evolution events, including in budding of clathrin coated vesicles (CCV) at the plasma membrane, endosomes, and Golgi organelles. Plant dynamin is shown to be involved in chloroplast division. Reprinted by permission from Macmillan Publishers Ltd: Nature Rev. Mol. Cell. Biol. (ref [54]), copyright 2004. (B) Cryo-TEM images showing that dynamin induces membrane tubulation upon binding to the outer membranes of anionic spherical vesicles in in vitro experiments. The left micrograph is in the presence of GDP and the right in the presence of GTP under slow hydrolysis. Fast GTP hydrolysis conditions lead to tubule fission. The liposomes, whose shapes have evolved from spheres to tubules, are coated by helical dynamin oligomers, which act as curvature-generating/stabilizing protein templates. Reprinted by permission from Macmillan Publishers Ltd: Nature Cell Biol. (ref [55]), copyright 1999.
Previous to the experiments described in the next two sections most research on bio-tubules had centered on lipid tubules with diameters of order microns. [52, 57–58] Here, we describe two distinct pathways to obtaining lipid tubules with diameter on the nanometer scale. In section 4.1 we describe experiments where such tubules are obtained by using MTs as a protein template, where lipid bilayers coat the MT surface. In section 4.2 we describe a second approach, which is based on the observation that the shape of a lipid molecule often determines the shape of the self-assembled structure. [8,9,59–61] In this approach one uses a curvature generating and stabilizing lipid to obtain nanometer scale tubules.
4.1. Lipid-Protein Nanotubes through the use of Protein Templates: The Interactions between Cationic Liposomes and Microtubules
In this section we describe experiments, which were designed to clarify the nature of membrane shape evolution in mixtures of microtubules and oppositely charged cationic liposomes (enclosed onion-like uni- and multi- lamellar membranes). It was found that under appropriate conditions one may spontaneously form lipid protein nanotubes (LPNs) where the microtubule, acting as a protein template, is coated by a lipid bilayer in the chain melted liquid state.[62,63] The majority of micron-sized lipid tubules described in the literature are for lipid bilayers in their chain ordered phase. [52,57,58] The LPNs described here may be viewed as among the very few examples of equilibrium lipid self-assembly leading to nanometer scale lipid-bilayer tubules.
We show in Figure 8 transmission electron microscopy (TEM) of bare taxol-stabilized microtubules (A and B) and a mixture of MTs and cationic liposomes (comprised of cationic 2,3-Dioleyloxypropyltrimethylammonium chloride (DOTAP) and neutral dioleoyl-sn-glycero-phosphatidylcholine (DOPC)) at MCL= 0.1 and R+/− = 120 (C). Here, R+/− = NCL/Nt is the molar ratio of cationic lipid to anionic tubulin (NCL and Nt are the numbers of cationic lipids and tubulin dimers respectively with R+/− = 40 near the iso-electric point of the complex), and MCL = NCL/(NL0 + NCL) is the mole fraction of cationic lipid (NL0 = number of neutral lipids). We see that the weakly positively charged vesicles are adsorbed onto the negatively charged MT wall, forming a vesicle-on-rod type structure (Fig. 8C, D).
Figure 8.
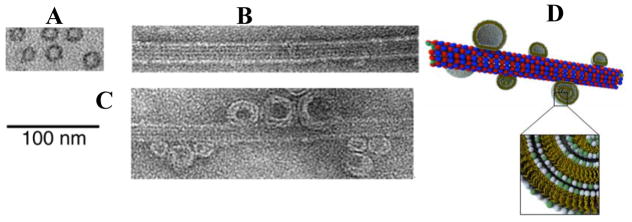
TEM images showing an isolated microtubule in cross section (A, plastic embedded), and in side view (B, protofilaments running parallel to the MT axis are visible). (C) A microtubule with adsorbed cationic liposomes is observed when the cationic lipid mole fraction MCL is < 0.1. (D) Schematics of cationic liposomes adsorbed onto the surface of a microtubule. TEM reprinted with permission from [62]. © 2005 National Academy of Sciences, U.S.A..
For higher membrane charge densities (MCL > 0.1) the lipids of the vesicles are observed to spread and coat (or wet) the microtubule, producing a lipid-protein nanotube (LPN) as seen by the TEM shown in Figure 9. At MCL = 0.5, the lipid coverage on the MT is observed to increase as R+/− increases from partial lipid coating (R+/− = 40, Figure 9B, the uncoated part of the MT is clearly visible) to full coverage with a further increase in R+/−= 80 in the excess cationic liposome regime where the LPN is positively charged (Figure 9, C). Most interestingly, Figure 9(D) shows an example of an LPN with closed ends with lipid caps at a higher membrane charge density (MCL = 0.8) for R+/− = 80. Thus, it is possible to switch between two states of nanotubes with either open ends, or closed ends with lipid caps, by controlling the cationic lipid/tubulin stoichiometry and the total amount of lipid (which controls the available membrane area).
Figure 9.

TEM images of the lipid protein nanotubes (LPNs) at different MCL (mole fraction of cationic lipid) and R+/− = NCL/Nt (the cationic lipid/tubulin stoichiometric ratio giving the overall charge of the LPN). R+/− = 40 is the iso-electric point. The LPN spontaneously forms when cationic liposomes with MCL > 0.1 are mixed with microtubules (MTs). (A) Cross-section of an LPN. (B, C) Side views of two LPNs with MCL = 0.5 and R+/− = 40, where the uncoated MT on the left side is visible (B), and MCL = 0.5 and R+/− = 80, where the MT is fully coated but the ends remain open (C). (D) Side view of an LPN with MCL = 0.8, R+/− = 80 where the LPNs exhibit closed ends consisting of lipid end-caps. The cationic lipid/tubulin stoichiometry and the total available membrane area controls the open/closed states of the LPN. TEM images reprinted in part with permission from [62]. © 2005 National Academy of Sciences, U.S.A.. (E) Schematics of lipid protein nanotubes (LPNs) with open (right) and closed ends with lipid caps (left) which form the basis for chemical encapsulation and release as described in the text. Reprinted in part with permission from [63]. © 2007 Biophysical Society.
The TEM images in figure 9 suggest that the LPN contains an outer third layer (compare the cross section view of the LPN in Figure 9(A) to the cross section of isolated MTs in Figure 8(A)). Small angle x-ray scattering (SAXS), which gives us a quantitative measure of the electron density profile along a transverse cut though the LPN wall, demonstrates that the MT is coated by a lipid bilayer (appears brighter in the images, as the ionic stain avoids the hydrophobic lipid tails), which in turn is partially coated by tubulin oligomers. [62,63] The oligomers appear to be forming rings or spirals around the lipid bilayer coating the MT (similar to the cationic dynamin rings around the cylindrical anionic membrane seen in Fig. 7B). This novel three-layer structure is shown in cartoons in Fig. 9E.
The new type of self-assembly, forming a MT-lipid-tubulin oligomer LPN, arises because the cationic lipid bilayer coating an MT produces a complex that typically is overall cationic because of a mismatch between the charge densities of microtubules and cationic lipid. The outer partial layer of tubulin oligomer (which is overall negative charged) coating the lipid bilayer tends to compensate for this charge density mismatch.
4.2. Block Liposomes comprised of Connected Nanometer Scale Tubes, Rods or Spheres: Curvature-Generating Lipids as Stimuli for Membrane Shape Evolution
As a final example of a novel biological materials system we describe the properties of block liposomes. [64] In recent experiments it was found that charged curvature-stabilizing lipids might have a profound influence on membrane shape evolution (mimicking the more complicated process occurring in cells via dynamin, a curvature-generating/stabilizing protein, described above (Fig. 7)). Block liposomes (BLs) were formed as a result of dynamical membrane shape changes in response to the addition of highly charged multivalent lipids (MVLBG2 (16+))[65] to spherical vesicles comprised of neutral lipid DOPC (Fig. 10).
Figure 10.

Left: Molecular models of the hexadecavalent dendritic lipid MVLBG2 and monovalent DOTAP, showing the highly conical shape of MVLBG2 and the cylindrical shape of DOPC. Right: Chemical structure of MVLBG2. The charged end groups (carboxyspermine, 4+) are highlighted in green, and the lipid tails in sand. Linking the charged groups to the tail are branching ornithine units (highlighted in blue).
Cryo-TEM revealed that block liposomes consist of distinctly shaped (yet connected) nanoscale spheres, tubes, or rods (Figs. 11 and 12). [64] Diblock (sphere-tube) and triblock (sphere-tube-sphere) liposomes contain nanotubes with inner lumen diameter in the 10–50 nm range (Fig. 11). Diblock (sphere-rod) liposomes were found to contain micellar nanorods ≈ 4 nm in diameter and several μm in length (Fig. 12). Wide-angle x-ray scattering confirmed that the lipid tails are in the chain-melted (liquid) state. [66,67] Thus, block liposomes exhibit microphase separation of liposome shapes (i.e. a single liposome comprised of distinct shapes) in strong contrast to commonly observed macroscopic phase separation of liposome shapes. [8]
Figure 11.
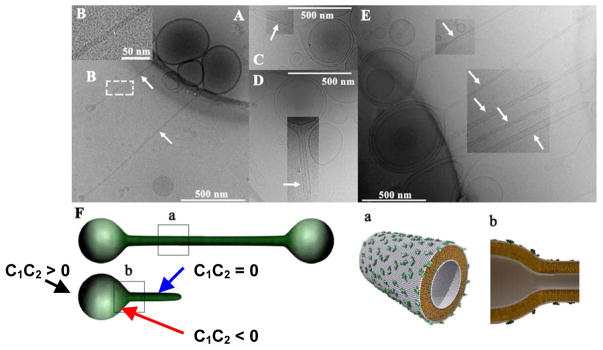
Cryo-TEM images of block liposomes containing lipid nanotubes (white arrows point to nanotubes). The block liposomes exist in a narrow composition range (8–10 mol% MVLBG2) of mixtures of the charged lipid MVLBG2 with spherical vesicles of neutral DOPC. A: Triblock liposomes (sphere-tube-sphere), B: an inset of A showing the hollow tubular structure. C: A diblock liposome (sphere-tube). D: One block liposome encapsulated within another one (also seen in E top arrow). E: A group of block liposomes. Block liposomes shown in A–E are comprised of liquid-phase lipid nanotube segments capped by spherical vesicles with diameters of a few hundred nm. The nanotubes (white arrows) are 10–50 nm in diameter and >1 μm in length. F: Schematics of tri- and diblock liposomes. The block liposomes shown here contain membranes with positive (black arrow C1C2 > 0), negative (red arrow C1C2 < 0), and zero (blue arrow C1C2 = 0) Gaussian curvature. Parts a and b show molecular-scale illustrations, depicting the symmetry breaking between outer and inner monolayer. In A–E, image contrast/brightness was altered in selected rectangular areas. Reprinted with permission from [64]. Copyright 2009 American Chemical Society.
Figure 12.
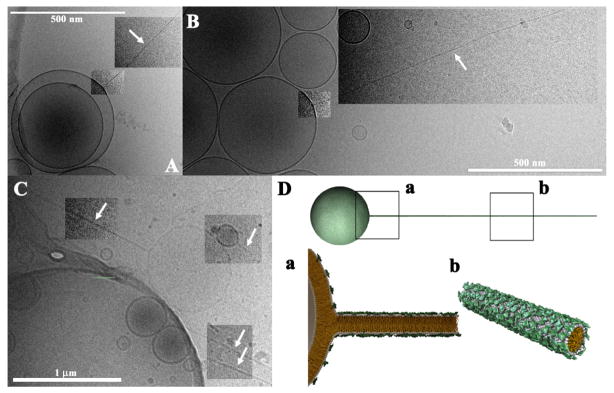
Cryo-TEM images of block liposomes containing lipid nanorods (white arrows point to nanorods). The block liposomes exist in a narrow composition range (8–10 mol% MVLBG2) of mixtures of the charged lipid MVLBG2 with spherical vesicles of neutral DOPC. A–C: Diblock liposomes (sphere-rod) comprised of lipid nanorods and spherical vesicles. Lipid nanorods are stiff cylindrical micelles with an aspect ratio ≈1000. Their diameter equals the thickness of a lipid bilayer (≈4 nm) and their length can reach up to several microns. D: Schematic of a MVLBG2/DOPC diblock comprised of a lipid nanorod attached to a vesicle. Insets a and b show molecular-scale schematics. Note the high concentration of MVLBG2 in the nanorod. In A–C, image contrast/brightness was altered in selected rectangular areas. Reprinted with permission from [64]. Copyright 2009 American Chemical Society.
The important ingredient required for the formation of block liposomes is a two-component mixture of lipids with different shapes. A spontaneous breaking of symmetry in lipid composition between the outer and inner layers or a lateral segregation would then, in principle, lead to cylindrical tubules or rods. In the experiments MVLBG2 (16+) provides the conical shape (favoring positively curved membranes), while DOPC has a cylindrical shape, favoring flat membranes (Fig. 10).
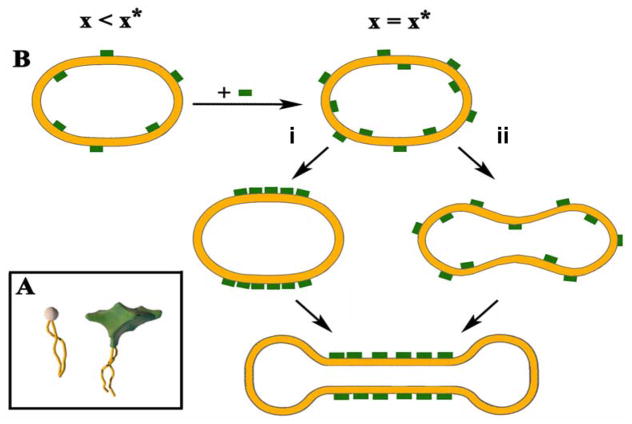
Two possible pathways for the formation of a triblock liposome (sphere-tube-sphere), due to the coupling between thermally induced bending modes and compositional fluctuations, are shown schematically in Fig. 13. The final result of either pathway is a breaking of symmetry between the outer and inner monolayers, where MVLBG2 prefers the outer layer because of its conical shape, leading to a positive spontaneous curvature (C0 > 0). Along pathway (i), a compositional fluctuation leading to a region with a high concentration of MVLBG2 in the outer monolayer (green) will drive the formation of a tubular high-curvature region, which will further be stabilized by a phase separation of the two lipids in the outer and inner layers. Alternatively, along (ii), a bending mode fluctuation producing a high-curvature region will drive MVLBG2 to segregate to the outer monolayer regions with the high positive curvature. Thus, curvature may induce lateral phase separation and a strong bilayer asymmetry in composition.
Figure 13.
(A) inset shows cartoons of cylindrically shaped DOPC and cone-shaped MVLBG2. (B) Schematic of time evolution of vesicle shapes, leading to block liposome formation via coupling of compositional and curvature fluctuations. Green blocks indicate MVLBG2-distribution in the two-component (MVLBG2/DOPC) membrane (inset). x is mole fraction of MVLBG2, x* is the mole fraction of MVLBG2 (8–10 mol% MVLBG2) where block liposomes are observed. As described in the text, a composition fluctuation (i) inducing a curvature fluctuation, or a curvature fluctuation (ii) leading to composition fluctuation, both may lead to block liposome formation. (Illustration shows an example of a tri-block). Adapted with permission from [64]. Copyright 2009 American Chemical Society.
In principle a third mechanism that could lead to a breaking of symmetry between the inner and outer leaflet of the bilayer in a two-component lipid system (leading to C0 > 0) would be a curvature fluctuation, coupled to a non-symmetrical distribution of counterions between the outside and the inside of the bilayer (with excess counterions in the lumen of the block liposome to more effectively neutralize the neighboring charged lipids in the inner leaflet, which has a negative curvature). [64]. Thus, in addition to the asymmetry in composition between the outer and inner layer giving rise to C0 > 0, the spontaneous curvature may also be, in part, due to a larger concentration of counterions near the inner layer. Cryo-TEM images suggest that the coexisting population of diblock (sphere-rod) liposomes may result from a fusion event between opposing inner monolayers of nanotubes leading to a nanotube to nanorod transition.[64]
5. Conclusion and Future Directions
The studies described in this review on biological materials systems have a common theme centered on a fundamental understanding of the interactions and mechanisms underlying lipid- and protein-based nanometer-scale assembly. The understanding should lead to the development of nanometer-scale materials with distinct shapes and morphologies, which are scientifically and technologically important. Nanometer-scale tubes and rods and their assemblies are of interest as miniaturized materials with diverse applications as circuitry components, enzyme encapsulation systems and biosensors, vehicles for chemical delivery, and as templates for hierarchical nanostructures.
Interesting applications may be envisioned based on the close-packed 3D MT bundles and the network-like 2D MT bundles (section 2). For example, metallization of necklace bundles with different size and shape would yield nanomaterials with controlled optical properties (unassembled single MTs have already been templated by other groups). A more original application is in the area of using the assemblies (encapsulated by a lipid bilayer) as chemical carriers where each nanotube may contain a distinct chemical.
For the lipid-protein-nanotubes described in section 4.1 we have found that by controlling the degree of overcharging of the LPNs and the total amount of available membrane area one is able to switch between two states of nanotubes with either closed ends or open ends with lipid caps. This would then form the basis for controlled chemical and drug encapsulation and release.
We expect that future experiments on block liposomes (section 4.2) will distinguish between and clarify the separate contributions of key membrane parameters such as headgroup size, charge, and membrane moduli, to the formation of block liposomes. These studies should also lead to optimal control of physical parameters, such as the conditions of nanorod versus nanotube formation and the nanotube diameter distribution.
Block liposomes may find a range of applications. The incorporation of functional biomolecules, within the lipid membrane would lead to bioactive liquid nanotubes for a range of applications, including sensing and receptor targeting for chemical delivery. The charge and observed stiffness of the nanorods provide ideal conditions for templating (via electrostatic interactions) of linear nanostructures (e.g. wires or needles) and as building blocks for hierarchical nanomaterials. From a fundamental science perspective, any future theory of block liposomes must be able to predict the key physical characteristic of BLs where a single object (e.g. a diblock sphere-rod liposome) simultaneously exhibits length scales (i.e. radii of curvature) varying by as much as two orders of magnitude from < 10 nm (diameter of rod) to > 1000 nm (diameter of the spherical component).
Acknowledgments
CRS, YL, KKE, MCC, AZ, UR, DJN, MAOL acknowledge support by the U. S. DOE BES DE-FG02-06ER46314 (plasmid preparation, protein binding, and protein assembly characterization), the U. S. NIH grant GM-59288 (lipid structure and function), and the U. S. NSF DMR-0803103 (protein phase behavior). SCF was supported by the U. S. NIH NS35010, and LW and HPM were supported by the U. S. NIH NS13560. MCC further acknowledges support in part from the Korean Foundation Grant KRF-2005-2214-C00202. DJN was further supported by a Human Frontiers Program Grant number RGP0034/2010 and the U. S. NSF grants DBI-0959721, PHY-0847188, and the Harvard MRSEC DMR-0820484. UR was also supported by the Human Frontiers Science Program Organization (CDA 0059/2006) and the Israel Science Foundation (grant number 351/08). UR and DJN were jointly supported by the US-Israel Bi-national Science Foundation (grant number 2009-279). MK was supported by Korea Health 21 R&D Project MOHW and the WCU (World Class University) program through the National Research Foundation of Korea funded by the Ministry of Education, Science and Technology No. R33-2008-000-10163-0. The Stanford Synchrotron Radiation Laboratory, where the x-ray scattering work was performed, is supported by the U.S. Department of Energy. The cryogenic transmission electron microscopy research was performed at the National Resource for Automated Molecular Microscopy, which is supported by the U. S. NIH National Center for Research Resources P41 program (RR17573). CRS acknowledges useful discussions with KAIST Faculty where he has a World Class University Visiting Professor of Physics appointment.
Contributor Information
Prof. Cyrus R. Safinya, Email: safinya@mrl.ucsb.edu, Materials, Physics, and Molecular, Cellular, and Developmental Biology Departments University of California, Santa Barbara, CA 93106 (USA)
Prof. Uri Raviv, Materials, Physics, and Molecular, Cellular, and Developmental Biology Departments University of California, Santa Barbara, CA 93106 (USA)
Prof. Daniel J. Needleman, Materials, Physics, and Molecular, Cellular, and Developmental Biology Departments University of California, Santa Barbara, CA 93106 (USA)
Dr. Alexandra Zidovska, Materials, Physics, and Molecular, Cellular, and Developmental Biology Departments University of California, Santa Barbara, CA 93106 (USA)
Prof. Myung Chul Choi, Materials, Physics, and Molecular, Cellular, and Developmental Biology Departments University of California, Santa Barbara, CA 93106 (USA)
Prof. Miguel A. Ojeda-Lopez, Materials, Physics, and Molecular, Cellular, and Developmental Biology Departments University of California, Santa Barbara, CA 93106 (USA)
Dr. Kai K. Ewert, Materials, Physics, and Molecular, Cellular, and Developmental Biology Departments University of California, Santa Barbara, CA 93106 (USA)
Dr. Youli Li, Materials Research Laboratory, University of California, Santa Barbara, CA 93106 (USA)
Dr. Herbert P. Miller, Molecular, Cellular, & Developmental Biology Department & Neuroscience Research Institute, University of California, Santa Barbara, CA 93106 (USA)
Dr. Joel Quispe, National Resource for Automated, Molecular Microscopy, Department of Cell Biology, The Scripps Research Institute, La Jolla, California 92037 (USA)
Prof. Bridget Carragher, National Resource for Automated, Molecular Microscopy, Department of Cell Biology, The Scripps Research Institute, La Jolla, California 92037 (USA)
Prof. Clinton S. Potter, National Resource for Automated, Molecular Microscopy, Department of Cell Biology, The Scripps Research Institute, La Jolla, California 92037 (USA)
Prof. Mahn Won Kim, Department of Physics, Korea Advanced Institute of Science and Technology (KAIST), Daejeon 305-701 (S. Korea)
Prof. Stuart C. Feinstein, Molecular, Cellular, & Developmental Biology Department & Neuroscience Research Institute, University of California, Santa Barbara, CA 93106 (USA)
Prof. Leslie Wilson, Molecular, Cellular, & Developmental Biology Department & Neuroscience Research Institute, University of California, Santa Barbara, CA 93106 (USA)
References
- 1.Martin CR. Science. 1994;266:1961. doi: 10.1126/science.266.5193.1961. [DOI] [PubMed] [Google Scholar]
- 2.September issue on nanotechnology. Sci Am. 2001:285. [Google Scholar]
- 3.Bong DT, Clark TD, Granja JR, Ghadiri RM. Angew Chem Int Ed. 2001;40:988. [PubMed] [Google Scholar]
- 4.Hartgerink JD, Zubarev ER, Stupp SI. Curr Opin Solid State Mater Sci. 2001;5:355. [Google Scholar]
- 5.Martin CR, Siwy ZS. Science. 2007;317:331. doi: 10.1126/science.1146126. [DOI] [PubMed] [Google Scholar]
- 6.Sudeep PK, Joseph STS, Thomas KG. J Am Chem Soc. 2005;127:6516. doi: 10.1021/ja051145e. [DOI] [PubMed] [Google Scholar]
- 7.Huang XH, El-Sayed IH, Qian W, El-Sayed MA. J Am Chem Soc. 2006;128:2115. doi: 10.1021/ja057254a. [DOI] [PubMed] [Google Scholar]
- 8.Lipowsky R, Sackmann E. Structure and Dynamics of Membranes. 1A. Elsevier; Amsterdam: 1995. [Google Scholar]
- 9.Safinya CR. In: The New Physics for the Twenty First Century. Fraser G, editor. Ch 16 Cambridge University Press; Cambridge: 2006. [Google Scholar]
- 10.Janmey PA, Letterrier JF, Herrmann H. Curr Opin Colloid Interface Sci. 2003;8:40. [Google Scholar]
- 11.Jones JB, Safinya CR. Biophys J. 2008;95:823. doi: 10.1529/biophysj.107.127415. [DOI] [PMC free article] [PubMed] [Google Scholar]
- 12.Hesse HC, Beck R, Ding C, Jones JB, Deek J, MacDonald NC, Li Y, Safinya CR. Langmuir. 2008;24:8397. doi: 10.1021/la800266m. [DOI] [PubMed] [Google Scholar]
- 13.Beck R, Deek J, Jones JB, Safinya CR. Nature Mat. 2010;9:40. doi: 10.1038/nmat2566. [DOI] [PubMed] [Google Scholar]
- 14.Peters A, Palay SL, Def H. The Fine Structure of the Nervous System. 3. Webster, Oxford; New York: 1991. [Google Scholar]
- 15.Burgoyne RD, editor. The Neuronal Cytoskeleton. Wiley & Sons; New York: 1991. [Google Scholar]
- 16.Bray D. Cell Movements: From Molecules to Motility. 2. Garland; New York: 2001. [Google Scholar]
- 17.Pollard TD, Earnshaw WC, Lippincott-Schwartz J. Cell Biology. 2. Elsevier; New York: 2007. [Google Scholar]
- 18.Wong GCL, Lin A, Tang JX, Li Y, Janmey PA, Safinya CR. Phys Rev Lett. 2003;91:018103. doi: 10.1103/PhysRevLett.91.018103. [DOI] [PubMed] [Google Scholar]
- 19.Pelletier O, Pokidysheva E, Hirst LS, Bouxsein N, Li Y, Safinya CR. Phys Rev Lett. 2003;91:148102. doi: 10.1103/PhysRevLett.91.148102. [DOI] [PubMed] [Google Scholar]
- 20.Hirst LS, Parker ER, Abu-Samah Z, Li Y, Pynn R, MacDonald NC, Safinya CR. Langmuir. 2005;21:3910. doi: 10.1021/la0476175. [DOI] [PubMed] [Google Scholar]
- 21.Hirst LS, Safinya CR. Phys Rev Lett. 2004;93:018101. doi: 10.1103/PhysRevLett.93.018101. [DOI] [PubMed] [Google Scholar]
- 22.Hirst LS, Pynn R, Bruinsma RF, Safinya CR. J Chem Phys. 2005;123:104902. doi: 10.1063/1.1961229. [DOI] [PubMed] [Google Scholar]
- 23.Ikawa T, Hoshino F, Watanabe O, Li Y, Pincus PA, Safinya CR. Phys Rev Lett. 2007;98:018101. doi: 10.1103/PhysRevLett.98.018101. [DOI] [PubMed] [Google Scholar]
- 24.Angelini TE, Liang H, Wriggers W, Wong GCL. Proc Natl Acad Sci USA. 2003;100:8634. doi: 10.1073/pnas.1533355100. [DOI] [PMC free article] [PubMed] [Google Scholar]
- 25.Wong GCL. Curr Opin Colloid Interface Sci. 2006;11:310. [Google Scholar]
- 26.Wong GCL, Pollack L. Annu Rev Phys Chem. 2010;61:171. doi: 10.1146/annurev.physchem.58.032806.104436. [DOI] [PubMed] [Google Scholar]
- 27.Needleman DJ, Ojeda-Lopez MA, Raviv U, Miller HP, Wilson L, Safinya CR. Proc Natl Acad Sci USA. 2004;101:16099. doi: 10.1073/pnas.0406076101. [DOI] [PMC free article] [PubMed] [Google Scholar]
- 28.Needleman DJ, Ojeda-Lopez MA, Raviv U, Ewert K, Jones JB, Miller HP, Wilson L, Safinya CR. Phys Rev Lett. 2004;93:198104. doi: 10.1103/PhysRevLett.93.198104. [DOI] [PubMed] [Google Scholar]
- 29.Needleman DJ, Ojeda-Lopez MA, Raviv U, Ewert K, Miller HP, Wilson L, Safinya CR. Biophys J. 2005;89:3410. doi: 10.1529/biophysj.104.057679. [DOI] [PMC free article] [PubMed] [Google Scholar]
- 30.Safinya CR, Li Y. Science. 2010;327:529. doi: 10.1126/science.1185868. [DOI] [PubMed] [Google Scholar]
- 31.Kandel ER, Schwartz JH, Jessell TM. Principles of Neural Science. 4. McGraw Hill; New York, Singapore: 2000. [Google Scholar]
- 32.Heidemann SR. Neurons. In: Jeon KW, editor. International Review of Cytology: A Survey of Cell Biology. Academic Press; New York: 1996. [Google Scholar]
- 33.Hirokawa N. J Cell Biol. 1982;94:129. doi: 10.1083/jcb.94.1.129. [DOI] [PMC free article] [PubMed] [Google Scholar]
- 34.Alberts B. Molecular Biology of The Cell. 4. Garland Science; New York: 2002. [Google Scholar]
- 35.Drubin DG, Kirschner MW. J Cell Biol. 1986;103:2739. doi: 10.1083/jcb.103.6.2739. [DOI] [PMC free article] [PubMed] [Google Scholar]
- 36.Drubin DG, Feinstein SC, Shooter EM, Kirschner MW. J Cell Biol. 1985;101:1799. doi: 10.1083/jcb.101.5.1799. [DOI] [PMC free article] [PubMed] [Google Scholar]
- 37.Esmaeli-Azad B, McCarty JH, Feinstein SC. J Cell Sci. 1994;107:869. doi: 10.1242/jcs.107.4.869. [DOI] [PubMed] [Google Scholar]
- 38.Witman GB, Cleveland DW, Weingarten MD, Kirschner MW. Proc Natl Acad Sci USA. 1976;73:4070. doi: 10.1073/pnas.73.11.4070. [DOI] [PMC free article] [PubMed] [Google Scholar]
- 39.Weingarten MD, Lockwood AH, Hwo SY, Kirschner MW. Proc Natl Acad Sci USA. 1975;72:1858. doi: 10.1073/pnas.72.5.1858. [DOI] [PMC free article] [PubMed] [Google Scholar]
- 40.Caceres A, Kosik KS. Nature. 1990;343:461. doi: 10.1038/343461a0. [DOI] [PubMed] [Google Scholar]
- 41.Dawson HN, Ferreira A, Eyster MV, Ghoshal N, Binder LI, Vitek MP. J Cell Sci. 2001;114:1179. doi: 10.1242/jcs.114.6.1179. [DOI] [PubMed] [Google Scholar]
- 42.Kosik KS, Joachim CL, Selkoe DJ. Proc Natl Acad Sci USA. 1986;83:4044. doi: 10.1073/pnas.83.11.4044. [DOI] [PMC free article] [PubMed] [Google Scholar]
- 43.Selkoe D. Neuron. 1991;6:487. doi: 10.1016/0896-6273(91)90052-2. [DOI] [PubMed] [Google Scholar]
- 44.Choi MC, Raviv U, Miller HP, Gaylord MR, Kiris E, Ventimiglia D, Needleman DJ, Kim MW, Wilson L, Feinstein SC, Safinya CR. Biophys J. 2009;97:519. doi: 10.1016/j.bpj.2009.04.047. [DOI] [PMC free article] [PubMed] [Google Scholar]
- 45.Desai A, Mitchinson TJ. Annu Rev Cell Dev Biol. 1997;13:83. doi: 10.1146/annurev.cellbio.13.1.83. [DOI] [PubMed] [Google Scholar]
- 46.Warren BE. Phys Rev B. 1941;59:693. [Google Scholar]
- 47.Gronbech-Jensen N, Mashl RJ, Bruinsma RF, Gelbart WM. Phys Rev Lett. 1997;78:2477. [Google Scholar]
- 48.Ha BY, Liu AJ. Phys Rev Lett. 1997;79:1289. [Google Scholar]
- 49.Gelbart WM, Bruinsma RF, Pincus PA, Parsegian VA. Phys Today. 2000;9:38. [Google Scholar]
- 50.Amos LA, Schlieper D. Adv Protein Chem. 2005;71:257. doi: 10.1016/S0065-3233(04)71007-4. [DOI] [PubMed] [Google Scholar]
- 51.Kohn JE, Millett IS, Jacob J, Zagrovic B, Dillon TM, Cingel N, Dothager RS, Seifert S, Thiyagarajan P, Sosnick TR, Hasan MZ, Pande VS, Ruczinski I, Doniach S, Plaxco KW. Proc Nat Acad Sci USA. 2004;101:12491. doi: 10.1073/pnas.0403643101. [DOI] [PMC free article] [PubMed] [Google Scholar]
- 52.See, e.g.: Schnur JM. Science. 1993;262:1669. doi: 10.1126/science.262.5140.1669.
- 53.Hinshaw JE, Schmid SL. Nature. 1995;374:190. doi: 10.1038/374190a0. [DOI] [PubMed] [Google Scholar]
- 54.Praefcke GJK, McMahon HT. Nature Rev Mol Cell Biol. 2004;5:133. doi: 10.1038/nrm1313. [DOI] [PubMed] [Google Scholar]
- 55.Stowell MH, Marks B, Wigge P, McMahon HT. Nature Cell Biol. 1999;1:27. doi: 10.1038/8997. [DOI] [PubMed] [Google Scholar]
- 56.Roux A, Cuvelier D, Nassoy P, Prost J, Bassereau P, Goud B. EMBO J. 2005;24:1537. doi: 10.1038/sj.emboj.7600631. [DOI] [PMC free article] [PubMed] [Google Scholar]
- 57.Thomas BN, Safinya CR, Plano RJ, Clark NA. Science. 1995;267:1635. doi: 10.1126/science.267.5204.1635. [DOI] [PubMed] [Google Scholar]
- 58.Thomas BN, Corcoran RC, Cotant CL, Lindemann CM, Kirsch JE, Persichini PJ. J Am Chem Soc. 1998;120:12178. doi: 10.1021/ja012137a. [DOI] [PubMed] [Google Scholar]
- 59.Israelachvili JN. Intermolecular & Surface Forces. Academic Press; London: 1992. [Google Scholar]
- 60.Safran SA. Statistical Thermodynamics of Surfaces, Interfaces, and Membranes. Addison-Wesley; Reading: 1994. [Google Scholar]
- 61.Helfrich W. Z Naturforsch C. 1973;28:693. doi: 10.1515/znc-1973-11-1209. [DOI] [PubMed] [Google Scholar]
- 62.Raviv U, Needleman DJ, Li Y, Miller HP, Wilson L, Safinya CR. Proc Natl Acad Sci USA. 2005;102:11167. doi: 10.1073/pnas.0502183102. [DOI] [PMC free article] [PubMed] [Google Scholar]
- 63.Raviv U, Nguyen T, Ghafouri R, Needleman DJ, Li Y, Miller HP, Wilson L, Bruinsma RF, Safinya CR. Biophys J. 2007;92:278. doi: 10.1529/biophysj.106.087478. [DOI] [PMC free article] [PubMed] [Google Scholar]
- 64.Zidovska A, Ewert KK, Quispe J, Carragher B, Potter CS, Safinya CR. Langmuir. 2009;25:2979. doi: 10.1021/la8022375. [DOI] [PMC free article] [PubMed] [Google Scholar]
- 65.Ewert KK, Evans HM, Zidovska A, Bouxsein NF, Ahmad A, Safinya CR. J Am Chem Soc. 2006;128:3998. doi: 10.1021/ja055907h. [DOI] [PubMed] [Google Scholar]
- 66.Zidovska A, Ewert KK, Quispe J, Carragher B, Potter CS, Safinya CR. Biochim Biophys Acta - Biomembranes. 2009;1788:1869. doi: 10.1016/j.bbamem.2009.06.013. [DOI] [PMC free article] [PubMed] [Google Scholar]
- 67.Zidovska A, Ewert KK, Quispe J, Carragher B, Potter CS, Safinya CR. Meth Enzymol. 2009;465:111. doi: 10.1016/S0076-6879(09)65006-0. [DOI] [PMC free article] [PubMed] [Google Scholar]


