Abstract
In breast conservation surgery, surgeons attempt to remove malignant tissue along with a surrounding margin of healthy tissue. Subsequent pathological analysis determines if those margins are clear of malignant tissue, a process that typically requires at least one day. Only then can it be determined whether a follow-up surgery is necessary. This possibility of re-excision is undesirable in terms of reducing patient morbidity, emotional stress and healthcare.
It has been shown that terahertz (THz) images of breast specimens can accurately differentiate between breast carcinoma, normal fibroglandular tissue, and adipose tissue. That study employed the Time-Domain Spectroscopy (TDS) technique. We are instead developing a new technique, Frequency-Domain Terahertz Imaging (FDTI).
In this joint project between UMass/Amherst and UMass Medical School/Worcester (UMMS), we are investigating the feasibility of the FDTI technique for THz reflection imaging of breast cancer margins. Our system, which produces mechanically scanned images of size 2cm × 2cm, uses a THz gas laser. The system is calibrated with mixtures of water and ethanol and reflection coefficients as low as 1% have been measured. Images from phantoms and specimens cut from breast cancer lumpectomies at UMMS will be presented. Finally, there will be a discussion of a possible transition of this FDTI setup to a compact and inexpensive CMOS THz camera for use in the operating room.
Keywords: breast cancer, terahertz, imaging, reflectance, reflectivity, refractive index
1.1 INTRODUCTION
The overall goal of this research project at UMass/Amherst and UMass/Worcester Medical School is to design, develop, and translate into clinical practice a new compact terahertz (THz) imaging device for accurate identification of positive breast cancer margins during surgical breast conservation procedures (i.e., lumpectomies). In breast conservation surgery (BCS), surgeons attempt to remove malignant tissue along with a surrounding margin of healthy tissue. After surgical excision of the tumor, the specimen is submitted to pathology to determine if margins are clear of malignant tissue. Pathological analysis typically requires at least one day. Excised tissue must have a negative margin because margin status is an important predictor of breast cancer recurrence. It has been estimated from a number of published reports that 40–50% of BCS procedures need repeating due to positive margins1. In addition to the undue emotional and physical stress, these potentially preventable repeat surgeries increase healthcare costs. Thus, there is a need for intra-operative tools that surgeons can use to accurately assess tumor margins. We believe that imaging with THz radiation provides many advantages for solving the above problem and will ultimately provide the best performance in margin assessment.
Pioneering work by the Teraview/University of Cambridge (UK) group and others has established that dielectric properties of cancer tissue, normal fibro-glandular (non-cancerous) tissue, and adipose (fatty) tissue, have distinguishable differences at THz frequencies. These groups used the time domain THz technique, TDS (Time Domain Spectroscopy) or TPI (Terahertz Pulsed Imaging). For example, Fitzgerald et al. showed that tumor area as measured by THz imaging had a correlation coefficient of at least 0.82 when compared to histological photomicrographs2. The shapes of tumor regions in THz images also correspond well with those derived from the histologies. In our own work, we aim to demonstrate the feasibility of employing a different THz technique, Frequency-Domain Terahertz Imaging (FDTI), to evaluate margins surrounding the tumor in lumpectomies obtained during breast surgery. FDTI has also recently been employed by the UMass/Lowell Submillimeter Wave Technology group to obtain THz transmission images of skin cancer samples3. In an extension of our project, we plan to accomplish the translation of the technique into clinical practice as an intra-operative tool that will aid surgeons during the removal of breast tumors by providing positive identification of diseased tissue in a short enough time that the surgeon will be able to continue the surgery. The feasibility of developing a compact and inexpensive THz camera is a particularly attractive advantage of the FDTI technology. We will discuss the basic concept for such a camera briefly in Section 6.
2. TERAHERTZ TECHNOLOGY EMPLOYED FOR MEDICAL IMAGING
Several competing techniques for cancer margin detection are under discussion or development. Here we describe potential advantages of terahertz radiation for imaging of cancer with emphasis on the FDTI technique. Whereas other types of radiation such as X-rays, gamma-rays (PET and SPECT), visible light, infrared, microwaves and ultrasonics have found familiar uses in medicine, THz technology has only recently begun to be discussed as an alternative4. THz radiation has well-known advantages for medical imaging since it is completely non-ionizing and harmless, in contrast with X-rays. THz waves can resolve spatial detail down to about one wavelength, i.e. ~ hundreds of μm, ideal for the margin detection problem discussed here. The spatial resolution is thus not as good as for visible/NIR or X-rays (~1 μm), but this is not required. The longer wavelength of THz waves instead has the advantage that scattering from biological tissue is less prominent. Terahertz radiation is also particularly effective in identifying liquid water. This attribute is probably one of the major reasons why THz radiation has differentiated so well between malignant tissues, benign breast tissues, and skin tissues in preliminary studies2, 3.
Our objective is evaluation of frequency-domain techniques for THz medical imaging (FDTI). In THz frequency domain techniques, the THz source produces a single-frequency continuous wave (CW). Active FDTI systems require a THz source for illumination, and convenient sources are now becoming available. The THz source is focused on the specimen and reflected power is detected as the specimen is scanned under the beam. Samples have particular dielectric properties that can be expressed as refractive indices. Those refractive indices are then used to calculate reflection coefficients. The average dielectric properties of excised breast tissue have been measured as a function of frequency by Pickwell-MacPherson et al5. In this work, refractive index, n, and absorption coefficient, a, were extracted from transmission measurements of small (~ 3 mm × 3 mm × 500 μm) breast cancer specimens whose predominant tissue types had already been classified as healthy adipose, healthy fibrous, or cancer. Their data shows significant contrast between refractive indices. The complex refractive index can be defined as6:
| (1) |
and κ is found from
Using the values from [5] at, for example, 1.9 THz, we find that the complex refractive index for the tumor is about 2.05 + i 0.33. The reflection coefficient (power reflection) is defined by (3)6,7.
| (3) |
For accuracy, the complex refractive index6,7 should be used in (3). The imaginary part is so small, however, that neglecting it introduces an error of only about 10%, which is not enough to significantly change contrast between tissues. There is a contrast with the TPI method in this respect: TPI coherently detects the electric field and can thus potentially make use of the information in both the real and imaginary parts of the complex refractive index. FDTI, on the other hand, detects power and thus potentially retrieves less information*. An advantage of FDTI being insensitive to signal phase may be avoidance of potential problems due to air gaps at the sample surface, etc. We can now proceed to set up a table of reflection coefficients for the three different tissues at representative frequencies:
We have assumed that the THz beam passes through air on its way to the sample. Note that reflectivity for cancerous tissue is about three times higher than for adipose tissue at 0.6 THz and greater than a factor of two at 1.9 THz. For tumors and fibrous tissue the contrast ratio is virtually independent of frequency at about 1.5 (50% higher reflection for carcinoma). These contrast ratios are promising and considerably higher than for X-rays. The above numbers provide benchmarks with which we will evaluate performance of the FDTI system. The reflectivity of water at THz frequencies shows a similar frequency dependence to that of the tumorous and fibrous tissues, and the reflectivity of the tumor is close to that of water. This fact has been used to introduce a hypothesis that the higher THz reflectivity of the cancerous tissue is due to its known higher water content2,3.
3. DESCRIPTION OF THE TERAHERTZ IMAGING SYSTEM AND MEASUREMENT METHODS
3.1. System description
Figure 1 (left) is a simplified schematic illustration of the optical configuration of the FDTI system. Figure 1 (right) is a photograph of the gas laser source. For this development stage of the project, the THz source is a gas-filled FIR laser tube being optically-pumped by a CO2 laser. Later versions will employ compact sources which are now commercially available. A collimated beam from the THz laser source is incident from the lower part of Figure 1 (left). A beam splitter of 25 μm Mylar is inclined at 45 degrees to transmit about half of the THz power and reflect the other half. Power reflected from the beam splitter is used to illuminate the sample via an Offset Axis Paraboloidal (OAP) mirror which produces a focused spot, i.e. a beam waist, at the specimen. THz radiation is normally incident upon the specimen as the specimen is moved by a motorized platform to produce a 2-dimensional image.The reflected radiation re-traces the same beam path back to the beam splitter, where about 50% is then transmitted to reach the detector. Measurements can be performed at discrete frequencies in the range from 0.6 THz to 4 THz by choosing different spectral lines of laser gases such as formic acid, methanol and difluoromethane. For a typical laser wavelength of 158 μm (1.9 THz), we find a focal spot diameter of about 640 μm, which assumes an f-number of 4.0 and is an estimate of the spatial resolution of the system. The application of locating margins in breast cancer requires about 1 mm resolution, and we expect to meet this. The stage on which the sample is placed is scanned under the computerized control of a Labview program. We have used two scanning modes: (i) a stepped mode, and (ii) a swept mode in which rows are swept at virtually constant velocities and columns are changed in 0.5 mm increments. The swept mode produces images in about 20 minutes, which is less than half the time of a stepped image. Twenty minutes is sufficient for these initial feasibility studies. Two different detectors are available to us, a pyroelectric detector and a silicon bolometer which must be cooled with liquid helium. The less-sensitive pyroelectric detector is typically employed for alignment of the system, while the bolometer is reserved for medical samples and certain phantom materials. The laser source is electronically chopped at rates from 5 Hz to 120 Hz, depending on the detector. The detector output is then fed to a lock-in amplifier.
Figure 1.

(Left) A simplified optical diagram of the FDTI system. (Right) Photograph of the gas laser source. The blue box on the right contains the CO2 laser used to optically-pump the FIR gas laser tube on the left.
3.2. Calibration, sample holder and surface roughness concerns
The detector is calibrated before and after each image capture by placing a calibration-liquid filled container where the sample would regularly be. At THz frequencies, reflectivity of ethanol is less than that of water and the dielectric permittivity of an ethanol/water mixture is nearly a linear function of the fraction of ethanol7. Many biological samples are reasonably matched when placed alongside an 80% to 90% ethanol solution. For consistent sensitivity settings of the detector setup, it is best that the calibration solution have a reflectivity close to that of the sample. Measurements of ethanol and water are shown in Figure 2 and confirm the expected relationship from [7]. This graph also indicates that we can resolve the difference in reflectivity between cancer and fibrous tissue (a 30% ratio, see Table 1), and between cancer and adipose tissue (a 50% ratio, see Table 1). These reflectivity estimates are labeled in Figure 2.
Figure 2.
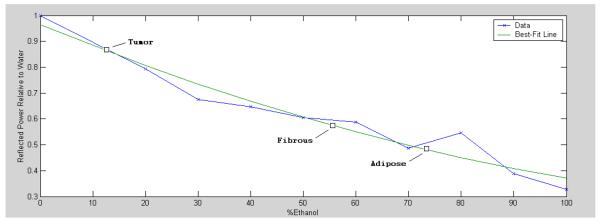
Measured reflectance at 1.9 THz for mixtures of ethanol and water. The reflectance is normalized to that of water (~0.100, see Table 1). This plot also marks the expected reflectance of different tissue samples, as calculated from (3) and given in Table 1.
Table 1.
Calculated reflection coefficients at the three frequencies
| Reflected Power at 0.6 THz [%] | Reflected Power at 1 THz [%] | Reflected Power at 1.9 THz [%] | |
|---|---|---|---|
| Water | 13.9 | 12.0 | 10.0 |
| Tumor | 15.2 | 13.0 | 8.6 |
| Fibrous | 10.1 | 8.5 | 5.7 |
| Adipose | 4.8 | 4.8 | 4.8 |
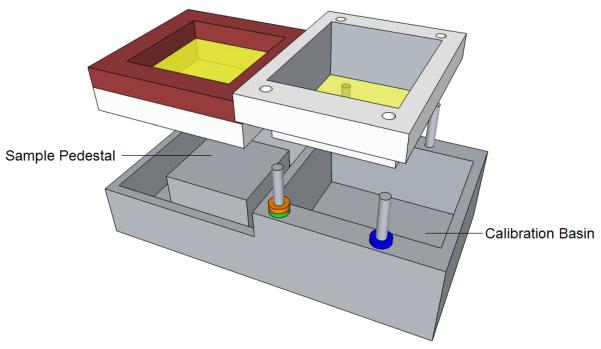
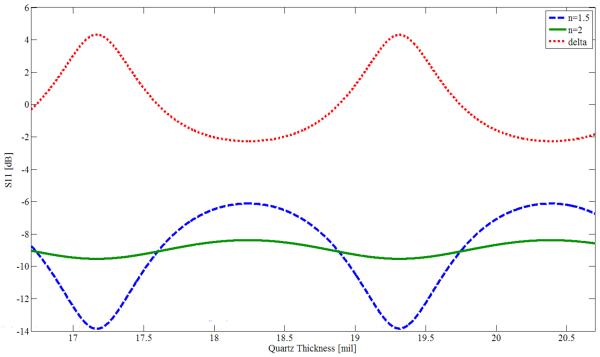
We use a sample holder similar to the one of Figure 3. The sample is placed in the compartment on the left, which also contains a cover for the sample. We have found it desirable to gently press a THz-transparent cover onto the sample. This method minimizes surface roughness effects. Surface roughness of sandpaper has been studied at THz9, with RMS surface deviations in the range of 6–16 μm, but not yet for biological samples. An RMS surface roughness of only 16 μm decreases reflectance by about 90% at 1.9 THz, suggesting the need for additional study. We note that typical TPI reflectance experiments lightly compress medical samples against a quartz plate. When thin samples are measured in transmission, the sample is often contained between two quartz plates3,5. Experiments were made with Mylar covers, but there were difficulties in stretching those covers taut enough to be flat while pressed against the sample. We then analyzed a thin quartz plate using Agilent Advanced Design System (ADS), a commonly used microwave design program. Taking the dielectric permittivity of quartz as 2.114, tanδ as 0.00066, the frequency as 1.89THz, and the quartz thickness as a variable, values of power reflectance (|S11|2 in microwave terminology) were found with simulations. One set of simulations was for a sample with a refractive index of 2.0, representative of a cancer specimen and shown as a green curve in Figure 4. The other set of simulations was for a sample with a refractive index of 1.5, representative of an adipose specimen and shown as a blue curve in Figure 4. The red curve is the difference between the green and blue curves (`delta', including sign) and has maxima at periodic intervals as a function of cover thickness. From Figure 4 we see that reflectance may increase or decrease with refractive index, depending on cover thickness. The maximum contrast in reflectance at the positive peaks is 4.3 dB, and for the negative peaks it is 2.3 dB. Useful contrast values can be obtained near the region of either peak, extending the range of laser frequencies for which a quartz plate of particular thickness can be employed for imaging. We presently have available a set of quartz plates with a thickness of 18.7 mil†. These plates yield a value of delta = 1.3 dB at f = 1.89 THz for the particular chosen values of specimen refractive index of 1.5 and 2.0 (the reflectance is greater for n = 1.5 than for n = 2.0). We tested our simulated results by imaging 1 × 1 cm areas of (i) a quartz plate with water immediately below it (n = 2.0 at 1.89 THz); and (ii) a THz absorber placed a short distance below the quartz plate, representing reflection against air (n=1). The measured ratio of the reflectances was 2.8 dB, whereas the simulation predicts 3.4 dB. The difference may be explained either by a small difference in the assumed thickness, or in the reflectance of the absorber material. For the medical measurements in this project, the most important factor is that we have a consistent reflectance contrast for different refractive indices, so that the cancer margins can be clearly distinguished, and the quartz plate covers should enable us to produce satisfactory images of the medical specimens, based on our tests of different phantom materials so far.
Figure 3.
The sample holder. Medical samples are placed on the left, with an option to use a THz transparent cover over the sample. The right compartment contains calibration solution.
Figure 4.
Power reflectance S11 (in dB), as simulated in Agilent ADS for a quartz plate covering representative samples with refractive indices of 1.5 and 2.0. Also shown is the reflectance difference (delta) between the two samples. The source frequency is 1.89 THz.
3.3. Logistics
Clinical samples are transported from The University of Massachusetts Medical School (UMMS) in Worcester to UMass Amherst for THz and optical imaging. The transport container is a vial of saline or formalin solution. Inside the vial, samples are secured in cassettes. After THz imaging, samples are sent to a hospital for histological analysis. The pathologist will outline the margins of the cancer on the photographic optical image. By comparing THz images to histology results, the effectiveness of THz tissue characterization will be evaluated.
3.4. Image processing and registration
Data recorded by the detector setup is post-processed in Matlab. Plots and animations are made using the imagesc function and an example is given in Sec. 5. Each experiment has 3 images – an optical image, a histology image, and the THz image. Code for co-registering those images has been written using Matlab and the Image Processing Toolkit. To demonstrate, two images have been taken with a digital camera from different vantage points. One image, arbitrarily designated as the overlay, was processed with a digital filter to be easily distinguishable from the base image (Figure 5). A two-dimensional projective transformation was performed with the imtransform function. Figure 6 shows the overlay and base after having been transformed and translated by software. Opacity of the overlaid image is modified to demonstrate the presence and alignment of both images.
Figure 5.

The base (left) and overlay to be transformed and translated (right).
Figure 6.

The co-registration of base and overlay. The overlay image was adjusted for low opacity (left), medium opacity (center), and high opacity (right).
4. IMAGING OF PHANTOMS
We have used the FDTI system to image a number of phantoms at 1.89THz. Figure 7 shows an optical photograph of a slice of bacon in the sample holder (left) and the stepped THz image (right). The step size was 1 mm and the image size was 20 mm × 20 mm. The darker, more fibrous parts have an average reflectivity of about 20% while the adipose sections show substantial contrast with reflectance of only about 5%. No cover was used. Figure 8 shows paper with a spot of hardened paint and an absorbed oil droplet. The step size for this image is 0.5 mm. Figure 9 demonstrates that the FDTI system can distinguish between two different types of fat. This image also demonstrates detection of low reflectivity levels -- fractions of a percent. The next section contains images from swept-mode measurements. Swept mode requires optimization of the relationship between all time-constants: scan speed, modulation frequency, and the lock-in amplifier time constant.
Figure 7.
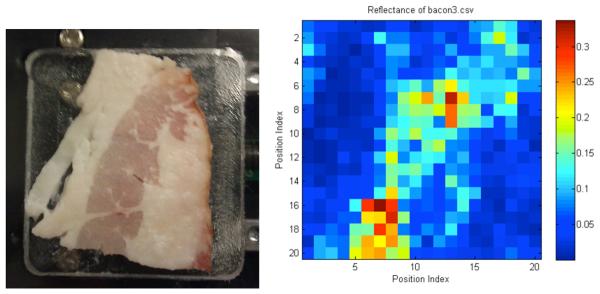
Stepped FDTI image of a slice of bacon.
Figure 8.
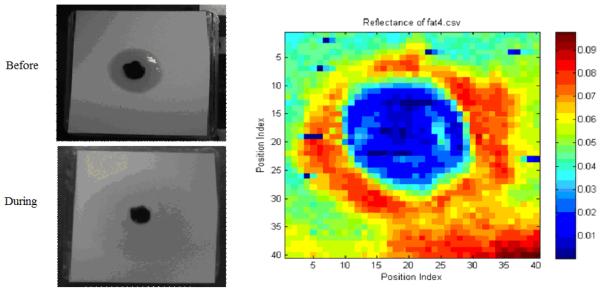
Optical image of a drop of oil on paper (left). The central black spot is dried paint.
Figure 9.
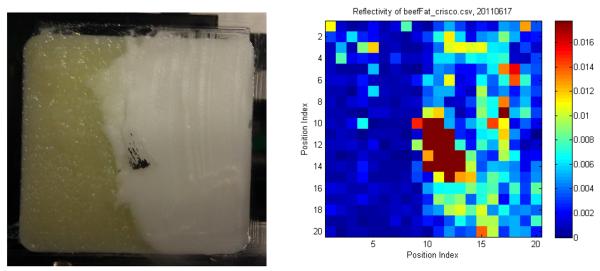
Optical image of beef fat and food shortening (left), and a stepped THz image (right). There is a metallic place-marker in the center.
5. IMAGING OF BREAST CANCER SPECIMENS
Five medical samples have been measured. For the most-recent batch, the bolometer was used to detect the THz beam being modulated at 111.4 Hz. Swept measurements were taken for both sides of each sample with a 20 ms amplifier time constant and 1mm/s horizontal sweep velocity. The image area for each sample was a 20 mm square. The scale of the THz image was adjusted for optimum contrast. Figure 10 clearly shows the outline of the specimen as well as some localized features. Vertical striations in the THz image may correspond with different tissue types – particularly the higher reflectivity section in the upper right and associated discoloration in leftmost photograph. Although a histology comparison has not been completed, the specimen was known to have areas of cancer. Unfortunately, the rough topology of this sample, as visible in the central photo, will limit its usefulness. The rough and unflattened surface is also believed to be the cause of the unexpectedly low reflectance values. This specimen was preserved in saline.
Figure 10.
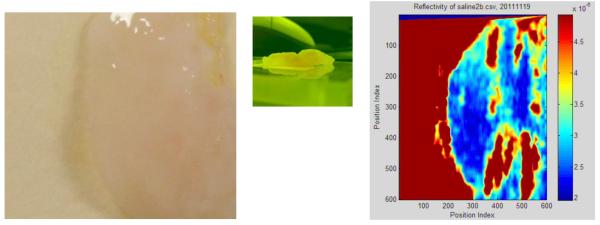
Optical image of a sample cut from a breast mastectomy (left). Side view (center). Terahertz image (right).
6. DISCUSSION AND CONCLUSIONS
We have introduced the single-frequency FDTI technique for measuring reflection of THz from mechanically-scanned medical samples. The main goal is to demonstrate the feasibility of this technique for assessment of cancer margins in breast cancer lumpectomy specimens. We have established, by measuring liquids of known dielectric properties, that the system is capable of measuring reflectivities of less than 1 % and expect from other work which has employed the TPI (Terahertz Pulsed Imaging) technique2,5 that reflectivity of different tissues in the specimens will be in the range of 5 to 10 %. Several phantom specimens with reflectivities in this range have also been successfully imaged. The surface structures of medical samples often have irregularities so we have employed thin quartz covers which press lightly against the specimen to help insure a smooth surface. The quartz covers are essentially transparent to the terahertz beam, provided that a specific frequency is used for a given thickness of quartz. After a series of preliminary tests, we anticipate successful completion of up to 10 terahertz images in the next few months. We will establish criteria for distinguishing cancer tissue from other tissues, and will compare the areas of the cancerous regions in the THz images to those derived from histology, similar to what was done in [2] using TPI.
Beyond this investigation, one can envisage FDTI systems which illuminate medical specimens using smaller electronic THz sources that are either already commercially available10 or currently under development11. Compact THz detector arrays based on low-cost CMOS transistor technology, which operate at room temperature, have recently been demonstrated12. Considering these advances in source and detector technology, it appears feasible to develop a compact THz camera to be directly employed in clinical situations. Such a camera could be available in operating rooms in the near future.
ACKNOWLEDGEMENT
This work is being supported by Award # R21CA143660 from the National Cancer Institute. The content is solely the responsibility of the authors and does not necessarily represent the official views of the National Cancer Institute or the National Institutes of Health.
Footnotes
Coherent FDTI systems have also been developed, but are much more complex and thus considerably more expensive.
1mil = 25.4 μm
REFERENCES
- [1].Jacobs L. Positive margins: the challenge continues for breast surgeons. Ann Surg Oncol. 2008;15(5):1271–2. doi: 10.1245/s10434-007-9766-0. [DOI] [PMC free article] [PubMed] [Google Scholar]
- [2].Fitzgerald AJ, Wallace VP, Jimenez-Linan M, Bobrow L, Pye RJ, Purushotham AD, Arnone DD. Terahertz Pulsed Imaging of Human Breast Tumors. Radiology. 2006;239:533–540. doi: 10.1148/radiol.2392041315. [DOI] [PubMed] [Google Scholar]
- [3].Joseph CS, Yaroslavsky AN, Lagraves JL, Goyette TM, Giles RH. “Dual-frequency continuous-wave terahertz transmission imaging of nonmelanoma skin cancers” in Terahertz Technology and Applications III. In: Sadwick Laurence P., O’Sullivan Creidhe M. M., editors. Proceedings of SPIE. Vol. 7601. SPIE; Bellingham, WA: Jan, 2010. p. 760104. 2010. [Google Scholar]
- [4].Siegel PH. Terahertz Technology in Medicine. IEEE Trans. Microw. Theory Techniques. 2004;52:2438–2447. [Google Scholar]
- [5].Ashworth PC, Pickwell-MacPherson E, Provenzano E, Pinder SE, Purushotham AD, Pepper M, Wallace VP. Terahertz pulsed spectroscopy of freshly excised human breast cancer. Optics Express. 2009;17:12444–12454. doi: 10.1364/oe.17.012444. [DOI] [PubMed] [Google Scholar]
- [6].Huang S, Ashworth PC, Kan KWC, Chen Y, Wallace VP, Zhang Y, Pickwell-MacPherson E. Improved sample characterization in terahertz reflection imaging and spectroscopy. Optics Express. 2009;17:3848–3854. doi: 10.1364/oe.17.003848. [DOI] [PubMed] [Google Scholar]
- [7].Jackson JD. Classical Electrodynamics. Third edition John Wiley and Sons; 1999. [Google Scholar]
- [8].Jepsen PU, Møller U, Merbold H. Investigation of aqueous alcohol and sugar solutions with reflection terahertz time-domain spectroscopy. Optics Express. 2007;15:14717–14737. doi: 10.1364/oe.15.014717. [DOI] [PubMed] [Google Scholar]
- [9].Jagannathan A, Gatesman AJ, Giles RH. Characterization of roughness parameters of metallic surfaces using terahertz reflection spectra. Optics Letters. 2009;34:1927–1929. doi: 10.1364/ol.34.001927. [DOI] [PubMed] [Google Scholar]
- [10].Virginia Diodes, Inc.; Charlottesville, VA: [Google Scholar]
- [11].Muthee M, Carrion E, Nicholson J, Yngvesson SK. Antenna-coupled terahertz radiation from joule-heated single-wall carbon nanotubes. AIP Advances. 2011;1:042131. [Google Scholar]
- [12].Öjefors E, Pfeiffer UR, Lisauskas A, Roskos HG. A 0.65 THz Focal-Plane Array in a Quarter-Micron CMOS Process Technology,” Solid-State Circuits. IEEE Journal of. 2009;44:1968–1976. [Google Scholar]


