

Abstract
The corpus callosum (CC) is a structure of interest in many neuroimaging studies of neuro-developmental pathology such as autism. It plays an integral role in relaying sensory, motor and cognitive information from homologous regions in both hemispheres.
We have developed a framework that allows automatic segmentation of the corpus callosum and its lobar subdivisions. Our approach employs constrained elastic deformation of flexible Fourier contour model, and is an extension of Szekely’s 2D Fourier descriptor based Active Shape Model. The shape and appearance model, derived from a large mixed population of 150+ subjects, is described with complex Fourier descriptors in a principal component shape space. Using MNI space aligned T1w MRI data, the CC segmentation is initialized on the mid-sagittal plane using the tissue segmentation. A multi-step optimization strategy, with two constrained steps and a final unconstrained step, is then applied. If needed, interactive segmentation can be performed via contour repulsion points. Lobar connectivity based parcellation of the corpus callosum can finally be computed via the use of a probabilistic CC subdivision model.
Our analysis framework has been integrated in an open-source, end-to-end application called CCSeg both with a command line and Qt-based graphical user interface (available on NITRC). A study has been performed to quantify the reliability of the semi-automatic segmentation on a small pediatric dataset. Using 5 subjects randomly segmented 3 times by two experts, the intra-class correlation coefficient showed a superb reliability (0.99). CCSeg is currently applied to a large longitudinal pediatric study of brain development in autism.
Keywords: corpus callosum, segmentation, shape model, Fourier coefficient
1. INTRODUCTION
The corpus callosum (CC), the largest white matter structure in the brain, has been a structure of high interest in neuroimaging studies of normal development,1 autism, schizophrenia,2 Alzheimer disease, bipolar and unipolar disorders. Also known as the callosal commissure, it plays an integral role in relaying sensory, motor and cognitive information from homologous regions in the two hemispheres.
Segmentation of anatomical structures is a critical task in medical image analysis that has many applications such as volume assessment and shape analysis. Elastic deformable models3 (snakes) are a common technique for delineating an object outline from a 2D image, by minimizing an energy associated to a current contour as a sum of both internal elastic term and external term. They require a precise initialization to avoid local energy minima, but offer a way for the inclusion of prior knowledge to limit deformations to normal variations of the object of interest. Cootes et al.4 introduced active shape models taking advantage of the point distribution model to restrict the shape range to an explicit domain learned from a training set. Szekely et al5 proposed 2D Fourier descriptors for the parameterization of simple closed curves and their use in elastic matching procedures.
We have extended a prior framework based on Szekely’s work5 that allows automatic segmentation of the corpus callosum using an appearance and shape model. In the next section, we describe our novel methodology in further detail, then present its dissemination and application on a small pediatric dataset to quantify its reliability.
2. METHODOLOGY
In this section, we describe our analysis framework (Figure 1), which entails three main steps: (1) automatic initialization of the corpus callosum model, (2) multi-step automatic (and potentially interactive) segmentation via constrained elastic deformation of a flexible Fourier contour model, (3) lobar area computation using a probabilistic subdivision model.
Figure 1.
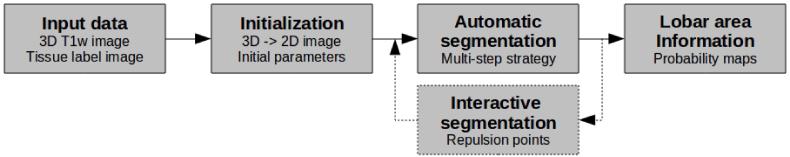
Corpus callosum segmentation framework
2.1 Input data - prerequisites
Besides the use of a shape and appearance model, our corpus callosum segmentation requires as input data a 3D T1-weighted image of interest and its corresponding tissue segmentation. The T1w data should be AC-PC aligned or close to such alignment; our datasets being usually rigidly registered to the MNI atlas in that regard. An atlas-based automatic tissue segmentation via an expectation maximization scheme6 is applied prior to the CC segmentation, which computes probabilistic and hard tissue segmentations. This step also performs an intensity inhomogeneity correction on the input image to remove gradual variations in the image intensity mainly due to radio frequency coil imperfection.
2.2 Corpus callosum initialization
Slice averaging
Initialization of the corpus callosum is performed automatically. Starting with the 3D T1-weighted image, the mid-sagittal plane is defined by default as the average center slice of the image. More precisely, an average image of several center slices (plus/minus 2 slices by default) is computed to define such a 2D plane. This averaging step results in a reduced intensity of the fornix and thus enhances the success rate for the segmentation procedure. The tool allows further for the manual adjustment of the midsagittal slice via the user-interface.
Vessel removal
As a next step, an optional vessel removal operation can be performed beforehand which removes voxels associated with vessel artifacts in T1weighted images. These voxels show significantly higher intensities and occur quite frequently close to CC and thus can lead to bad segmentations if not removed.
Parameter initialization
The mean contour model is then aligned correctly within the 2D mid-sagittal plane, by flipping and possible permutations of the main axes. A connected component filter is then applied on the smoothed white matter segmentation image to detect the two largest white matter structures, the corpus callosum and brainstem. Using heuristics, the component whose center of gravity is closest to the center of the image is considered as the CC. Computing its image moments hence defines the initial parameters of the CC model such as the center of mass, degree of rotation and scaling. The mean intensity within the CC component is then used for the appearance calibration. These steps provide a good automatic initialization of the corpus callosum, but these parameters can always be interactively adjusted.
2.3 Shape and appearance model
The deformable shape and appearance model has been created from a large, mixed training population of 150+ subjects, including balanced groups of adult controls and schizophrenics, as well as pediatric controls and autistics (2 and 4 year-old). The mean model (Figure 3) has been computed by simply averaging the training set contours, and a principal component analysis of the covariance matrix of the Fourier coefficients help define the major deformation modes (Figure 2). The computed major modes of variation and image gray-values along the contour are thus captured in the model, with complex Fourier descriptors up to degree 11. The appearance model is computed along contour profiles at the sampled contour representation following the active contour segmentation method.
Figure 3.
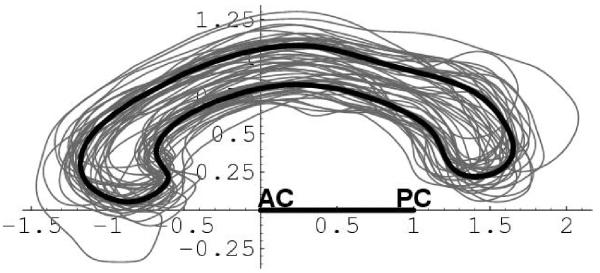
Mean shape model (bold) and its 150+ training set (fine)
Figure 2.
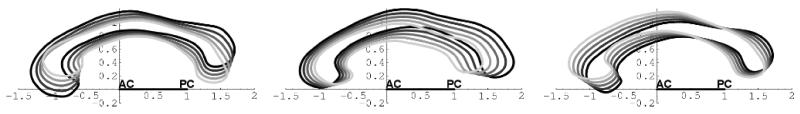
Shape model: major modes of variations (left-right: 1-3 mode)
2.4 Segmentation by elastic deformation
The segmentation of the corpus callosum is performed by maximizing the match between the gray-value profiles in the image and the model (Figure 4), while constraining the shape to a combination of major modes of shape variation. Our automatic segmentation of the CC from the sMRI data is an extension of Szekely’s 2D Fourier descriptor based Active Shape Model.5
Figure 4.
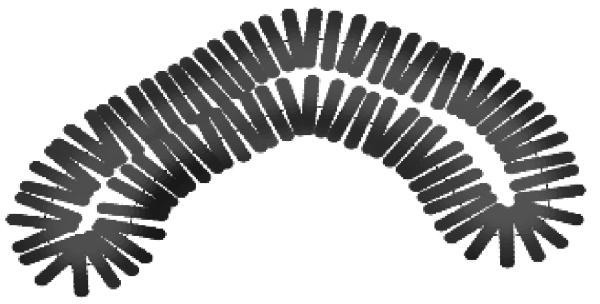
Image gray-value information is extracted along the contour
Using a prior initialization of the contour model, a modified version of Fourier snake is applied such that the model fits the edges along the object contour via energy optimization. The goodness of fit, which evaluates how well a given profile matches its model, is defined as the square of the Mahalanobis distance between intensity profiles; a small value corresponding to a good fit. The deformation is however restricted to the subspace of dominant eigenmodes, in order to allow only deformations that are represented in the training sample (used to create the shape model). To improve its robustness, the CC segmentation is performed via a 3-step strategy:
We use a large search region (10mm along each profile) and a constrained model deformation at a slightly higher intensity than appearance model
Then we reduce the search region (3mm along each profile), still using a constrained deformation but at the actual expected white matter intensity
Finally, we reduce the search region to within a few voxels (2mm along each profile) using a fully unconstrained deformation at the actual white matter intensity.
Each step is computed until convergence, i.e when the average distance along the curve between two iterations is below a specific threshold (default settings are 0.25, 0.1 and 0.05mm), or until a maximum number of iterations is reached (default settings are 50,15, 3). The first step finishes with a CC contour fully on the inside of the CC due to the higher intensity settings in the model. The second step allows a refinement of the segmentation by using a smaller search region and moves the contour outwards to the CC boundary. Finally, as small individual variations of the object contour may not be well represented by the shape model, an unconstrained deformation still in Fourier space within a fine search area is applied (Figure 9).
Figure 9.

Automatic corpus callosum segmentation on 1-year-old subjects
The segmentation procedure yields Fourier coefficients with an inherent correspondence based on its arc-length parametrization. The start-point for the arc length parametrization is given by the first order ellipse. The Fourier descriptors are uniformly sampled into a single polygon curve (100 points, spacing along curve is about 0.75mm).
2.5 Interactive use of repulsion points
The automatic segmentation may not be fully accurate in certain areas of the corpus callosum, due to variations in shape but also other issues related to MRI brain images which may arise: incorrect initialization, presence of noise, partial voluming, existence of other areas close to the corpus callosum with similar intensities, etc. If needed, a semi-automatic segmentation is thus provided, via the use of repulsion points. These points can be placed manually on the 2D mid-sagittal plane via the graphical user interface, once a first optimization has already been performed. A repulsive exponential function is then added as a cost to the overall energy function to be optimized as follows:
| (1) |
with r being the radius of the repulsion area (0.1 by default) and A being the amplitude defined by default as A = 100 * GOF mean, where GOF mean is the average goodness of fit over the contour. dist is the distance between the repulsive point and the segmentation node.
Using the result of the first segmentation as an initialization, the segmentation procedure will take into account this additional energy and refines the overall segmentation (see Figure 5).
Figure 5.

Semi-interactive corpus callosum segmentation using a repulsion point
2.6 Lobar connectivity based parcellation
To provide area information, we use a model based probabilistic subdivision scheme of the corpus callosum.7
Probabilistic subdivision scheme
One of the most widely applied subdivision scheme was proposed by Witelson,8 which is motivated by neurohistological studies (Figure 6). This subdivision scheme uses hard subdivision boundaries and is however sensitive to alignment and/or manual labeling.
Figure 6.
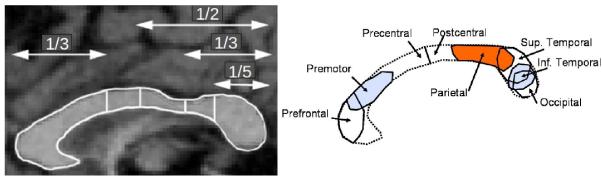
Corpus callosum in an MR image (left) with Witelson subdivision and its neuro-histological motivation (right)
We use a model based probabilistic subdivision scheme of the CC, our model being computed as the average model of a training population of automatic cortical lobe subdivision propagated via inter-hemispheric, transcallosal DTI fibers (see7 for details). This model consists of 4 probabilistic maps that assign to each contour point the probabilities to belong to any of 4 connectivity-based lobar subdivisions (Figure 7). More precisely, the model is built from 5 pediatric cases, combining T1w sMRI and DTI images. We computed the lobar inter hemispheric DTI fibers (prefrontal, frontal, parietal, occipito-temporal subdivisions) as well as the CC segmentation of these cases. Occipital and temporal lobes were joined due to overlapping fiber bundles. 4 distance-weighted probabilistic subdivisions pi(x) of the individual CC contours were then computed using the closest distances di(x) = dist(C(x), f(i)) of every contour point C(x) to the reconstructed 4 fiber sets f(i) as follows:
| (2) |
where maxdist represents the maximal possible distance predetermined at the average length of the CC. The final probabilistic subdivision model is computed by linearly averaging the probabilities of each CC contour across the training population.
Figure 7.

Subdivision model computation. Left: DTI fiber bundles associated by lobes. Middle: Schematic visualization of the probability computation. Right: Sample CC contour probability map plotting disks of radii relative to the corresponding probability at each contour point
Probability maps from the subdivision model are assigned to the contour points of each new individual CC contour using the contour correspondence of the Fourier Descriptors. Our model subdivides thus not the full cross-section of the CC, but rather only its contour.
Lobar area information
The subdivision probabilities for the whole CC cross section are determined by closest point correspondence to the contour. This closest point operation results in the probabilistic area maps for the CC cross-section (Figure 8). From the probabilistic area maps, the area values of the 4 regions are computed by simple probabilistic summation.
Figure 8.
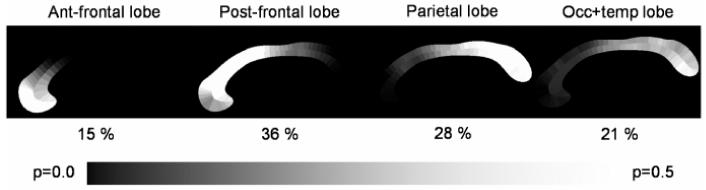
Probabilistic area maps for a sample case. Each region is annotated with the respective probabilistic area percentage relative to the overall area
3. DISSEMINATION AND RESULTS
3.1 Dissemination
This analysis framework has been incorporated into CCSeg, an open-source C++ based application. This cross-platform tool can be run directly via a command line, or through a Qt-based graphical user interface, that allows interactive segmentation if needed. CCSeg is available online to the community on NITRC* (NeuroImaging Informatics Tools and Resources Clearinghouse). The source code is available via a SVN repository, executables can directly be downloaded for different platforms, as well as training materials, such as tutorial and appearance and shape model.
3.2 Results
CCSeg has been applied on a subset of a large multi-site longitudinal pediatric dataset including healthy control, autistic, developmentally delayed subjects (scans at 6, 12 and 24-month old) in order to evaluate the tool’s performance and reliability. The imaging protocol for this Infant Brain Imaging Study included (1) 3D T1 MPRAGE: TR=2400ms, TE=3.16ms, 160 sagittal slices, FOV=256, voxel size = 1mm3, (2) 3D T2 FSE TR=3200ms, TE=499ms, 160 sagittal slices, FOV=256, voxel size = 1mm3. Multi-channel tissue segmentation was performed following a rigid transformation to a normative brain space and pre-processing for bias correction and intensity normalization.
One and 2 year-old scans have been processed via CCSeg, with overall good segmentations (Figure 9). The need of semi-user interaction to correct the segmentation was required on 86 cases out of 366 processed subjects (23.5%) for 12-month (52 out of 233 cases, rate=22.3%) and 24-month data (34 out of 133 cases). While a more sophisticated initialization would reduce such percentage, the current interaction is minimal and interactive CC segmentation is achieved within less than 5 minutes.
A reliability study has been performed on cases needing interactive segmentation within a small pediatric dataset. Using 5 subjects (3 1-year-old and 2 2-year-old) randomly segmented 3 times by two experts, the intra-class correlation coefficient showed a high reliability (0.99). Inter-rater reliability for both experts is also high (0.99).
4. CONCLUSION
We have developed a new framework that allows automatic segmentation of the corpus callosum via constrained elastic deformation of flexible Fourier contour model. It has been incorporated in an open-source C++ based application called CCSeg, which is currently applied to a large longitudinal pediatric study of brain development in autism. A reliability study performed on a small pediatric dataset showed a high intra-class correlation coefficient (0.99). Current research focuses on improvement of the initialization to reduce the need of semi-automatic segmentations on large datasets.
ACKNOWLEDGMENTS
This work is partially funded by the UNC Neurodevelopmental Disorders Research Center HD03110 and the NIMH UNC Silvio O. Conte Center for the NeuroScience of Mental Disorders MH064065. This research is also supported by grants RO1 HD055741 and R01 HD059854.
Footnotes
REFERENCES
- [1].Thompson P, Giedd J, Woods R, MacDonald D, Evans A, Toga A. Growth patterns in the developing brain detected by using continuum mechanical tensor maps. Nature. 2000;6774:190–3. doi: 10.1038/35004593. [DOI] [PubMed] [Google Scholar]
- [2].Keshavan M, Diwadkar V, Harenski K, Rosenberg D, Sweeney J, Pettegrew J. Abnormalities of the corpus callosum in first episode, treatment naive schizophrenia. J Neurol Neurosurg Psychiatry. 2002;72(6):757–760. doi: 10.1136/jnnp.72.6.757. [DOI] [PMC free article] [PubMed] [Google Scholar]
- [3].Kass M, Witkin A, Terzopoulos D. Snakes: Active contour models. International Journal of Computer Vision. 1988;1(4):321–331. [Google Scholar]
- [4].Cootes TF, Hill A, Taylor CJ, Haslam J. The use of active shape models for locating structures in medical images. IPMI’93. 1993:33–47. [Google Scholar]
- [5].Szekely G, Kelemen A, Brechbuhler C, Gerig G. Segmentation of 2-d and 3-d objects from mri volume data using constrained elastic deformations of flexible fourier contour and surface models. Medical Image Analysis. 1996;1(1):19–34. doi: 10.1016/s1361-8415(01)80003-7. [DOI] [PubMed] [Google Scholar]
- [6].Prastawa M, Gilmore J, Lin W, Gerig G. Automatic segmentation of MR images of the developing newborn brain. Medical Image Analysis. 2005;9(5):457–466. doi: 10.1016/j.media.2005.05.007. [DOI] [PubMed] [Google Scholar]
- [7].Styner M, Oguz I, Smith R, Cascio C, Jomier M. Corpus callosum subdivision based on a probabilistic model of inter-hemispheric connectivity. Medical Image Computing and Computer Assisted Interventions LNCS. 2005;3750:765–772. doi: 10.1007/11566489_94. [DOI] [PubMed] [Google Scholar]
- [8].Witelson S. Hand and sex differences in the isthmus and genu of the human corpus callosum. a postmortem morphological study. Brain. 1989;3:799–835. doi: 10.1093/brain/112.3.799. [DOI] [PubMed] [Google Scholar]