Abstract
Understanding myelination in early brain development is of clinical importance, as many neurological disorders have their origin in early cerebral organization and maturation. The goal of this work is to study a large neonate database acquired with standard MR imagery to illuminate effects of early development in MRI.
90 neonates were selected from a study of healthy brain development. Subjects were imaged via MRI postnatally. MR acquisition included high-resolution structural and diffusion tensor images. Unbiased atlases for structural and DTI data were generated and co-registered into a single coordinate frame for voxel-wise comparison of MR and DTI appearance across time. All original datasets were mapped into this frame and structural image data was additionally intensity normalized. In addition, myelinated white matter probabilistic segmentations from our neonate tissue segmentation were mapped into the same space to study how our segmentation results were affected by the changing intensity characteristics in early development
Linear regression maps and p-value maps were computed and visualized. The resulting visualization of voxels-wise corresponding maps of all MR and DTI properties captures early development information in MR imagery. Surprisingly, we encountered regions of seemingly decreased myelinated WM probability over time even though we expected a confident increase for all of the brain. The intensity changes in the MR images in those regions help explain this counterintuitive result. The regressional results indicate that this is an effect of intensity changes due not solely to myelination processes but also likely brain dehydration processes in early postnatal development.
1. INTRODUCTION
Understanding myelination in early brain development is of clinical importance, as many neurological disorders have their origin in early cerebral organization and maturation.1–6 As matter of fact, myelination is hardly present at birth and occurs rapidly during the first year of life. While first studies have been published on the brain development across the first year or the first six months, we do not yet understand the effect of myelination and other early brain maturation processes on the appearance of MR images within the first few weeks postnatally.
Such studies of MRI and DTI appearance are especially important in light of the existence of tissue segmentation algorithms that aim at quantifying myelinated and non-myelinated white matter in neonate scans, such as proposed by Prastawa7 or Weisenfeld.8 For example, effects such as dehydration in early postnatal development affects T1 and T2 weighted images which in turn affects these intensity based tissue segmentation algorithms. The goal of this manuscript is to study a large neonate database acquired with standard MR imagery to illuminate these effects. For this purpose, we mapped structural data, Diffusion tensor imaging (DTI) data and results from our neonate segmentation7 into a single coordinate frame for voxel-wise comparison.
2. METHODS
2.1 Datasets
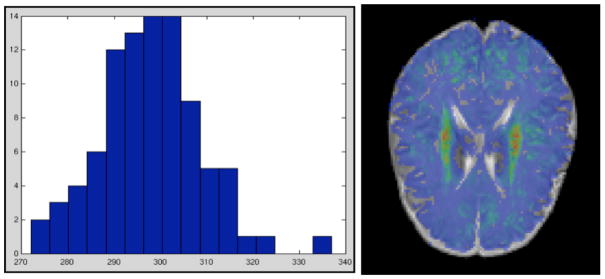
This study was performed on a set of 90 subjects from a larger study of prenatal and neonatal brain development in children at high risk for neurodevelopmental disorders and controls.9 Singleton subjects with a gestational age at birth of 37 weeks or older who had T1w, T2w, proton density, and DTI scans that were free of major motion artifacts were included in this analysis. Subjects were of 272 to 337 days gestational age at the day of the MR scan (see Figure 1 for the age distribution of the study population).
Figure 1.

Left: Gestational age histogram over all subjects in the study. Median gestational age is 298 days, which as chosen as the baseline for the linear regression. Right: Example MWM Probability map colorcoded (red = high probability, blue = low probability).
Neonates were scanned on a Siemens Allegra 3 Tesla system unsedated, swaddled, fitted with ear protection, and with their heads secured in a vacuum-fixation device. T1w structural data was acquired with a magnetization-prepared rapid acquisition of gradient echo ([MP-RAGE] TR/TI/TE/flip angle, 1820 ms/400 ms/4.38 ms/7, respectively). Proton density and T2w images were obtained with a turbo spin-echo sequence (TSE; TR/TE1/TE2/flip angle, 6200 ms/20 ms/119 ms/150 respectively). Spatial resolution was 1x1x1 mm isotropic for T1w and 1.25x1.25x2.0 mm3 for proton attenuation/T2-weighted images. A single-shot echo-planar spin-echo DTI imaging sequence was used with the following parameters: TR, 5200 ms; TE, 73 ms; resolution 2x2x2 mm3 and 45 sections. A standard 6 directional protocol with a single baseline image was repeated in 5 separate sets with 2 averages in each set.
Diffusion weighted images (DWI) were corrected for motion and eddy current artifacts and bad DWI images filtered out with our automated quality control tool DTIPrep*. DTI tensor data was estimated via weighted least squares fitting using our DTIproc tools†. T2w/PD data was up-interpolated to isotropic 1mm resolution using windowed-sync interpolation.
2.2 Atlas Building
In order to provide a single coordinate frame for voxel wise comparison, we first computed separate unbiased, deformable atlases based on a fluid deformation framework for the structural T2w and DTI data using existing standard atlas building tools in our laboratory.10 For this procedure, the T2w data was first intensity inhomogeneity corrected and skull stripped using the neonate segmentation tool described further below. All skull-stripped images were then registered affinely to a prior template in standard stereotaxic space. The affinely aligned images were then voxel-wise averaged to form an initial affine average image for T2w and DTI. These affine average images were then chosen as templates for intensity calibration. After an additional update of these templates using the intensity calibrated images, the final step of the atlas image computation was performed, which computes the unbiased deformable atlas images by minimizing the overall deformation of all images into the atlas space.
T1w images were first mapped to the subject-corresponding T2w image via rigid mutual information based registration via 3D Slicer‡, and then secondly mapped into the T2w atlas space using the deformable transform computed during the T2w atlas building process.
The DTI atlas was deformably co-registered into the structural T2w/T1w atlas by matching the atlas base DWI image to the T2w atlas image via b-spline based mutual information registration using 3D Slicer. Based on this information, the individual tensor DTI data was mapped into the DTI atlas space and further propagated into the T2w atlas space employing principal direction alignment and strain preservation. DTI derived feature maps of fractional anisotropy (FA), mean diffusivity (MD), axonal diffusivity (AD) and radial diffusivity (RD) were computed from the mapped tensor images of all subjects.
2.3 Neonate tissue segmentation
In addition, we computed myelinated white matter (MWM) probabilistic maps (Figure 1) using our neonate tissue segmentation tool in the original T1w space.7 This segmentation is an extension of an iterative expectation maximization segmentation (EMS).11 The method operates on single- or multi-channel MRI data and uses a coregistered probabilistic brain atlas as a spatial prior. The EMS tool performs intra-suject multi-channel image registration, registration of the prior brain atlas, bias inhomogeneity correction, and skull stripping in one framework. In neonate MRI, the low contrast-to-noise ratio of nonmyelinated white matter to cortical and subcortical gray matter required significant changes. The parametric modeling of the multivariate distributions is replaced by a robust graph clustering based parameter estimation, resulting in an intermediate segmentation. This segmentation is finally refined using training sample pruning and nonparametric kernel density estimation. Our validation study of the automatic segmentation showed very good agreement with human-expert segmentation.7 The segmentation process is fully automatic, takes about 30 min on a standard personal computer workstation, and does not require human interaction, which often limits reliability. The output of EMS contains probabilistic maps of the gray matter, myelinated white matter, non-myelinated white matter and cerebro-spinal fluid.
As one of the goals of our study of MRI and DTI appearance is the effect these have on segmentation algorithms that aim at quantifying myelinated and non-myelinated white matter in neonate scans, we propagated the MWM probability images into the common atlas space in order to study the effects of changing intensity characteristics in early myelination on our tissue segmentation results.
2.4 Intensity normalization
T1w and T2w imagery is not calibrated and exhibits large inter-subject intensity changes. In order to be able to analyze directly T1w/T2w associated intensities on a voxel-wise basis in the common atlas coordinate frame, all T1w and T2w images were processed after atlas mapping. In this processing we first skull stripped all structural and DTI data in the atlas space using the propagated full brain segmentation from our neonate tissue segmentation mentioned above. Then, an intensity calibration based on a nonlinear histogram quantile normalization (part of the ITK framwork §) to pre-existing T1w and T2w atlas template images also employed in the tissue segmentation. All calibrated, skull-stripped images were then voxel-wise averaged to form updated T1w and T2w template images, which were then in turn used to repeat the intensity calibration procedure. The histogram based intensity calibration was performed with highly smooth transformation parameters in order to minimally adjust the original histogram shape.
2.5 Linear regression across age
Using the Matlab (MathWorks, Natick MA) Statistics package, we applied voxel-wise linear regression. Corresponding regression maps and p-value maps were computed across time with gestational age at scan as the main variable. No covariates (such as gender, birth weight or gestational age at birth) were chosen at this point, which is planned in the next stage of our analysis. Specifically, via Matlabs regress function, three maps were computed for each modality/feature studied here:
Baseline grayscale intensity/feature images, which capture the value of the regressed features at the data median age of 298 days
Signed slope maps, which capture the linear intensity changes across time
Significance p-values maps indicating which voxels show significant increase/decrease across time (p < 0.05, uncorrected for multiple comparison)
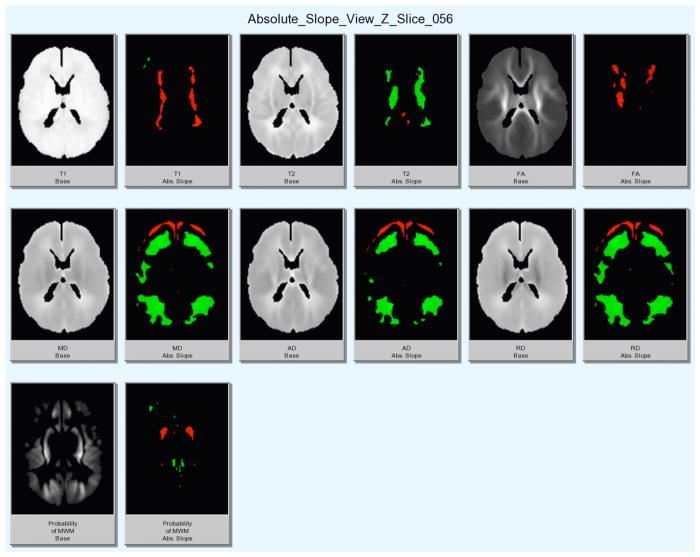
The resulting linear regression baseline and slope maps were masked using the significance maps to avoid the display of non-significant regions (see Figure 2). The slopes maps were processed for color display with positive slopes ranging from dark to light red (for low to high values of slopes) and negative slopes ranging from dark to light green.
Figure 2.
Display of statistically significant regression results on sample slice for structural (T1w, T2w), DTI (FA, MD, AD, RD) images and computed MWM probability. Left: Grayscale image. Right: colored slope image only displaying significant changes in each modality (red = increase, green = decrease).
3. RESULTS
The resulting visualization of voxels-wise corresponding maps of all MR and DTI properties captures early development information in MR imagery (see Figures 2 and 3). While the two figures in this document show only a partial view of the results, the major general findings are well visible:
Figure 3.
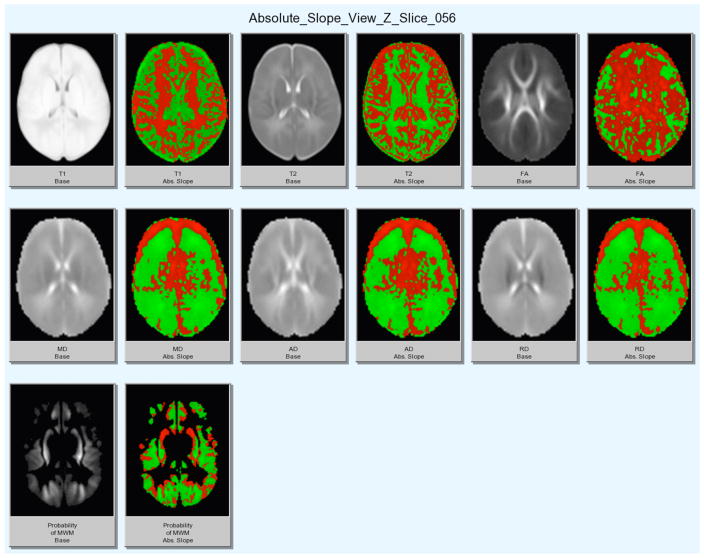
Display of full regression results on sample slice for structural (T1w, T2w), DTI (FA, MD, AD, RD) images and computed MWM probability. Left: Grayscale image. Right: colored slope image (red = increase, green = decrease).
All grayscale images show both areas of increase in intensity as well as decrease, even for DTI properties such as FA or MD
T1w and T2w images mostly behaved inversely of each other, i.e. areas of increase in T1w showed decrease in T2w
Results for MD, AD and RD were qualitatively similar, i.e. similar areas showed increases and decreases, whereas FA shows a largely different change in appearance
We encountered several regions of seemingly decreased MWM probability over time even though we expected a confident increase for all of the brain regions.
3.1 Areas of decreased MWM probability
As mentioned above several regions showed decreased myelinated white matter probability over time. The regressional visualizations indicate that the increase in MWM is related to myelination, whereas the decrease if likely related to intensity changes in T1w and T2w images due to brain dehydration processes12, 13 in early postnatal development, as described more in detail below.
For example, if we examine Figure 3 more closely, we can see that the medial/central white matter region show a relatively symmetric increase in MWM probability for the anterior part (which contains, whereas the posterior part shows a decrease (the peripheral regions are harder to judge as they encompass both white and grey regions). Within the anterior area (where MWM increases), the DTI modalities show an increase in FA and AD, whereas MD and RD show a decrease. This pattern is typical for myelination processes, or the inverse for demyelinating processes.14 The T1w intensity shows a clear increase, whereas T2w intensities show a clear decrease; both observations align well with this hypothesis. Within the posterior area (where MWM decreases), FA increases in contrast to decreases in MD, AD and RD. This general reduction in diffusivity in presence of an FA increase points to combination of myelination and dehydration processes. The T1w and T2w changes are less clear, as they show partially an increase as well as decrease in this region. Based on these observations it is not surprising then that our neonate segmentation procedure incorrectly estimates the probability to encounter myelinated white matter at areas where we likely see both myelination and dehydration happen.
4. CONCLUSION
We have presented a novel study of change in MR and DTI appearance within the first few weeks of neonatal life. Unbiased atlases for structural and DTI data were generated and analyzed in a joint-atlas space. Linear regression maps and p-value maps were employed to assess how early development information affects MR imagery.
The presented research is an ongoing process. We are still in an early stage of interpretation of the results and expect this study to further improve the understanding of MR and DTI appearance in early brain development of neonates.
Acknowledgments
This work was supported by the National Alliance for Medical Image Computing (NAMIC, NIH U54 EB005149); the Autism Centers of Excellence Network at UNC-CH (NIH R01 HD055741), the Neurodevelopmental Research Center at UNC-CH (NIH P30 HD03110); and the National Institute of Mental Health Conte Center at UNC-CH(MH064065). We would like to thank Sarang Joshi and Brad Davis for providing access to their unbiased atlas construction tool.
Footnotes
References
- 1.Gao W, Lin W, Chen Y, Gerig G, Smith JK, Jewells V, Gilmore JH. Temporal and spatial development of axonal maturation and myelination of white matter in the developing brain. AJNR American journal of neuroradiology. 2009 Feb;30:290–6. doi: 10.3174/ajnr.A1363. [DOI] [PMC free article] [PubMed] [Google Scholar]
- 2.Provenzale JM, Liang L, DeLong D, White LE. Diffusion tensor imaging assessment of brain white matter maturation during the first postnatal year. AJR American journal of roentgenology. 2007 Aug;189:476–86. doi: 10.2214/AJR.07.2132. [DOI] [PubMed] [Google Scholar]
- 3.Gilmore JH, Lin W, Prastawa MW, Looney CB, Vetsa YSK, Knickmeyer RC, Evans DD, Smith JK, Hamer RM, Lieberman JA, Gerig G. Regional gray matter growth, sexual dimorphism, and cerebral asymmetry in the neonatal brain. J Neurosci. 2007 Feb;27:1255–60. doi: 10.1523/JNEUROSCI.3339-06.2007. [DOI] [PMC free article] [PubMed] [Google Scholar]
- 4.Huang H, Zhang J, Wakana S, Zhang W, Ren T, Richards LJ, Yarowsky P, Donohue P, Graham E, van Zijl PCM, Mori S. White and gray matter development in human fetal, newborn and pediatric brains. Neuroimage. 2006 Oct;33:27–38. doi: 10.1016/j.neuroimage.2006.06.009. [DOI] [PubMed] [Google Scholar]
- 5.Mukherjee P, McKinstry RC. Diffusion tensor imaging and tractography of human brain development. Neuroimaging Clinics of North America. 2006 Feb;16:19–43. vii. doi: 10.1016/j.nic.2005.11.004. [DOI] [PubMed] [Google Scholar]
- 6.Gilmore JH, Schmitt JE, Knickmeyer RC, Smith JK, Lin W, Styner M, Gerig G, Neale MC. Genetic and environmental contributions to neonatal brain structure: A twin study. Human brain mapping. 2010 Jan; doi: 10.1002/hbm.20926. [DOI] [PMC free article] [PubMed] [Google Scholar]
- 7.Prastawa M, Gilmore JH, Lin W, Gerig G. Automatic segmentation of mr images of the developing newborn brain. Medical image analysis. 2005 Oct;9:457–66. doi: 10.1016/j.media.2005.05.007. [DOI] [PubMed] [Google Scholar]
- 8.Weisenfeld NI, Warfield SK. Automatic segmentation of newborn brain mri. Neuroimage. 2009 Aug;47:564–72. doi: 10.1016/j.neuroimage.2009.04.068. [DOI] [PMC free article] [PubMed] [Google Scholar]
- 9.Gilmore JH, Lin W, Corouge I, Vetsa YSK, Smith JK, Kang C, Gu H, Hamer RM, Lieberman JA, Gerig G. Early postnatal development of corpus callosum and corticospinal white matter assessed with quantitative tractography. AJNR American journal of neuroradiology. 2007 Sep;28:1789–95. doi: 10.3174/ajnr.A0751. [DOI] [PMC free article] [PubMed] [Google Scholar]
- 10.Joshi S, Davis B, Jomier M, Gerig G. Unbiased diffeomorphic atlas construction for computational anatomy. NeuroImage. 2004 Jan;23(Suppl 1):S151–60. doi: 10.1016/j.neuroimage.2004.07.068. [DOI] [PubMed] [Google Scholar]
- 11.Leemput KV, Maes F, Vandermeulen D, Suetens P. Automated model-based bias field correction of mr images of the brain. IEEE transactions on medical imaging. 1999 Oct;18:885–96. doi: 10.1109/42.811268. [DOI] [PubMed] [Google Scholar]
- 12.Jolesz FA, Kirschner DA, Jakab P, Lorenzo AV. Proton magnetic resonance in myelin deficient brains of mutant mice. J Neurol Sci. 1989 Jun;91:85–96. doi: 10.1016/0022-510x(89)90078-6. [DOI] [PubMed] [Google Scholar]
- 13.Lorenzo AV, Jolesz FA, Wallman JK, Ruenzel PW. Proton magnetic resonance studies of triethyltin-induced edema during perinatal brain development in rabbits. J Neurosurg. 1989 Mar;70:432–40. doi: 10.3171/jns.1989.70.3.0432. [DOI] [PubMed] [Google Scholar]
- 14.Zhang J, Jones M, DeBoy CA, Reich DS, Farrell JAD, Hoffman PN, Griffin JW, Sheikh KA, Miller MI, Mori S, Calabresi PA. Diffusion tensor magnetic resonance imaging of wallerian degeneration in rat spinal cord after dorsal root axotomy. J Neurosci. 2009 Mar;29:3160–71. doi: 10.1523/JNEUROSCI.3941-08.2009. [DOI] [PMC free article] [PubMed] [Google Scholar]


