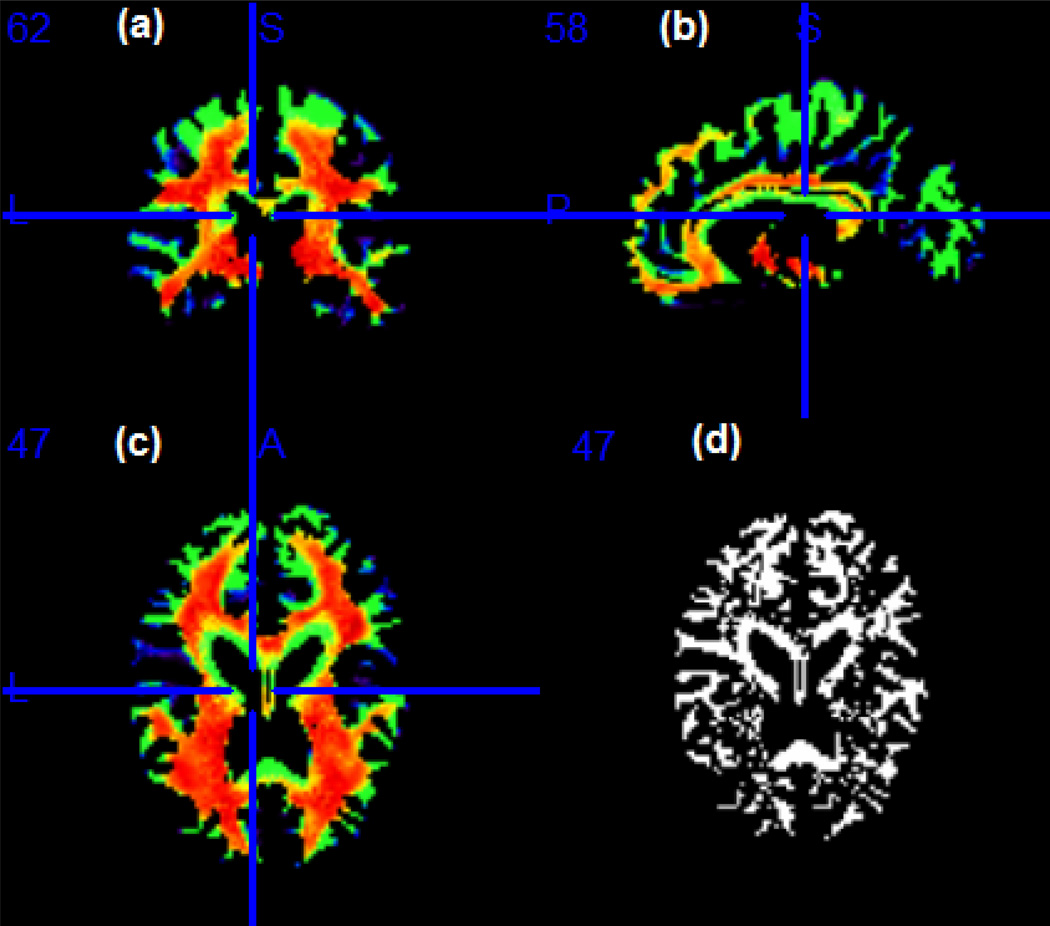
Figure 6.
ADHD data analysis results: selected slices showing the estimated Λ̂ for the imaging data obtained from the white matter RAVENS map. Panels (a)–(c) represent respectively, a coronal, sagittal and axial view of selected slices of the brain. The blue line indicates where the coronal and sagittal slices meet the plane in (c); panel (d) shows the same axial slice as in (c) and represents the location in the brain where Λ = {λd, d ∈ 𝒟} are different from 1, based on a 95% credible interval.

