

Abstract
Cells sense their size and use this information to coordinate cell division with cell growth to maintain a constant cell size within a given population. A model has been proposed for cell size control in the rod-shaped cells of the fission yeast, Schizosaccharomyces pombe. This involves a protein localized to the cell ends, which inhibits mitotic activators in the middle of the cell in a cell size-dependent manner. This protein, Pom1, along with another tip-localized protein, Nif1, have been implicated as direct sensors of cell size controlling the onset of mitosis. Here we have investigated cell size variability and size homeostasis at the G2/M transition, focusing on the role of pom1 and nif1. Cells deleted for either of these 2 genes show wild-type size homeostasis both in size variability analyses and size homeostasis experiments. This indicates that these genes do not have a critical role as direct cell size sensors in the control mechanism. Cell size homeostasis also seems to be independent of Cdc2–Tyr15 phosphorylation, suggesting that the size sensing mechanism in fission yeast may act through an unidentified pathway regulating CDK activity by an unknown mechanism.
Keywords: cell size variability, cell cycle, cell size control, Pom1, growth rate, fission yeast
Introduction
Cells have mechanisms to determine their size. This is suggested by the relative constancy of cell sizes observed for particular cell types, but is most evident in the coordination of the cell cycle with cellular growth.1-6 In many cell types, the commitment to mitosis and cell division occurs when cells attain a specific size, resulting in limited variation in cell size at division. The absolute size at which division occurs varies greatly in different cell types,6 and within a cell type it usually varies proportional to ploidy and is often changed by the nutritional status and growth rate of the cells.7-10 Despite the importance of cell size for regulating cell cycle progression, the mechanisms by which cells determine their size have remained unclear. Recently our group and another11,12 have proposed a mechanism for the fission yeast Schizosaccharomyces pombe involving a gradient of a postulated sensor protein, Pom1, which extends from the tips of the rod-shaped cylindrical cell, reducing in level at the middle of the cell. As the cell grows and elongates, the level of Pom1 drops in the middle of the cell and is monitored there by a detector protein, Cdr2.11-13 In this paper we test this mechanism by investigating whether Pom1 has the characteristics and behavior expected of a direct cell size sensor.
Fission yeast cells are rod-shaped and grow by tip extension without a significant change in cell width.14 The cell cycle stage of any cell can be determined by its length, which is also a good estimate of cell volume.5 Cells begin their cell cycle growing exclusively from the old end present in the previous cycle. At around 10 μm in length, growth is initiated from the new end created at the preceding cell division, a process termed NETO (new end take-off). Cells then grow in a bipolar manner, until they reach around 14 μm in length, when growth ceases and the cell undergoes mitosis followed by septation.14 There are 2 size checkpoints in the fission yeast cell cycle: the first occurs at G1/S and the second at G2/M.5,15,16 The length of the G2 phase can be contracted or extended, such that cells undergo mitosis at the required size.17 The G1/S size checkpoint is usually cryptic in rapidly growing wild-type cells, because the size threshold for mitotic entry is such that, after cell division, cells enter G1 at a size that already surpasses that needed for the G1/S transition.15,18
The mitotic fission yeast cell cycle is driven by the cyclin-dependent kinase Cdc2 in complex with 1 of 4 mitotic cyclins.19,20 Control of the G2/M transition is through inhibitory Cdc2–Tyr15 phosphorylation, regulated by the antagonistic activities of Wee1 kinase and Cdc25 phosphatase.21-25 Upstream of Cdc2 tyrosine phosphorylation are 2 major pathways for mitotic entry. The first is a nutrient-sensing pathway that couples TOR and nutrient-sensing proteins with recruitment of Polo kinase to the spindle pole body and activation of Cdc25.26,27 The second is a cell size- or cell geometry-sensing pathway, much less well characterized, but involving Cdr1 and Cdr2, which phosphorylate and inhibit Wee1. Upstream of Cdr1 and Cdr2 are the mitotic inhibitors Pom1 and Nif1.11,12,28
Pom1 is the key sensor component of the proposed gradient mechanism for cell size control at mitotic entry and is a dual-specificity tyrosine-phosphorylation regulated kinase (DYRK).29 It is enriched at the cell tips and forms a gradient along the length of the cell. It acts as a mitotic inhibitor, because pom1Δ cells divide at a shorter size compared with wild-type, and this inhibitory effect is dose-dependent.11,12 Cdr2 is a mitotic activator localized to cortical nodes located in the middle of the cell. Pom1 phosphorylates and inhibits Cdr2, implicating it as part of the mechanism sensing size at mitotic entry. The model proposes that the concentration of Pom1 in the middle of the cell is length-dependent, and as cells grow during G2, Pom1 concentration around the cortical nodes decreases. Below a critical threshold Cdr2 is no longer inhibited, Wee1 inhibition of Cdc2 is lifted, and CDK is activated driving mitotic entry. This model was supported by data showing that ectopically localized Pom1 in the middle of the cell or around the cell periphery resulted in delayed mitotic entry.11,12 Nif1 could also be implicated in the mechanism due to the tip localization of the Nif1 protein and the small cell phenotype of nif1Δ cells.12,30
We have tested this model by investigating whether Pom1 behaves like a cell size sensor. If it is a molecular component of the mechanism directly sensing cell size, then pom1Δ cells should be affected in their ability to measure cell size at mitosis. Cells deleted for pom1 are advanced into mitosis at a small size, so Pom1 clearly has a potentially rate-limiting role in mitotic onset. However, this role could be in modulating the absolute size of the cell at mitosis, for example in modifying the inputs in or outputs from the sensor. If Pom1 was directly involved in the size-sensing mechanism, then cells lacking Pom1 should exhibit greater variability in size at division and would be less “homeostatic”; that is, larger or smaller cells would not return efficiently to a normal size. Experiments testing these possibilities are described in this paper. In addition, we have investigated how growth rate varies in individual cells within a population to determine whether there is any significant heritability in growth rate.
Results
Cell size variability in pom1Δ and nif1Δ cells
First, we confirmed that we could detect Pom1 and Nif1 at the ends of the cell, as has been shown previously.11,12 Pom1-GFP and Nif1-GFP were localized to the cell tips and division site (Fig. 1A). While Pom1 was always seen at both cell ends, we observed that Nif1 was localized to either one or both tips. The majority of cells shorter than 10 μm, presumed to be prior to NETO, were enriched for Nif1 at one end only, whereas in longer cells we saw an increasing proportion of cells with Nif1 at both ends (Fig. 1B). Just prior to septation (12–14 μm) the majority of cells had Nif1 localized to both cell tips, thus for many cells, Nif1 could be working with Pom1 cooperatively in late G2 cells to form a gradient sensor of cell size. As expected, Cdr2-GFP was located in central cortical nodes (Fig. 1C).
Figure 1.
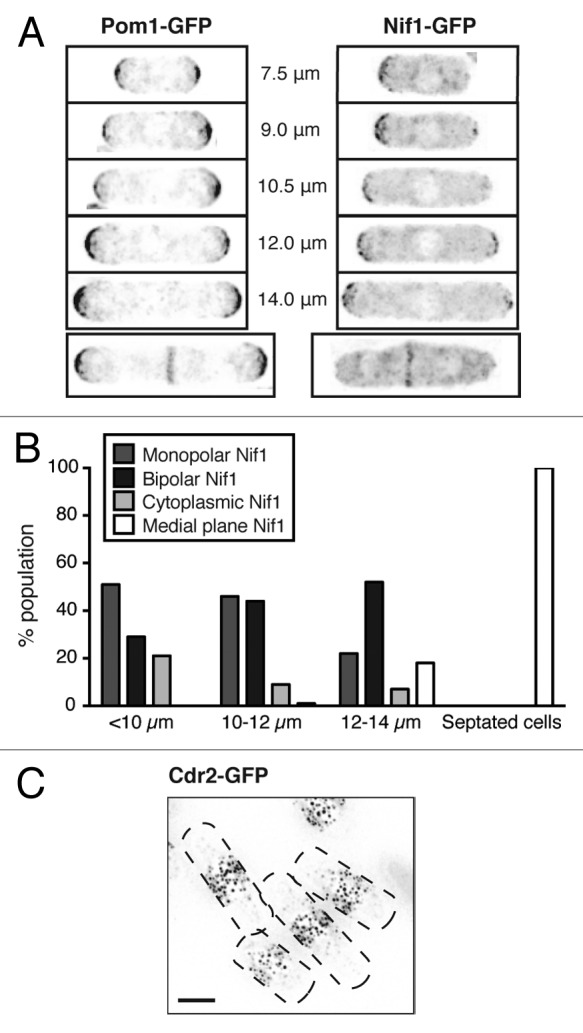
(A) Localization of GFP-tagged protein in cells of indicated size. Inverted maximum intensity projections of deconvolved images. (B) Quantification of Nif1 localization in cells of indicated size. Cytoplasmic Nif1 refers to cells with no visible protein enrichment. All septated cells were 12–14 μm in length. (C) Cdr2-GFP tagged cells showing protein localization to medial cortical nodes. Inverted maximum intensity projection of deconvolved image, cell outlines shown by black dashed lines. Scale bar, 4 μm.
We performed cell length at division analyses on WT, pom1Δ and nif1Δ populations. To do this we used time-lapse images of over 800 cells growing in microfluidic chambers (Fig. 2A). Cell length at birth and division plus cycle time data was collected from these films, and this enabled us to carry out an analysis of a wild-type population to determine if the growth conditions in these microfluidic chambers adversely affected the cells. For 600 wild-type cells we calculated a value, G, representing the growth rate based on the assumption that growth rate per cell is proportional to cell size: G = E/(BL∙CT), where E is length at septation minus birth length. This value varied around a mean of 0.4 t−1, with a coefficient of variation (CV) of 0.12. We showed that this growth rate value was not significantly affected by the position of a cell in a colony within the chamber. Cells completely surrounded on all sides by other cells had a value only 3.5% higher than those cells on the edge of the colony. We also measured cells over 6–8 h to obtain data for 3 generations of growth in the microfluidic chambers. The growth rate value varied only slightly with time, increasing by about 4% with each successive generation. We conclude that cells were not significantly affected by growth in the microfluidic chambers.
Figure 2.
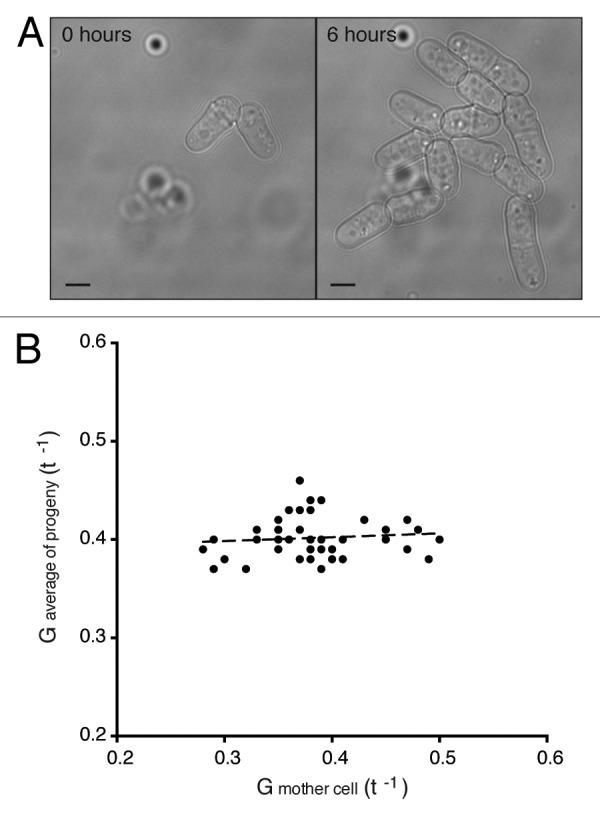
(A) Brightfield images of wild-type cells in a microfluidic chamber after loading (0 h) and then after 6 h of growth in the chamber. Scale bar, 4 μm. (B) Growth rate values of mother cells plotted against the average values calculated for the 14 progeny. G = E/(BL ∙ CT). Regression slope 0.04.
This analysis of growth rate of cells within single lineages also enabled us to determine whether there is heritability in growth rate in successive cell generations. We found no relationship between the growth rate of a single cell compared with the average growth rate of its 14 progeny over 3 generations (Fig. 2B), suggesting that variation in growth rate was not inherited. We confirmed this result by showing that, across the whole population, the difference in growth rate between 2 sister cells was the same as the difference in growth rate between a single sister cell and the average of the population. This data reveals that there was no systematic structure within the population of cell growth rate variability that would influence the interpretation of our cell length studies and cell size homeostasis experiments described in the next sections. It also shows that there is no significant heritability in growth rate within wild-type cell lineages.
We measured cell length at mitosis in wild-type, pom1Δ, and nif1Δ cells. In accordance with previous data,11,12,30 we found that both pom1Δ and nif1Δ mutants entered mitosis prematurely at a small cell size, dividing on average at around 90% of the wild-type length (Table 1). As can be seen from the histogram distributions of cell size at division, pom1Δ cells had greater size dispersion at mitosis, whereas nif1Δ had a distribution of lengths more similar to that of wild-type cells (Fig. 3A). Because Pom1 also has a role in septum positioning, pom1Δ cells often divide asymmetrically,29,31,32 and so we determined the contribution of this asymmetric division to the increased size variability by calculating the coefficient of variation for size at birth as well as at division. The asymmetric divisions create greater size dispersion at birth compared with the wild-type population (Table 1), but if cells were able to sense and correct for this variation, we would expect the size at division to have reduced variability. This was the case for the pom1Δ cells we studied, which had a coefficient of variation of 0.22 at birth and 0.15 at division (Table 1). This suggests that the size dispersion at birth of pom1Δ cells is reduced during the cell cycle. Wild-type and nif1Δ cells had similar size distributions at birth compared with division, as would be expected for symmetrically dividing cells. These data indicate that some size correction is taking place during each cell cycle.
Table 1. Cell length measurements.
| Cell length at birth (μm) | CV | Cell length at division (μm) | CV | ||
|---|---|---|---|---|---|
| WT |
MF |
8.7 |
0.10 |
14.7 |
0.08 |
| LC |
- |
- |
13.6 |
0.05 |
|
|
pom1Δ |
MF |
7.8 |
0.22 |
12.5 |
0.15 |
| LC |
- |
- |
11.9 |
0.15 |
|
|
nif1Δ |
MF |
8.0 |
0.08 |
13.2 |
0.08 |
| LC |
- |
- |
12.2 |
0.07 |
|
|
pom1Δnif1Δ |
MF |
- |
- |
- |
- |
| LC |
- |
- |
11.1 |
0.24 |
|
| cdc13-L-cdc2 |
MF |
9.4 |
0.07 |
16.1 |
0.07 |
| |
LC |
- |
- |
- |
- |
| cdc13-L-cdc2AF |
MF |
8.2 |
0.13 |
13.1 |
0.15 |
| LC | - | - | - | - | |
Average cell length measurements and coefficient of variation (CV) values for the strains indicated. Abbreviations: MF and LC refer to growth conditions used for the measurements. MF, microfluidics (brightfield images); LC, liquid culture (calcofluor-stained cells). For MF, number of cells (N) = 700–900 per strain. For LC, N = 100 per strain.
Figure 3.
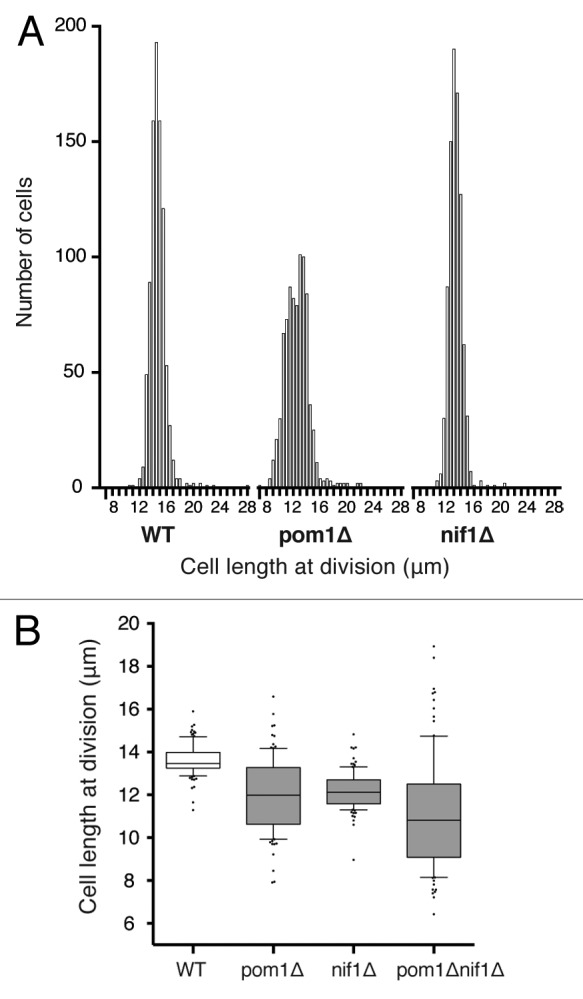
(A) Histogram distribution of cell length at division of wild-type, pom1Δ and nif1Δ cells. For each strain, 800–900 cells were measured in a microfluidic chamber using brightfield images. Bin size 0.5 μm. (B) Cell length at division of WT, pom1Δ, nif1Δ, and pom1Δnif1Δ calcofluor-stained cells. Boxes represent 25–75% of the data and the central lines indicate the median. Whiskers show 10–90% of the data and individual dots represent the outer 20%. One hundred cells of each strain were measured in exponential growth phase.
We checked that the culture conditions for these experiments in microfluidic chambers were not significantly affecting cell morphology by carrying out cell length measurements of 100 cells grown and measured in liquid culture. We observed the same cell length at division reductions in both pom1Δ and nif1Δ mutants (Table 1). However, we were unable to carry out large-scale measurements of the double pom1Δnif1Δ cells, because they often displayed very irregular shapes under time-lapse microscopy in microfluidic chambers. However, our measurements of cells in liquid culture confirmed that the cell length phenotype of pom1Δ and nif1Δ was additive, with cells dividing significantly shorter than either of the single mutants (Fig. 3B).12 The coefficient of variation of the double mutant strain was also significantly greater than either the pom1Δ or nif1Δ populations alone (Table 1).
These data indicate that in the absence of Nif1, the cell size variability at division is not greatly increased, and that in the absence of Pom1, although there is increased cell size variability compared with wild-type due to asymmetric septation, the cell size variability is less at division than at birth, and so cells of both strains are homeostatic. This behavior would not be expected if either Pom1 or Nif1 acted as direct sensors in the mechanism for detecting cell size.
Pom1 and Nif1 are not required for cell size homeostasis
To test the involvement of Pom1 and Nif1 in the cell size-sensing mechanism more directly, we assessed how well cells lacking these proteins could return to a normal size if they were perturbed from the mean. To address this question, we first performed a set of perturbation experiments using the DNA replication inhibitor hydroxyurea. Addition of this drug to cell cultures arrested cells in S phase without affecting cell growth.33 After incubation with the drug for 4 h, cells were extended to around 20–26 μm in length. Upon release from the arrest, we measured cell size at successive cell divisions to observe how rapidly cells recovered to a normal size at division. Wild-type cells released from this cell cycle arrest divided at progressively smaller sizes and returned to their normal size within 2 cell cycles (Fig. 4A). This indicates the presence of an effective homeostatic size correction mechanism that is able to detect the increased size and rapidly return to the correct size. We would expect cells directly defective in the cell size-sensing mechanism to recover to a normal size at a slower rate compared with wild-type, or perhaps not return at all.
Figure 4.
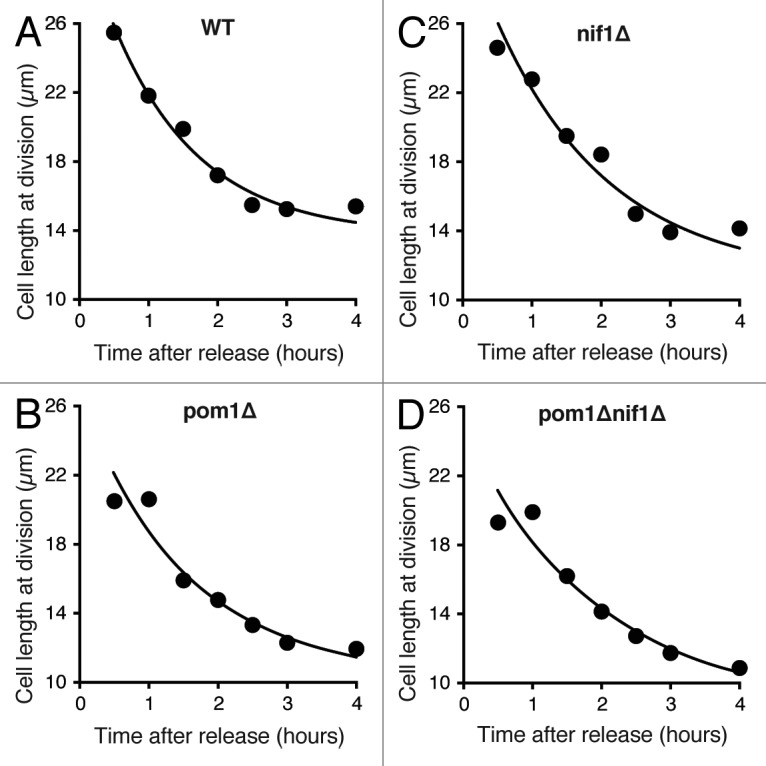
(A–D) Cell length recovery of the indicated strains after elongation with the S phase inhibitor hydroxyurea. HU added for 4 h then washed out at time zero. Average cell length at division was measured for each time point and exponential curves fitted to the data.
This experiment was performed in pom1Δ, nif1Δ, and double pom1Δnif1Δ mutant cell populations. All 3 strains showed the same response as wild-type cells, returning to a normal size at the same rate and within 2 cell cycles after washout of hydroxyurea (Fig. 4B–D). This indicates that these genes have no direct role in the sensing and correction of cell size in enlarged cells. However, this experiment does not enable us to determine if these genes are involved in a size-sensing system to set a minimum cell size for division. In this case, Pom1 and Nif1 would function only in small cells to delay entry into mitosis until the required size has been reached. Such a mechanism would not be operative in cells larger than this threshold.
To test this possibility, we used a cell size homeostasis analysis of wild-type, pom1Δ and nif1Δ cells. The double mutant pom1Δnif1Δ was excluded from this part of the investigation due to the more severe morphological defects of these cells in the microfluidic chambers, as mentioned previously. Time-lapse imaging was used to follow the growth and division of individual cells in a population, exploiting the natural variability in size at cell division. We measured the birth and division length of around 800 cells for each strain investigated, collecting data regarding the cycle time and length extension during the cycle. The average cell cycle times were the same for wild-type, pom1Δ and nif1Δ cells at around 2 h, as expected for the growth conditions used.
Cell length at birth (BL) plotted against length extension during the cycle (E, division length minus birth length) for the wild-type population showed the well-documented relationship: small cells extend more during the cell cycle than long cells to maintain a constant average size at division (Fig. 5A).17,34 This homeostatic mechanism must use information regarding the size of the cell to extend or compress the time spent in G2 accordingly. This would allow the cell to increase or reduce the growth period of any particular cell cycle to rapidly correct for any size deviations that arise. A perfect homeostatic cell size mechanism would result in the BL/E ratio being close to −1, implying that all deviations in size are corrected within one cell cycle. Due to the incompressible period of G2, when the cell must carry out the required processes to prepare for mitosis, cells are not able to achieve such an effective size correction over the entire range of birth lengths that arise.17 In the case of very long cells, correction will be slower and will take more than one cycle due to this minimum period. This can be seen at the inflection points where the BL/E ratio changes.
Figure 5.

(A–C) Cell length at birth plotted against length extension from time-lapse images of around 800 cells for each strain indicated. Data shown excludes the outer 2% of birth length and length extension values. Points show mean value and error bars represent SEM. Regression lines best fitted to the data are shown. (D–F) Same cells as in (A–C) with cycle time plotted against birth length. Data shown excludes the outer 2% of birth length and cycle time values. Mean with error bars showing SEM. Regression lines best fitted to the data are shown.
The slope of the BL/E plot we obtained for wild-type cells was −0.8 (Fig. 5A). This is similar to the previously reported slopes of Fantes17 and Sveiczer et al.,34 although our technique allowed a greater number of cells to be measured, and so we have been able to extend our plot to longer birth lengths. Both pom1Δ and nif1Δ cells showed a wild-type relationship between birth length and length extension, with slopes of −0.8 (Fig. 5B) and −0.7 (Fig. 5C), respectively, indicating that neither of these genes are involved in maintaining size homeostasis. Due to the asymmetrical divisions in the pom1Δ population we were able to analyze a greater distribution of birth lengths for this strain. This enabled us to clearly observe the incompressible G2 period for pom1Δ cells with birth lengths greater than 7 μm. For these cells the slope of −0.18 shows that size deviations will take longer than one cell cycle to be corrected (Fig. 5B).
Figures 5D–F show birth length plotted against cycle time (CT) for the cell populations described above, confirming that the BL/E relationships are a result of altered cycle times rather than altered growth rates. We conclude that the strength of homeostasis, the ability of naturally varied cells in a population to return to the mean, is not significantly changed in pom1Δ and nif1Δ cells compared with wild-type. This indicates that neither Pom1 nor Nif1 are directly involved as sensors of cell size.
We have shown that cells lacking Pom1 and Nif1 have good cell size homeostatic mechanisms. One possible explanation could be that they are controlling their cell size at division through the G1/S size-sensing mechanism followed by a “timer” reflecting the minimum cell cycle time connecting that mechanism to the onset of mitosis. If this were the case then the sizing mechanism at G2/M would be absent. This possibility can be tested, because the G2/M cell size-sensing mechanism is modulated by nutrients in the media. Shifting cells from nitrogen-rich to nitrogen-poor media lowers the G2/M size threshold and therefore accelerates cells through the cell cycle resulting in a peak in the septation index.16 This has been previously demonstrated to be lacking in wee1–50 cells.18 Wild-type, wee1–50, pom1Δ and nif1Δ cells were grown at 25 °C in minimal media containing glutamate as a nitrogen source. Cells were then shifted to the restrictive temperature for 2 cell cycles to inactivate wee1 and then transferred to minimal media containing proline. In the wild-type population a peak in the number of septated cells was seen between 30–60 min of the nitrogen shift-down, confirming the presence of a nutrient-sensitive size threshold at mitosis (Fig. 6A and B). In the wee1–50 population no such peak is observed, since these cells have no G2/M size threshold, rather a G1/S threshold followed by a G2 timer (Fig. 6A and B). Both the pom1Δ (Fig. 6A) and nif1Δ (Fig. 6B) cells showed a peak in septation index similar to that observed in a wild-type population. The slight delay in the pom1Δ peak is most likely due to the cell separation defect seen in these cells. This confirmed the presence of a size threshold at the G2/M transition in both of these mutant populations that is able to respond to changes in nutrient conditions. This result argues against pom1Δ and nif1Δ cells lacking a G2/M size control.
Figure 6.
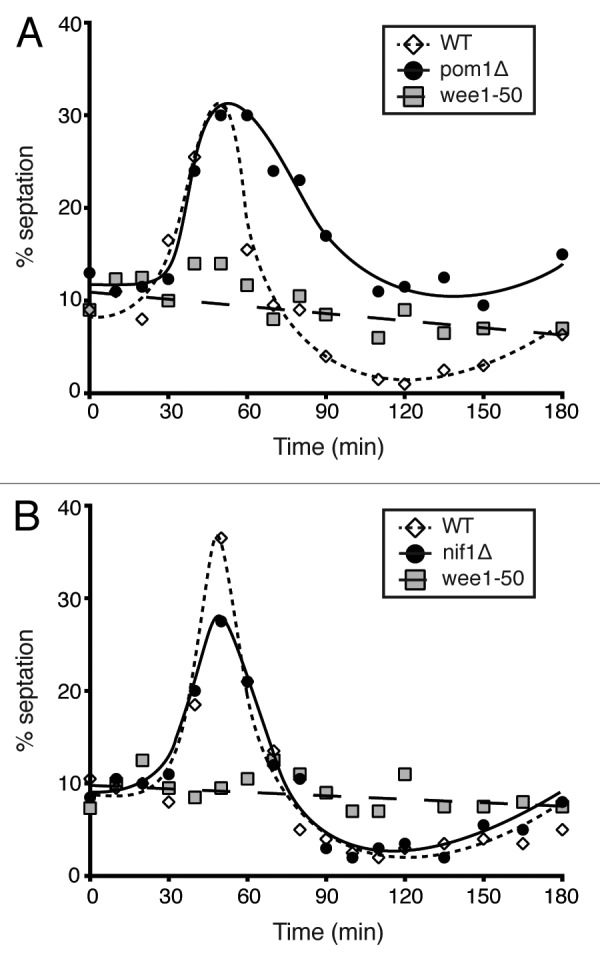
(A) Septation index of a pom1Δ population compared with wild-type and wee1–50 cells after nutritional shift-down from glutamate to proline as a nitrogen source. (B) Experiment as in (A) with nif1Δ cells compared with wild-type and wee1–50 controls. All cells grown at 25 °C in EMM-N + 20 mM glutamic acid and shifted to 36 °C for 2 cycles then transferred at time zero to EMM-N + 10 mM proline. Number of septated cells counted and represented as a percentage of the whole population.
Size homeostasis at G2/M is independent of Cdc2–Tyr15 phosphorylation
So far our data has shown that neither Pom1 nor Nif1 are direct sensors of cell size and are therefore not involved in size homeostasis. We next investigated whether a size-sensing mechanism is perhaps acting through an unknown pathway upstream of wee1 or cdc25, or whether in fact it is independent of Cdc2–Tyrosine15 phosphorylation. To investigate this we used a strain expressing a Cdc13-L-Cdc2 fusion protein, which is characterized in Coudreuse and Nurse.35 We made use of the ability of this fusion protein strain to tolerate a mutant Thr14Ala Tyr15Phe (AF) Cdc2 kinase, rendering the kinase non-phosphorylatable. We used a wild-type fusion protein strain as a control. Both fusion strains were deleted for the wild-type copies of cdc2 and cdc13 in addition to the other 3 mitotic cyclins, cig1, cig2, and puc1.
Histogram distributions of cell size at division showed that the AF fusion protein strain displayed greater size variability compared with the wild-type fusion strain and wild-type cells (Fig. 7A).35 However, despite this increased size variability, BL/E plots for both of the fusion protein strains showed a wild-type relationship, whereby small cells extended more than longer cells in order to maintain a constant size at division (Fig. 7B and C). The slopes for these strains were −0.7 for the fusion protein and −0.9 for the mutant AF strain. We also showed, as before, that this relationship was due to altered cycle times rather than altered growth rates (Fig. 7D and E). We therefore conclude from this data that size homeostasis in fission yeast cells does not appear to be acting through Cdc2–Tyr15 phosphorylation.
Figure 7.

(A) Histogram distribution of cell length at division of wild-type, cdc13-L-cdc2, and cdc13-L-cdc2AF cells. For each strain, 700–900 cells were measured in a microfluidic chamber using brightfield images. Bin size 0.5 μm. (B and C) Cell length at birth plotted against length extension from time-lapse images of around 800 cells for each strain indicated. Data shown excludes the outer 2% of birth length and length extension values. Points show mean value and error bars represent SEM. Regression lines best fitted to the data are shown. (D and E) Same cells as in (BB and CC) with cycle time plotted against birth length. Data shown excludes the outer 2% of birth length and cycle time values. Mean with error bars showing SEM. Regression lines best fitted to the data are shown.
Discussion
Pom1 and Nif1 clearly act as negative regulators of the G2/M transition and have roles in setting a threshold size for entry into mitosis. In this paper we have tested whether they act as direct sensors of cell size through their gradient distribution extending from the ends of the cell. We used 2 approaches, an analysis of cell size variability at mitosis and cell size homeostasis experiments.
Cells deleted for nif1 have wild-type size dispersion at mitosis, suggesting Nif1 does not have a direct role as a sensor of cell size. Cells deleted for pom1, however, have a greater size distribution at mitosis compared with wild-type, which could suggest a role for Pom1 as a cell size sensor. However, the asymmetric division of these cells creates much size variability within a population, and so we cannot conclude that these cells are less homeostatic on this frequency distribution data alone. We found that size distribution in a pom1Δ population is greater at birth than at division, indicating that variability created by the asymmetric division of these cells is significantly corrected within one cell cycle. We therefore conclude that pom1 mutant cells appear to be homeostatic in terms of cell size.
This conclusion is supported by our cell size at division homeostasis experiments using the natural variation of sizes within a population. Time-lapse studies following cells from birth to division enabled us to analyze the degree to which cells are able to correct for deviations in size. We showed that WT, pom1Δ, and nif1Δ cells are all homeostatic; that is, small cells at birth extend more than long cells to maintain a constant size at the subsequent division. This would not be the case if either Pom1 or Nif1 were required for size sensing. The time-lapse experiments also allowed us to conclude that there is no significant heritability in growth rate within wild-type cell lineages.
These results do not support a model whereby a Pom1 and Nif1 gradient act as a direct sensor of cell size. The proposal that Pom1 behaves in this way was based on the cell size phenotype of pom1Δ cells and the tip localization of Pom1 protein. The Pom1 concentration at the middle of cells was proposed to be measured by cortical nodes containing the SAD kinases and activators of mitosis, Cdr1 and Cdr2. This model was supported by data indicating that Pom1 directly phosphorylates and inhibits Cdr2 kinase in a dose-dependent manner, and that length-dependent medial Pom1 concentration is important for the timing of mitotic entry.11,12 From our results presented here, we argue that the Pom1 gradient does not form the major part of a size-sensing mechanism to coordinate cell growth and division. We conclude that although both Pom1 and Nif1 modulate absolute size for mitotic entry, the proteins are not direct sensors of cell size.
One possibility for the role of Pom1 and Nif1 is that these tip-localized proteins are preventing mitosis occurring too near to the cell ends. There is strong evidence to suggest that at high concentrations, such as at the cell tips, Pom1 phosphorylates and inactivates Cdr2 leading to mitotic delay.11,12 This could explain the size dependency of Cdr2 phosphorylation by Pom1 and the role of Pom1 on the restriction of the cortical nodes to the cell middle, yet places less importance on the Pom1 concentration differences in the middle of cells, which has been suggested to play a part in a size-sensing mechanism. Another possibility is that Pom1 and Nif1 are acting alongside other factors as part of a mechanism to sense cell size. We do not think this is likely given the strong relationship between birth length and length extension during the cycle of pom1Δ and nif1Δ cells. Any role these proteins may have in directly sensing cell size would have to be minimal, since it is unlikely that we would see this relationship for any protein playing a major role in a size-sensing mechanism.
We have also shown here that the mechanism of size homeostasis is independent of Cdc2–Tyr15 phosphorylation. Our results indicate that Pom1 is not involved directly in cell size sensing, and also that cell size sensing can occur in the absence of Cdc2–Tyr15 phosphorylation, long considered the primary mechanism for regulating the onset of mitosis. This means that cell size sensing can operate through an as-yet-unidentified mechanism, which interacts with CDK regulation by an as yet unidentified pathway. In this context it is important to note that there are at least 3 genes which have been found to advance cells into mitosis independently of Tyr15 phosphorylation in fission yeast.28 Perhaps these genes, snf5, sol1, and zfs1, could form part of additional regulation acting on the CDK at the G2/M transition, with a role in maintaining size homeostasis through a sensing and correction mechanism.
Materials and Methods
Yeast strains and growth conditions
S.pombe media and methods used are described in Moreno et al.36 Strains are listed in Table 2. Cells for Figures 1A and B, and 4 were grown at 32 °C in minimal media supplemented with 0.15 mg/ml L-histidine, L-leucine, adenine and uridine (EMM4S). Hydroxyurea (Sigma) was added at a final concentration of 11 mM. Cells for Figure 1C and length measurements for Table 1 and Figures 2, 3, 5, and 7 were from cells growing at 32 °C in yeast extract complex media supplemented with 0.15 mg/ml L-histidine, L-leucine, adenine and uridine (YE4S). Cells were either transferred to an Y04C microfluidic plate (CellASIC) (Figs. 2, 3A, 5 and 7, see below) or measured in liquid culture on a glass slide (Figs. 1C and 3B). Media for Figure 6 was EMM, in which ammonium was replaced by either L-Glutamic acid (20 mM) or L-Proline (10 mM) as a nitrogen source. Cells were grown at 25 °C and shifted to 36 °C for 5 h before the nutrient shift.
Table 2. Yeast strains used in this study.
| Strain | Genotype | Source |
|---|---|---|
| PN3141 |
pom1-GFP::kanMX6 h- |
29 |
| LW138 |
nif1-GFP::hph h- |
This study |
| PN10503 |
cdr2-GFP::kanMX6 ura4-D18 leu1–32 ade6-M21X h- |
38 |
| PN1 |
972 h- |
Lab collection |
| FR495 |
pom1Δ::kanMX6 h+ |
28 |
| FR538 |
nif1Δ::kanMX6 h+ |
28 |
| LW61 |
pom1Δ::kanMX6 nif1Δ::kanMX6 h+ |
This study |
| PN369 |
wee1–50 h- |
Lab collection |
| DC235 |
leu1Δ::Pcdc13::cdc13-L-cdc2::cdc13 3′UTR::ura4+ cdc2Δ::kanMX6 cdc13Δ::natMX6 cig1Δ::ura4+ cig2Δ::ura4+ puc1Δ::ura4+ ura4-D18 h+ |
35 |
| DC276 | leu1Δ::Pcdc13::cdc13-L-cdc2AF::cdc13 3′UTR::ura4+ cdc2Δ::kanMX6 cdc13Δ::natMX6 cig1Δ::ura4+ cig2Δ::ura4+ puc1Δ::ura4+ ura4-D18 h+ | 35 |
Imaging
Gene tagging was performed by PCR and homologous recombination.37 For protein localization, cells were imaged in liquid media under a coverslip using a DeltaVision Elite (Applied Precision) comprised of an Olympus IX71 wide-field inverted fluorescence microscope, a PLAN APO 60× oil, 1.42 NA objective, and a Photometrics CoolSNAP HQ2 camera. The microscope was contained within an IMSOL “imcubator” Environment Control System set at 32 °C. Images were acquired in 0.2 or 0.4 μm Z-sections over 4.8 μm using SoftWoRx (Applied Precision) and processed using SoftWoRx and Huygens. All images are maximum intensity projections of deconvolved images.
Microfluidic cell culture
The ONIX Microfluidic Perfusion System from CellASIC was used for many cell measurements. Microfluidic plates were set up as described here http://www.cellasic.com/ONIX_yeast.html. Fifty μl of cell culture was loaded at a density of 1.26 × 10⁶ cells/ml, and cells were imaged in the 3.5 μm and 4.0 μm chambers. YE4S medium was used, and a flow rate of 3 psi was maintained throughout the experiment. Time-lapse imaging was started 1 h after loading the plate and was performed at 32 °C using the DeltaVision Elite system described above.
Cell length measurements
Images were acquired using the CellASIC Microfluidic system with the DeltaVision Elite (described above) or a Zeiss Axioskop 40 microscope equipped with a 63×/1.4 NA objective and a Zeiss AxioCam MRm camera. Cell length was either measured from brightfield images acquired using the DeltaVision microscope or images of cells stained with calcofluor (Sigma) acquired using the Axioskop microscope. For the size homeostasis analysis cells were only measured during the first 2 generations after loading into the plate. Measurements were taken using the PointPicker plug-in of ImageJ (National Institutes of Health); septated cells were chosen as cells with a visible septum. For the homeostasis experiments, images were acquired at 10 min intervals for 12 h. Cycle time was given as the time interval between the birth and division length measurement.
Acknowledgments
We thank members of our lab for discussions and critical reading of the manuscript, with special thanks to Jacky Hayles and Francisco Navarro. This work was funded by Cancer Research UK, the Wellcome Trust, UK, and The Breast Cancer Research Foundation.
Glossary
Abbreviations:
- CDK
cyclin-dependent kinase
- NETO
New-End-Take-Off
- TOR
Target of Rapamycin
- DYRK
dual-specificity tyrosine-phosphorylation regulated kinase
- GFP
green fluorescent protein
- BL
birth length
- E
length extension
- CT
cycle time
- SEM
standard error of the mean
- CV
coefficient of variation
- WT
wild-type
- MF
microfluidics
- LC
liquid culture
- HU
hydroxyurea
Disclosure of Potential Conflicts of Interest
No potential conflicts of interest were disclosed.
Footnotes
Previously published online: www.landesbioscience.com/journals/cc/article/26462
References
- 1.Schaechter M, Williamson JP, Hood JR, Jr., Koch AL. Growth, cell and nuclear divisions in some bacteria. J Gen Microbiol. 1962;29:421–34. doi: 10.1099/00221287-29-3-421. [DOI] [PubMed] [Google Scholar]
- 2.Killander D, Zetterberg A. Quantitative Cytochemical Studies on Interphase Growth. I. Determination of DNA, Rna and Mass Content of Age Determined Mouse Fibroblasts in Vitro and of Intercellular Variation in Generation Time. Exp Cell Res. 1965;38:272–84. doi: 10.1016/0014-4827(65)90403-9. [DOI] [PubMed] [Google Scholar]
- 3.Killander D, Zetterberg A. A quantitative cytochemical investigation of the relationship between cell mass and initiation of DNA synthesis in mouse fibroblasts in vitro. Exp Cell Res. 1965;40:12–20. doi: 10.1016/0014-4827(65)90285-5. [DOI] [PubMed] [Google Scholar]
- 4.Donachie WD. Relationship between cell size and time of initiation of DNA replication. Nature. 1968;219:1077–9. doi: 10.1038/2191077a0. [DOI] [PubMed] [Google Scholar]
- 5.Nurse P. Genetic control of cell size at cell division in yeast. Nature. 1975;256:547–51. doi: 10.1038/256547a0. [DOI] [PubMed] [Google Scholar]
- 6.Jorgensen P, Tyers M. How cells coordinate growth and division. Curr Biol. 2004;14:R1014–27. doi: 10.1016/j.cub.2004.11.027. [DOI] [PubMed] [Google Scholar]
- 7.Nurse P. The genetic control of cell volume. The Evolution of Genome Size: John Wiley and Sons, 1985:185-96. [Google Scholar]
- 8.Gregory TR. Coincidence, coevolution, or causation? DNA content, cell size, and the C-value enigma. Biol Rev Camb Philos Soc. 2001;76:65–101. doi: 10.1017/S1464793100005595. [DOI] [PubMed] [Google Scholar]
- 9.Turner JJ, Ewald JC, Skotheim JM. Cell size control in yeast. Curr Biol. 2012;22:R350–9. doi: 10.1016/j.cub.2012.02.041. [DOI] [PMC free article] [PubMed] [Google Scholar]
- 10.Marshall WF, Young KD, Swaffer M, Wood E, Nurse P, Kimura A, Frankel J, Wallingford J, Walbot V, Qu X, et al. What determines cell size? BMC Biol. 2012;10:101. doi: 10.1186/1741-7007-10-101. [DOI] [PMC free article] [PubMed] [Google Scholar]
- 11.Moseley JB, Mayeux A, Paoletti A, Nurse P. A spatial gradient coordinates cell size and mitotic entry in fission yeast. Nature. 2009;459:857–60. doi: 10.1038/nature08074. [DOI] [PubMed] [Google Scholar]
- 12.Martin SG, Berthelot-Grosjean M. Polar gradients of the DYRK-family kinase Pom1 couple cell length with the cell cycle. Nature. 2009;459:852–6. doi: 10.1038/nature08054. [DOI] [PubMed] [Google Scholar]
- 13.Hachet O, Berthelot-Grosjean M, Kokkoris K, Vincenzetti V, Moosbrugger J, Martin SG. A phosphorylation cycle shapes gradients of the DYRK family kinase Pom1 at the plasma membrane. Cell. 2011;145:1116–28. doi: 10.1016/j.cell.2011.05.014. [DOI] [PubMed] [Google Scholar]
- 14.Mitchison JM, Nurse P. Growth in cell length in the fission yeast Schizosaccharomyces pombe. J Cell Sci. 1985;75:357–76. doi: 10.1242/jcs.75.1.357. [DOI] [PubMed] [Google Scholar]
- 15.Nurse P, Thuriaux P. Controls over the timing of DNA replication during the cell cycle of fission yeast. Exp Cell Res. 1977;107:365–75. doi: 10.1016/0014-4827(77)90358-5. [DOI] [PubMed] [Google Scholar]
- 16.Fantes P, Nurse P. Control of cell size at division in fission yeast by a growth-modulated size control over nuclear division. Exp Cell Res. 1977;107:377–86. doi: 10.1016/0014-4827(77)90359-7. [DOI] [PubMed] [Google Scholar]
- 17.Fantes PA. Control of cell size and cycle time in Schizosaccharomyces pombe. J Cell Sci. 1977;24:51–67. doi: 10.1242/jcs.24.1.51. [DOI] [PubMed] [Google Scholar]
- 18.Fantes PA, Nurse P. Control of the timing of cell division in fission yeast. Cell size mutants reveal a second control pathway. Exp Cell Res. 1978;115:317–29. doi: 10.1016/0014-4827(78)90286-0. [DOI] [PubMed] [Google Scholar]
- 19.Nurse P, Bissett Y. Gene required in G1 for commitment to cell cycle and in G2 for control of mitosis in fission yeast. Nature. 1981;292:558–60. doi: 10.1038/292558a0. [DOI] [PubMed] [Google Scholar]
- 20.Martin-Castellanos C, Labib K, Moreno S. B-type cyclins regulate G1 progression in fission yeast in opposition to the p25rum1 cdk inhibitor. EMBO J. 1996;15:839–49. [PMC free article] [PubMed] [Google Scholar]
- 21.Russell P, Nurse P. cdc25+ functions as an inducer in the mitotic control of fission yeast. Cell. 1986;45:145–53. doi: 10.1016/0092-8674(86)90546-5. [DOI] [PubMed] [Google Scholar]
- 22.Russell P, Nurse P. Negative regulation of mitosis by wee1+, a gene encoding a protein kinase homolog. Cell. 1987;49:559–67. doi: 10.1016/0092-8674(87)90458-2. [DOI] [PubMed] [Google Scholar]
- 23.Gould KL, Nurse P. Tyrosine phosphorylation of the fission yeast cdc2+ protein kinase regulates entry into mitosis. Nature. 1989;342:39–45. doi: 10.1038/342039a0. [DOI] [PubMed] [Google Scholar]
- 24.Nurse P. Universal control mechanism regulating onset of M-phase. Nature. 1990;344:503–8. doi: 10.1038/344503a0. [DOI] [PubMed] [Google Scholar]
- 25.Lundgren K, Walworth N, Booher R, Dembski M, Kirschner M, Beach D. mik1 and wee1 cooperate in the inhibitory tyrosine phosphorylation of cdc2. Cell. 1991;64:1111–22. doi: 10.1016/0092-8674(91)90266-2. [DOI] [PubMed] [Google Scholar]
- 26.Petersen J, Hagan IM. Polo kinase links the stress pathway to cell cycle control and tip growth in fission yeast. Nature. 2005;435:507–12. doi: 10.1038/nature03590. [DOI] [PubMed] [Google Scholar]
- 27.Petersen J, Nurse P. TOR signalling regulates mitotic commitment through the stress MAP kinase pathway and the Polo and Cdc2 kinases. Nat Cell Biol. 2007;9:1263–72. doi: 10.1038/ncb1646. [DOI] [PubMed] [Google Scholar]
- 28.Navarro FJ, Nurse P. A systematic screen reveals new elements acting at the G2/M cell cycle control. Genome Biol. 2012;13:R36. doi: 10.1186/gb-2012-13-5-r36. [DOI] [PMC free article] [PubMed] [Google Scholar]
- 29.Bähler J, Pringle JR. Pom1p, a fission yeast protein kinase that provides positional information for both polarized growth and cytokinesis. Genes Dev. 1998;12:1356–70. doi: 10.1101/gad.12.9.1356. [DOI] [PMC free article] [PubMed] [Google Scholar]
- 30.Wu L, Russell P. Nif1, a novel mitotic inhibitor in Schizosaccharomyces pombe. EMBO J. 1997;16:1342–50. doi: 10.1093/emboj/16.6.1342. [DOI] [PMC free article] [PubMed] [Google Scholar]
- 31.Celton-Morizur S, Racine V, Sibarita JB, Paoletti A. Pom1 kinase links division plane position to cell polarity by regulating Mid1p cortical distribution. J Cell Sci. 2006;119:4710–8. doi: 10.1242/jcs.03261. [DOI] [PubMed] [Google Scholar]
- 32.Padte NN, Martin SG, Howard M, Chang F. The cell-end factor pom1p inhibits mid1p in specification of the cell division plane in fission yeast. Curr Biol. 2006;16:2480–7. doi: 10.1016/j.cub.2006.11.024. [DOI] [PubMed] [Google Scholar]
- 33.Mitchison JM, Creanor J. Induction synchrony in the fission yeast. Schizosaccharomyces pombe. Exp Cell Res. 1971;67:368–74. doi: 10.1016/0014-4827(71)90421-6. [DOI] [PubMed] [Google Scholar]
- 34.Sveiczer A, Novak B, Mitchison JM. The size control of fission yeast revisited. J Cell Sci. 1996;109:2947–57. doi: 10.1242/jcs.109.12.2947. [DOI] [PubMed] [Google Scholar]
- 35.Coudreuse D, Nurse P. Driving the cell cycle with a minimal CDK control network. Nature. 2010;468:1074–9. doi: 10.1038/nature09543. [DOI] [PubMed] [Google Scholar]
- 36.Moreno S, Klar A, Nurse P. Molecular genetic analysis of fission yeast Schizosaccharomyces pombe. Methods Enzymol. 1991;194:795–823. doi: 10.1016/0076-6879(91)94059-L. [DOI] [PubMed] [Google Scholar]
- 37.Bähler J, Wu JQ, Longtine MS, Shah NG, McKenzie A, 3rd, Steever AB, Wach A, Philippsen P, Pringle JR. Heterologous modules for efficient and versatile PCR-based gene targeting in Schizosaccharomyces pombe. Yeast. 1998;14:943–51. doi: 10.1002/(SICI)1097-0061(199807)14:10<943::AID-YEA292>3.0.CO;2-Y. [DOI] [PubMed] [Google Scholar]
- 38.Morrell JL, Nichols CB, Gould KL. The GIN4 family kinase, Cdr2p, acts independently of septins in fission yeast. J Cell Sci. 2004;117:5293–302. doi: 10.1242/jcs.01409. [DOI] [PubMed] [Google Scholar]