

Abstract
Purpose
To evaluate the correlation between changes in tear osmolarity, symptoms, and corneal fluorescein staining in patients with dry eye disease (DED).
Design
Retrospective, clinic-based cohort study.
Methods
In this single-institution study, we reviewed the charts of 186 patients with DED from whom we had data on tear osmolarity, symptoms, and corneal fluorescein staining from two separate visits. Main outcomes included the correlation of the changes between the two visits for tear osmolarity (TearLab® system), symptoms (Ocular Surface Disease Index© [OSDI]), and corneal fluorescein staining (modified Oxford scheme). For tear osmolarity and corneal fluorescein staining the scores from the eye with highest readings were analyzed. The correlations were repeated on subgroups based on proposed cutoffs for DED severity and on patients’ treatment.
Results
We found a modest, though statistically significant, correlation between changes in corneal fluorescein staining and symptoms of DED (R = .31; P < .001). However, there was no correlation between the recorded change in tear osmolarity and symptoms (R = −.091; P = .38) or between changes in tear osmolarity and corneal fluorescein staining (R = −.02; P = .80). This lack of correlation was consistent in all the subgroups studied. A multivariate analysis revealed that changes in corneal fluorescein staining had predictive value on symptom changes, while tear osmolarity changes did not.
Conclusions
Changes in tear osmolarity do not correlate significantly with changes in patient symptoms or corneal fluorescein staining in dry eye disease.
Introduction
Dry eye disease (DED) is one of the most prevalent causes for ophthalmic consultation in the developed world. It is reported that 5 to 35 percent of the general population suffers from moderate to severe DED, and the prevalence increases with age.1 DED presents in patients of all ages and both sexes, although it is more prevalent among older women.1 Diagnosis and follow-up of DED are complex and are based on a combination of patient-reported symptoms and a series of clinical tests. However, most of these tests have shown a lack of consistency in assessing the disease, and are always subject to clinical interpretation.2 Indeed, none of the available tests used to date for the diagnosis and follow-up of DED have demonstrated very high reliability.
Tear hyperosmolarity is recognized as a significant pathophysiologic factor in the ocular surface disease suffered by patients with DED.1,3 Subjects with clinically diagnosed DED present with higher tear osmolarity levels than normal controls, and these levels reportedly increase with the severity of the disease.4 Until recently, tear osmolarity quantification was restricted to research endeavors given the technical difficulties it involved, such as rapid evaporation of the samples and the need for equipment limited to laboratory facilities. With the advent of the TearLab® Osmolarity System (TearLab Corp., San Diego, CA), approved by the Food and Drug Administration for assessment of DED in 2009, in-clinic evaluation of tear osmolarity has become readily available. Several clinical studies using the TearLab® osmometer have shown that this method of quantifying tear osmolarity is a reliable diagnostic tool for DED. However, in spite of the increasing availability of the osmometer in the clinical setting, ocular surface staining and patient-reported symptoms remain the main criteria used by clinicians and clinical trial experts to assess DED severity and progression. One reason may be that very few data are available to assess the correlation between change in tear osmolarity and other indicators of disease severity, such as patient symptoms or degree of corneal fluorescein staining. Such relationships could be important for assessment of the natural history of DED as well as response to treatment.
In this study, we evaluated changes in corneal fluorescein staining and symptoms among patients with a diagnosis of DED between two separate visits, and assessed their correlation with changes in tear osmolarity.
Methods
We conducted a single-center, retrospective study that involved a systematic chart review of patients with DED. In this study, we evaluated the correlation between changes in tear osmolarity and changes in signs and symptoms of DED. This study was conducted at the Cornea Service of the Massachusetts Eye and Ear Infirmary, Boston, MA, with the approval of the Human Studies Committee, and adherence to the tenets of the Declaration of Helsinki.
We included patients 18 years and older with a previous diagnosis of DED, who had continued presence of dry eye symptoms and corneal fluorescein staining, and for whom we had data for at least two of the following: symptoms, represented by Ocular Surface Disease Index© (OSDI, Allergan, Inc., Irvine, CA), corneal fluorescein staining, and tear osmolarity (TearLab® Osmolarity System, TearLab Corp., San Diego, CA) from two visits. We excluded those with a history of microbial keratitis, atopic eye disease, corneal transplantation, or contact lens use in either eye.
Patients’ symptoms were measured by self-response to the OSDI questionnaire.5 Tear osmolarity from both eyes was obtained and the higher reading of the two eyes was used for the analysis, as recommended by the manufacturer and the labeling of the device. Tear osmolarity acquisition was the first clinical assessment performed during the clinical visit. For this, a trained technician placed the TearLab® osmometer probe on the inferior lateral tear meniscus until a signal was heard, and immediately proceeded to analyze the sample. We included cases in which we were able to obtain readings from both eyes, or if the reading from one eye was “below range”, to ensure that we obtained the higher reading of both eyes (valid tear osmolarity readings could not be obtained, from one or both eyes, in 23 patients). Following the measurement of osmolarity, fluorescein was added to the ocular surface and evaluated after three minutes using the modified Oxford scheme.6 Corneal fluorescein staining from the most severely affected eye was used for analyses (regardless it was the same eye with higher tear osmolarity) to reveal the greatest degree of disease involvement at the time measured. We also correlated the changes among the three parameters (from the study’s overall population) using tear osmolarity and corneal fluorescein staining from the same eye: (1) the eye with higher tear osmolarity, and (2) the eye with the highest corneal fluorescein staining.
Statistical analysis
We used the Pearson or Spearman coefficients to analyze the correlation between the changes in tear osmolarity, corneal fluorescein staining, and symptoms at two separate visits. Additionally, we investigated this correlation in the cases that met the criteria (cutoff) for dry eye proposed by Miller et al. for symptoms (OSDI >12), and by Lemp et al. for tear osmolarity (>308 mOsm).7,8 We then performed the paired correlations in a subgroup of patients who experienced the ‘minimal clinically important difference’ reported by Miller et al., for mild to moderate DED (improvement or worsening of symptoms of ≥4.5 OSDI units).7 Next, we assessed the change for corneal fluorescein staining and tear osmolarity, in patients who experienced the ‘minimal clinically important difference’ reported for severe DED (change of ≥9.9 OSDI units),7 by comparing the mean scores of the two visits using the Wilcoxon’s matched pairs test. We further subgrouped patients based on the therapy they received, and investigated the correlation between changes in the three variables measured.
Finally, we performed a multiple linear regression analysis to examine predictors of the change in OSDI (dependent variable), using the baseline OSDI score and either the changes in corneal fluorescein staining or tear osmolarity as independent variables. A value of P < .05 was considered statistically significant.
Results
We analyzed data on 186 subjects who met our inclusion criteria, with a mean time between the two visits of 137±95 days. The mean age of patients was 54±15 years, and 66% of the subjects were female. Across the entire study population, the mean OSDI, corneal fluorescein staining, and tear osmolarity changes were −2.3±21.9, −0.5±1.4 and 1.1±23.6, respectively. Table 1 depicts a summary of the baseline values and changes for each variable, including a subdivision by patients who improved or worsened.
Table 1.
Summary of baseline and change values of the studied dry eye disease parameters
| Variable | All subjects (mean±sd) | Improved (mean±sd) | Worsened (mean±sd) |
|---|---|---|---|
| OSDI score at baseline | 44.7±23.1 | 51.4±23.2 | 35.8±18.6 |
| OSDI change | −2.3±21.9 | −17.3±14.2 | 16.1±15.3 |
| CFS score at baseline | 1.7±1.2 | 2.4±1.1 | 0.9±0.8 |
| CFS change | −0.5±1.4 | −1.4±0.9 | 1.2±0.6 |
| Osmolarity score at baseline | 312.8±20.3 | 323.7±17.7 | 302.3±14.7 |
| Osmolarity change | 1.1±23.6 | −17.7±14.4 | 18.5±16.9 |
sd, standard deviation; OSDI, Ocular Surface Disease Index©; CFS, corneal fluorescein staining.
There was a statistically significant, though modest, correlation between the changes in corneal fluorescein staining and OSDI (R = .31; P < .001). However, there was no statistically significant correlation between the recorded change in tear osmolarity and OSDI (R= −.091; P = .38), or between changes in tear osmolarity and corneal fluorescein staining (R = −.02; P = .80) (Table 2; Fig. 1).
Table 2.
Summary of correlations amongst studied variables in patients with dry eye disease
| Number of cases | Mean age | Gender | Mean TOsm* value at baseline | Mean CFS value at baseline | Mean OSDI value at baseline | Coefficient of correlation | P value | |
|---|---|---|---|---|---|---|---|---|
| All cases | ||||||||
| CFS-OSDI | 146 | 53±15 | F (64%) | - | 1.8±1.2 | 45.3±23.0 | 0.31 | <0.001 |
| TOsm-CFS | 135 | 54±15 | F (64%) | 312.1±19.3 | 1.6±1.2 | - | −0.02 | 0.80 |
| TOsm-OSDI | 97 | 53±14 | F (60%) | 312.8±19.5 | - | 43.0±21.8 | −0.091 | 0.38 |
| OSDI >12 | ||||||||
| CFS-OSDI | 138 | 53±15 | F (64%) | - | 1.8±1.2 | 47.5±21.7 | 0.30 | <0.001 |
| TOsm-CFS | 94 | 53±15 | F (62%) | 312.2±19.4 | 1.6±1.2 | - | 0.02 | 0.84 |
| TOsm-OSDI | 90 | 52±14 | F (61%) | 312.6±19.3 | - | 45.8±20.1 | −0.10 | 0.36 |
| TOsm > 308* | ||||||||
| CFS-OSDI | 66 | 53±13 | F (64%) | - | 1.8±1.1 | 45.3±21.6 | 0.35 | 0.005 |
| TOsm-CFS | 71 | 53±14 | F (63%) | 326.5±13.7 | 1.8±1.2 | - | −0.07 | 0.59 |
| TOsm-OSDI | 53 | 52±13 | F (57%) | 326.8±13.3 | - | 42.8±19.9 | 0.003 | 0.98 |
| MCID OSDI (>4.5) | ||||||||
| CFS-OSDI | 66 | 56±15 | F (61%) | - | 1.7±1.2 | 36.7±17.8 | 0.46 | <0.001 |
| TOsm-CFS | 35 | 52±14 | F (57%) | 315.5±19.0 | 1.6±1.0 | - | −0.09 | 0.58 |
| TOsm-OSDI | 37 | 54±15 | F (59%) | 315.8±19.4 | - | 37.6±18.7 | −0.12 | 0.47 |
mOsm/l. TOsm, tear osmolarity; OSDI, Ocular Surface Disease Index©; CFS, Corneal fluorescein staining; MCID, minimal clinically important difference.
Figure 1. Correlations of changes in tear osmolarity, corneal fluorescein staining, and symptoms among all studied subjects with dry eye disease.
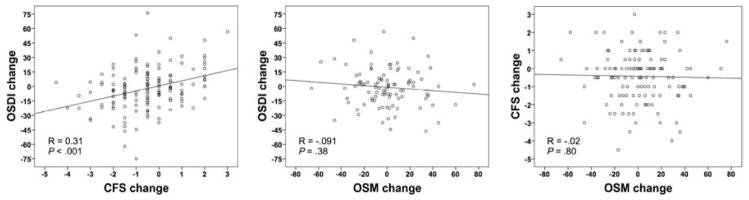
Correlation between changes in symptoms and corneal fluorescein staining (Left). Correlation between changes in symptoms and tear osmolarity (Center). Correlation between changes in corneal fluorescein staining and tear osmolarity (Right). OSDI, Ocular Surface Disease Index©; CFS, corneal fluorescein staining; OSM, tear osmolarity.
When we assessed the level of correlation between changes in corneal fluorescein staining and tear osmolarity from the same eye, we found no significant correlation when selecting either the eyes with higher tear osmolarity (R = .02; P = .78), or with higher corneal fluorescein staining (R = −.11; P = .21) from each patient at baseline.
OSDI >12 is believed to signify patients with “ocular surface disease”.7 By limiting our analysis to this group of patients (OSDI >12 at baseline), we noted a statistically significant, though modest correlation between changes in corneal fluorescein staining and OSDI (R = .30; P < .001). However, in the same group of patients, we did not find a significant correlation between change in tear osmolarity and changes in OSDI (R = −.10; P = .36) or corneal fluorescein staining (R = .02; P = .84) (Table 2; Fig. 2).
Figure 2. Correlations of changes in tear osmolarity, corneal fluorescein staining, and symptoms in patients with dry eye disease with an Ocular Surface Disease Index score of >12 at the initial visit.
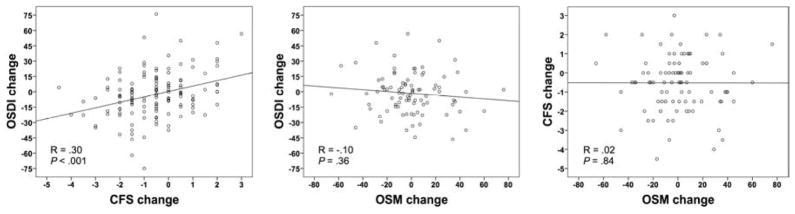
Correlation between changes in symptoms and corneal fluorescein staining (Left). Correlation between changes in symptoms and tear osmolarity (Center). Correlation between changes in corneal fluorescein staining and tear osmolarity (Right). OSDI, Ocular Surface Disease Index©; CFS, corneal fluorescein staining; OSM, tear osmolarity.
A tear osmolarity value >308 is recommended to be used as a threshold for the most sensitive detection of DED.8 In this subset of patients, there was a modest though statistically significant correlation between changes in corneal fluorescein staining and OSDI (R = .35; P = .005). However, there was no statistically significant correlation between tear osmolarity and OSDI changes (R = .003; P = .98), or between tear osmolarity and corneal fluorescein staining changes (R = −.07; P = .59) (Table 2; Fig. 3). When we analyzed only patients with tear osmolarity >314 mOsm/L at baseline (meant to represent the most specific threshold to detect DED)8 the findings were similar to those with >308 mOsm/L; there was a statistically significant correlation between changes in corneal fluorescein staining and OSDI (R = .29; P = .04), whereas no significant correlation was present between change in tear osmolarity and OSDI (R = .09; P = .59), or between tear osmolarity and corneal fluorescein staining (R = −.11; P = .44).
Figure 3. Correlations of changes in tear osmolarity, corneal fluorescein staining, and symptoms in patients with dry eye disease and a tear osmolarity value of >308 mOsm/L in the eye with the higher reading at the initial visit.
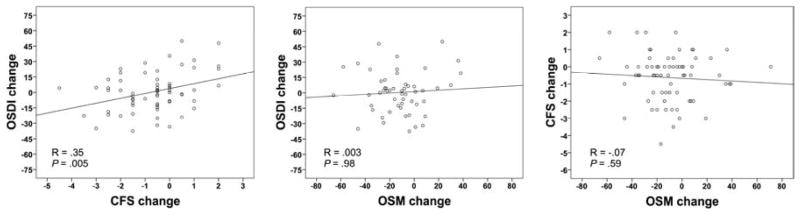
Correlation between changes in symptoms and corneal fluorescein staining (Left). Correlation between changes in symptoms and tear osmolarity (Center). Correlation between changes in corneal fluorescein staining and tear osmolarity (Right). OSDI, Ocular Surface Disease Index©; CFS, corneal fluorescein staining; OSM, tear osmolarity.
When we analyzed the subset of cases in whom there was at least a ‘minimal clinically important difference’ in symptoms of DED (≥4.5 OSDI units),7 the positive correlation between changes in corneal fluorescein staining and OSDI was higher than that observed in the total cohort (R = .46; P < .001). In contrast, there was still no statistically significant correlation between change in tear osmolarity and either OSDI (R = −.12; P = .47), or corneal fluorescein staining (R = −.09; P = .58) (Table 2). The positive and statistically significant correlation between OSDI and corneal fluorescein staining changes was maintained for other ‘minimal clinically important difference’ cutoffs of OSDI, i.e., >7 (for all DED severity categories) and >9.9 (for severe DED). Tear osmolarity changes did not show a significant correlation at any of those cutoffs (data not shown). Interestingly, in patients with ≥9.9 OSDI change (minimal clinically important difference reported by Miller for patients with severe DED), osmolarity scores did not change between the two visits (P = .97). In the same population corneal fluorescein staining scores reflected a statistically significant difference, decreasing by a mean of 0.5 Oxford units or 26% (P < .001).
When divided into treatment subgroups, the correlations between changes in corneal fluorescein staining and OSDI maintained statistical significance (except for topical autologous serum): topical cyclosporine A (n=42, R = .51); topical corticosteroids (n=34, R = .40); topical anakinra (n=43, R = .40); oral tetracycline (n=31, R = .48); topical autologous serum (n=11, R = .17, P = .63). None of the treatment subgroups resulted with a statistically significant correlation between changes in tear osmolarity and corneal fluorescein staining; the highest degree of correlation was achieved in the cyclosporine A treated group (n= 42, R= .11, P = .59). Similarly, the highest degree of correlation between changes in tear osmolarity and OSDI was only .02 (P = .94), as noted in the cyclosporine A treated subgroup (N=42). There was a statistically significant (P =.04) correlation between changes in tear osmolarity and OSDI in the autologous serum-treated subgroup (N=11), but the correlation was negative (R = −.78), suggesting that as OSDI decreased tear osmolarity paradoxically increased.
In the multiple regression analysis for change in OSDI (dependent variable), with baseline OSDI, and either changes in corneal fluorescein staining or tear osmolarity as independent variables, corneal fluorescein staining was significantly associated with OSDI change (R = .49; adjusted R2 = .23; P < .0001 for the model and P < .001 for corneal fluorescein staining change), while tear osmolarity change was not associated with OSDI change (R = .38; adjusted R2 = .12; P = .001 for the model and P = .20 for tear osmolarity change).
Discussion
Over the years, investigators and clinicians have reported on the lack of a strong association between signs and symptoms in dry eye disease. This “quandary,” as it is referred to by Nichols et al.2 represents one of the greatest challenges faced when diagnosing and following patients with dry eye disease, including in clinical trials. Multiple efforts have been made to overcome this challenge, including the development of various symptom assessment questionnaires and compound indexes aimed at achieving an integrated evaluation of the disease.1,4,9,10 Similarly, the advent of tear osmolarity quantification using a standard, easy to administer test, such as the TearLab® Osmolarity System, has been employed as an ancillary test to complement the DED workup. Published studies point to the potential utility of the TearLab® system in the diagnosis of DED, 4,8,16,17 but there is little information about its utility in following patients with DED –specifically about correlation between tear osmolarity changes and other signs and symptoms of the disease.
This retrospective study focused on the correlations among changes in symptoms, corneal fluorescein staining, and tear osmolarity in a population that is a true clinical representation of the spectrum of dry eye seen in a cornea clinic. The present study showed no correlation between tear osmolarity changes and changes in OSDI or corneal fluorescein staining. The results were in accord with our hypothesis, based on clinical observation, that the levels of change in tear osmolarity often do not correlate with changes in either clinical signs or in patients’ reported symptoms.
Additionally, we examined correlations in a series of subgroups, based on previously reported OSDI and tear osmolarity cutoffs to better identify patients with DED, and in cases in which a minimal clinically important difference in symptoms had occurred.7,8 We repeated the correlations within these subgroups on the premises that more severe scores may lead to larger changes over time. These analyses resulted in findings similar to the original cohort, with no correlation between measured changes in tear osmolarity and the changes in either OSDI or corneal fluorescein staining, even when the cases were categorized by level of tear osmolarity (mild or severe DED), by the level of symptoms at baseline, or by a minimal clinically important change in OSDI. When we analyzed patients with an OSDI change of ≥9.9, there was lack of statistical significant change in tear osmolarity between baseline and follow-up visits, suggesting that tear osmolarity was unable to detect differences in the subgroup with largest OSDI change.
Multiple linear regression analyses of our data also showed that changes in tear osmolarity do not contribute to the prediction of symptom changes; in contrast, changes in corneal fluorescein staining contributed to the prediction of symptoms changes in a statistically significant manner. Indeed, when we analyzed the cases with the highest scores to begin with or with greatest change, correlations between corneal fluorescein staining and OSDI changes became stronger.
We propose that there are various possible reasons why this study (unlike several others)2,11,12 shows a correlation between corneal fluorescein staining and OSDI. First, in this study we exclusively focused on the changes experienced, rather than on the variables’ absolute values at a given point in time. We used only corneal fluorescein staining from the most severely affected eye as an indicator of corneal epitheliopathy, postulating that patients would be more prone to perceive and generalize their symptoms based on their most affected eye.
Tear osmolarity values are reported to be highly variable in patients with dry eye disease and indeed this high variability has been proposed as one of the hallmarks of the disease.8,13–15 In this study, we used only the higher tear osmolarity reading of the two eyes, following the manufacturer’s recommendations, and in general accord with the methodology used in previous publications.4,8,14 It is worth mentioning that, in some cases, the scores in both eyes of the same individual were very different, e.g., with one eye above and the other below the suggested DED cutoffs. In an attempt to understand the trends of tear osmolarity scores among the population studied, we reviewed the proportion of eyes that showed tear osmolarity change, and the trend of change in relation to changes in OSDI and corneal fluorescein staining. We found that tear osmolarity increased or decreased between the two visits regardless of symptoms and corneal staining change (Fig. 4). Previous studies using the TearLab® Osmolarity System have primarily focused on the capacity of tear osmolarity to distinguish between subjects with and without DED –that is as a tool for diagnosis of dry eye.1,4,8,16,17 Most of those studies concur on the tear osmolarity values suggestive of DED. Alternatively, some studies have reported higher tear osmolarity values in normal subjects when compared to subjects with DED,18,19 or to the reported cutoffs for DED patients.15 Fewer studies have focused on the performance of this test in populations already diagnosed and under treatment for DED, or under regular (and non-study-like) circumstances in the clinic, and the real potential of this parameter to enhance clinical follow-up of the disease, as was done in our study.
Figure 4. Dry eye disease cases distributed by corneal fluorescein staining and symptoms improvement/worsening in respect to tear osmolarity change.

Top panel shows the changes of tear osmolarity in respect to changes in corneal fluorescein staining. Central panel shows the changes of tear osmolarity in respect to changes in symptoms. Bottom panel shows the changes of tear osmolarity in cases in which both symptoms and corneal fluorescein staining worsened or improved, respectively. The bars represent the percentage of cases. Light colored bars represent the cases in which there was a decrease in tear osmolarity. Dark colored bars represent the cases in which tear osmolarity increased. Stripped pattern bars represent cases with no change. OSDI, Ocular Surface Disease Index©; CFS, corneal fluorescein staining.
Many variables complicate tear osmolarity analyses. A number of variable conditions are possible, in a day-to-day clinic scenario, e.g., patients may be evaluated at different times of the day, after driving for different periods of time, after spending the day inside an air-conditioned facility, or simply after reading for varied time spans in the waiting room before their evaluations. Intra-individual, inter-eye, intra-observer, and inter-observer variability of tear osmolarity measurements have also been reported.8,13,15 In fact, variations of up to 89 mOsm/L have been reported on samples taken (by two observers) from the same control buffered solution using the TearLab® Osmolarity System.13
Limited data are available regarding tear osmolarity variation in patients with DED, with respect to changing environmental conditions, tear reflex, use of topical or systemic medications, seasonal variations, etc. Furthermore, studies have also addressed the increase in reliability of tear osmolarity, when three samples are averaged.13 However to do this in the clinic is often not very practical for many practitioners as it significantly increases the test’s expenses. Based on the reported variability of tear osmolarity readings in controlled circumstances, we could speculate that variable conditions (e.g., variable amounts or quality of meibum, tear reflex, air flow and other stimuli) may affect the tear sample composition, and hence its osmolarity. Interestingly, Saleh et al. reported that patients with epiphora have significantly lower tear osmolarity than normal controls, which may support the possibility of a ‘diluting’ effect from the tear reflex on the tear meniscus and, thus, on the osmolarity reading.20
Some studies have failed in their attempt to find an association between corneal fluorescein staining and treatment for dry eye disease.14 The lack of specificity of corneal fluorescein staining has been proposed as a possible reason.14 Our group has demonstrated the relationship between corneal fluorescein staining and the inflammatory status of the ocular surface in experimentally induced DED.21–23 These data demonstrate that DED induces corneal fluorescein staining and, more importantly, that effective treatment significantly reduces it. The results from the present study support the experimental data suggesting a more significant (though still very modest) correlation between corneal staining and dry eye symptoms than sometimes suggested. The changes in signs and symptoms may be more intimately related than their absolute values at a given time. Both corneal staining and symptoms have been historically measured in a very unspecific manner. More standardized, accurate, and repeatable methods for measuring corneal fluorescein staining and symptoms may further strengthen this correlation. Corneal fluorescein staining and symptoms are less likely to change acutely than is tear osmolarity. For example, patients might report symptoms from previous days, even when their symptoms had changed within the past hour. Similarly, unlike tear osmolarity, corneal fluorescein staining does not typically increase or decrease substantially in a short period of time.
One principal limitation of this study was the variability of the time elapsed between the two visits. However, this is typical in a representative clinical cohort. Moreover, our rationale was that whatever factor affected one variable, must have affected the others, and their change should be, at least in theory, parallel in trend among variables. Seeing parallel change between two variables, and unparalleled change of a third would mean that this variable is not as correlated with the other two, since the three were exposed to the same conditions and measured at the same time. Another confounding factor in the study was related to the variability in treatments that patients were using for DED. Finally, we were not able to control for patients’ environmental exposure previous to their evaluation. Paradoxically, these limitations bring to the study a realistic scenario, with multiple variables that will affect any test, making patent the difficulties and challenges of DED follow-up with the currently available methods, including tear osmolarity evaluation.
It is important however, not to overstate the modest correlation observed between change in symptoms and change in corneal fluorescein staining. Dry eye disease, like many other chronic diseases (e.g., arthritis, inflammatory bowel disease, multiple sclerosis, etc.) is multifactorial, and it is likely unrealistic to expect any one clinical sign, or biomarker, to correlate highly with patient symptomatology.24–28 It very well may be that a combination of clinical variables including measurement of surface epitheliopathy/staining, along with various biomarkers, will be the most reliable prognosticator for response to therapy as has been suggested by several investigators.1,11,14
In conclusion, we believe that the results from this study provide new insights into the potential limitations of tear osmolarity measurement as a prognosticator or as a follow-up biomarker in patients with dry eye disease in a ‘classic’ clinical scenario. The preponderance of currently available data suggest that tear osmolarity measurement can in fact aid in the diagnosis of DED with good sensitivity and specificity,8,29 and our data do not refute this. However, our data suggest that tear osmolarity measurements have significant limitations in prospective follow-up of patients as a marker of whether patients are doing “clinically better” or not. In contrast, changes in corneal fluorescein staining appear to have a higher correlation with symptom changes than is currently believed, and this should warrant further investigation, especially as more precise and automated measures are being developed to measure surface epitheliopathy.
Table 3.
Proportion of dry eye disease patients in each treatment category
| Treatment | Percentage of patients |
|---|---|
| Lubricants | 100% |
| Topical cyclosporine A | 23% |
| Topical anakinra | 23% |
| Topical corticosteroids | 18% |
| Oral tetracycline | 17% |
| Topical autologous-serum | 6% |
Acknowledgments
Supported in part by Grant K24 EY019098 from the National Institutes of Health, Bethesda, Maryland. RD is consultant to Alcon, Allergan, Bausch and Lomb, Eleven Biotherapeutics, Genentech, Google, Kala, and Novabay. He holds equity at Eleven Biotherapeutics. Contributions of Authors: Design of study (FA, RD); Conduct of study (FA, JY, RD, PH); Collection of data (FA, JY); Management, analysis, and interpretation of data (FA, JY, RD, DS, PH); Preparation and review of manuscript (FA, JY, RD, DS, PH). The authors thank Leila Smaga and the members of the Cornea Research Department, Massachusetts Eye & Ear Infirmary, for their invaluable support in study management.
Biographies

Reza Dana, MD, MPH, MSc holds the Claes Dohlman Chair in Ophthalmology at Harvard Medical School. He is Director of the Cornea Service at the Massachusetts Eye and Ear, Senior Scientist at the Schepens Eye Research Institute, Vice Chairman of Ophthalmology for Academic Programs at the Harvard Department of Ophthalmology, and Director of the Harvard Medical School Cornea Center of Excellence. Dr. Dana has authored over 200 peer-reviewed articles and over 80 reviews and book chapters, in the areas of corneal and ocular surface inflammation, and regulation of ocular immunity. He is Associate Editor of Investigative Ophthalmology and Visual Sciences, and is on the editorial board of the journals Cornea and The Ocular Surface, among others.

Francisco Amparo, MD, MSc is a cornea specialist and researcher mainly interested in the areas of ocular surface inflammation, corneal neovascularization, dry eye disease, and corneal transplantation. He received his medical degree from the University of Guadalajara, Mexico, and completed his residency training in ophthalmology at the Association to Prevent Blindness Hospital in Mexico City. He completed a fellowship at the Massachusetts Eye & Ear Infirmary and the Schepens Eye Research Institute, Harvard Medical School, Boston, Massachusetts.
Footnotes
All authors have completed and submitted the ICMJE form for disclosure of potential conflicts of interest.
Publisher's Disclaimer: This is a PDF file of an unedited manuscript that has been accepted for publication. As a service to our customers we are providing this early version of the manuscript. The manuscript will undergo copyediting, typesetting, and review of the resulting proof before it is published in its final citable form. Please note that during the production process errors may be discovered which could affect the content, and all legal disclaimers that apply to the journal pertain.
References
- 1.Dry Eye Workshop. 2007 Report of the Dry Eye WorkShop (2007) Ocul Surf. 2007;5:65–204. [Google Scholar]
- 2.Nichols KK, Nichols JJ, Mitchell GL. The lack of association between signs and symptoms in patients with dry eye disease. Cornea. 2004;23(8):762–70. doi: 10.1097/01.ico.0000133997.07144.9e. [DOI] [PubMed] [Google Scholar]
- 3.Li DQ, Chen Z, Song XJ, Luo L, Pflugfelder SC. Stimulation of matrix metalloproteinases by hyperosmolarity via a JNK pathway in human corneal epithelial cells. Invest Ophthalmol Vis Sci. 2004;45(12):4302–11. doi: 10.1167/iovs.04-0299. [DOI] [PubMed] [Google Scholar]
- 4.Sullivan BD, Whitmer D, Nichols KK, et al. An objective approach to dry eye disease severity. Invest Ophthalmol Vis Sci. 2010;51(12):6125–30. doi: 10.1167/iovs.10-5390. [DOI] [PubMed] [Google Scholar]
- 5.Schiffman RM, Christianson MD, Jacobsen G, Hirsch JD, Reis BL. Reliability and validity of the Ocular Surface Disease Index. Arch Ophthalmol. 2000;118(5):615–621. doi: 10.1001/archopht.118.5.615. [DOI] [PubMed] [Google Scholar]
- 6.Bron AJ, Evans VE, Smith JA. Grading of corneal and conjunctival staining in the context of other dry eye tests. Cornea. 2003;22(7):640–50. doi: 10.1097/00003226-200310000-00008. [DOI] [PubMed] [Google Scholar]
- 7.Miller KL, Walt JG, Mink DR, et al. Minimal clinically important difference for the ocular surface disease index. Arch Ophthalmol. 2010;128(1):94–101. doi: 10.1001/archophthalmol.2009.356. [DOI] [PubMed] [Google Scholar]
- 8.Lemp MA, Bron AJ, Baudouin C, et al. Tear osmolarity in the diagnosis and management of dry eye disease. Am J Ophthalmol. 2011;151(5):792–8. doi: 10.1016/j.ajo.2010.10.032. [DOI] [PubMed] [Google Scholar]
- 9.Gulati A, Sullivan R, Buring JE, Sullivan DA, Dana R, Schaumberg DA. Validation and repeatability of a short questionnaire for dry eye syndrome. Am J Ophthalmol. 2006;142(1):125–131. doi: 10.1016/j.ajo.2006.02.038. [DOI] [PubMed] [Google Scholar]
- 10.Mangione CM, Lee PP, Gutierrez PR, Spritzer K, Berry S, Hays RD National Eye Institute Visual Function Questionnaire Field Test Investigators. Development of the 25-item National Eye Institute Visual Function Questionnaire. Arch Ophthalmol. 2001;119(7):1050–8. doi: 10.1001/archopht.119.7.1050. [DOI] [PubMed] [Google Scholar]
- 11.Sullivan BD, Crews LA, Messmer EM, et al. Correlations between commonly used objective signs and symptoms for the diagnosis of dry eye disease: clinical implications. Acta Ophthalmol. 2012 Dec 28; doi: 10.1111/aos.12012. [DOI] [PubMed] [Google Scholar]
- 12.Schein OD, Tielsch JM, Munõz B, Bandeen-Roche K, West S. Relation between signs and symptoms of dry eye in the elderly. A population-based perspective. Ophthalmology. 1997;104(9):1395–401. doi: 10.1016/s0161-6420(97)30125-0. [DOI] [PubMed] [Google Scholar]
- 13.Khanal S, Millar TJ. Barriers to clinical uptake of tear osmolarity measurements. Br J Ophthalmol. 2012;96(3):341–4. doi: 10.1136/bjo.2011.202754. [DOI] [PubMed] [Google Scholar]
- 14.Sullivan BD, Crews LA, Sönmez B, et al. Clinical utility of objective tests for dry eye disease: variability over time and implications for clinical trials and disease management. Cornea. 2012;31(9):1000–8. doi: 10.1097/ICO.0b013e318242fd60. [DOI] [PubMed] [Google Scholar]
- 15.Eperjesi F, Aujla M, Bartlett H. Reproducibility and repeatability of the OcuSense TearLab™ osmometer. Graefes Arch Clin Exp Ophthalmol. 2012;250(8):1201–5. doi: 10.1007/s00417-012-1961-4. [DOI] [PubMed] [Google Scholar]
- 16.Jacobi C, Jacobi A, Kruse FE, Cursiefen C. Tear film osmolarity measurements in dry eye disease using electrical impedance technology. Cornea. 2011;30(12):1289–92. doi: 10.1097/ICO.0b013e31821de383. [DOI] [PubMed] [Google Scholar]
- 17.Versura P, Profazio V, Campos EC. Performance of tear osmolarity compared to previous diagnostic tests for dry eye diseases. Curr Eye Res. 2010;35(7):553–64. doi: 10.3109/02713683.2010.484557. [DOI] [PubMed] [Google Scholar]
- 18.Szalai E, Berta A, Szekanecz Z, Szûcs G, Módis L., Jr Evaluation of tear osmolarity in non-Sjögren and Sjögren syndrome dry eye patients with the TearLab system. Cornea. 2012;31(8):867–71. doi: 10.1097/ICO.0b013e3182532047. [DOI] [PubMed] [Google Scholar]
- 19.Messmer EM, Bulgen M, Kampik A. Hyperosmolarity of the tear film in dry eye syndrome. Dev Ophthalmol. 2010;45:129–38. doi: 10.1159/000315026. [DOI] [PubMed] [Google Scholar]
- 20.Saleh GM, Hussain B, Woodruff SA, Sharma A, Litwin AS. Tear film osmolarity in epiphora. Ophthal Plast Reconstr Surg. 2012;28(5):338–40. doi: 10.1097/IOP.0b013e31825e6960. [DOI] [PubMed] [Google Scholar]
- 21.Okanobo A, Chauhan SK, Dastjerdi MH, Kodati S, Dana R. Efficacy of topical blockade of interleukin-1 in experimental dry eye disease. Am J Ophthalmol. 2012;154(1):63–71. doi: 10.1016/j.ajo.2012.01.034. [DOI] [PMC free article] [PubMed] [Google Scholar]
- 22.Goyal S, Chauhan SK, Zhang Q, Dana R. Amelioration of murine dry eye disease by topical antagonist to chemokine receptor 2. Arch Ophthalmol. 2009;127(7):882–7. doi: 10.1001/archophthalmol.2009.125. [DOI] [PubMed] [Google Scholar]
- 23.Chauhan SK, El Annan J, Ecoiffier T, et al. Autoimmunity in dry eye is due to resistance of Th17 to Treg suppression. J Immunol. 2009;182(3):1247–52. doi: 10.4049/jimmunol.182.3.1247. [DOI] [PMC free article] [PubMed] [Google Scholar]
- 24.Turner D, Griffiths AM, Mack D, et al. Assessing disease activity in ulcerative colitis: patients or their physicians? Inflamm Bowel Dis. 2010;16(4):651–6. doi: 10.1002/ibd.21088. [DOI] [PubMed] [Google Scholar]
- 25.Svege I, Kolle E, Risberg MA. Reliability and validity of the Physical Activity Scale for the Elderly (PASE) in patients with hip osteoarthritis. BMC Musculoskelet Disord. 2012 Feb 21;13:26. doi: 10.1186/1471-2474-13-26. [DOI] [PMC free article] [PubMed] [Google Scholar]
- 26.Campbell RC, Batley M, Hammond A, Ibrahim F, Kingsley G, Scott DL. The impact of disease activity, pain, disability and treatments on fatigue in established rheumatoid arthritis. Clin Rheumatol. 2012;31(4):717–22. doi: 10.1007/s10067-011-1887-y. [DOI] [PubMed] [Google Scholar]
- 27.Novaes GS, Perez MO, Beraldo MB, Pinto CR, Gianini RJ. Correlation of fatigue with pain and disability in rheumatoid arthritis and osteoarthritis, respectively. Rev Bras Reumatol. 2011;51(5):451–5. [PubMed] [Google Scholar]
- 28.Kolbe SC, Marriott M, Walt Av, et al. Diffusion tensor imaging correlates of visual impairment in multiple sclerosis and chronic optic neuritis. Invest Ophthalmol Vis Sci. 2012;53(2):825–32. doi: 10.1167/iovs.11-8864. [DOI] [PubMed] [Google Scholar]
- 29.Tomlinson A, McCann LC, Pearce EI. Comparison of human tear film osmolarity measured by electrical impedance and freezing point depression techniques. Cornea. 2010;29(9):1036–41. doi: 10.1097/ICO.0b013e3181cd9a1d. [DOI] [PubMed] [Google Scholar]