

Abstract
Purpose
To employ 4D-flow MRI for the comprehensive in-vivo analysis of hemodynamics and its relationship to size and morphology of different intracranial aneurysms (IA). We hypothesize that different IA groups, defined by size and morphology, exhibit different velocity fields, wall shear stress and vorticity.
Materials and Methods
4D-flow MRI (spatial resolution=0.99–1.8×0.78–1.46×1.2–1.4mm3, temporal resolution=44–48ms) was performed in 19 IAs (18 patients, age=55.4 ± 13.8 years) with saccular (n=16) and fusiform (n=3) morphology and different sizes ranging from small (n=8, largest dimension=6.2 ± 0.4mm) to large and giant (n=11, 25 ± 7mm). Analysis included quantification of volumetric spatial-temporal velocity distribution, vorticity, and wall shear stress (WSS) along the aneurysms 3D surface.
Results
4D-flow MRI revealed distinct hemodynamic patterns for large/giant saccular aneurysms (Group 1), small saccular aneurysms (Group 2) and large/giant fusiform aneurysms (Group 3). Saccular IA (Groups 1, 2) demonstrated significantly higher peak velocities (p<0.002) and WSS (p<0.001) compared to fusiform aneurysms. Although intra-aneurysmal 3D velocity distributions were similar for Group 1 and 2, vorticity and WSS was significantly (p<0.001) different (increased in Group 1 by 54%) indicating a relationship between IA size and hemodynamics. Group 3 showed reduced velocities (p<0.001) and WSS (p<0.001).
Conclusion
4D flow MRI demonstrated the influence of lesion size and morphology on aneurysm hemodynamics suggesting the potential of 4D-flow MRI to assist in the classification of individual aneurysms.
Keywords: intracranial aneurysms, 4D flow MRI, hemodynamics, WSS, vorticity, velocity
INTRODUCTION
Intracranial aneurysms (IA) are diverse and life threatening conditions, occurring in 3–6% of the population (1,2). Although the annual rupture rate is fairly low, approximately 2% (3) presenting with subarachnoid hemorrhage, there is significant associated morbidity and mortality. Current standard diagnostic methods for risk stratification and therapy planning (surgical intervention versus medical treatment) are based purely on empirical parameters (e.g. patient age, aneurysm anatomy, size, morphology, and location), ruptured or unruptured status, or systemic risk factors for rupture (hypertension, smoking/alcohol abuse or family history) (4,5). These measures provide an incomplete assessment of a complex disease, since aneurysm geometries, flow characteristics, and vessel wall properties can be substantially different for individual aneurysms of similar size and/or risk factors. In addition, intracranial aneurysms typically develop at major bifurcation sites of intracranial vessels suggesting that hemodynamic stress and hence flow patterns in these regions may have influence on pathogenesis.
Identification of new predictive biomarkers regarding risk of aneurysm rupture or disease progression is of interest for risk stratification, improved patient selection and treatment planning. Irregular flow patterns (vortical and helical flow) have been shown to be associated with vascular alterations and may potentially constitute new risk factors (6). Such flow disturbances can induce shear force alterations at the vessel wall, endothelial dysfunction, and thus promote disease progression by creating areas at increased risk for vascular remodeling (6). Therefore, developing new methods to identify these hemodynamic factors may assist in improving the individual characterization of IAs beyond traditional risk factors.
Most studies investigating flow patterns in intracranial aneurysms used computational fluid dynamics (CFD) (6–16) techniques in conjunction with subject-specific geometries extracted from medical images (8,13,17,18). Previous studies on hemodynamics in IA based on CFD simulations have demonstrated the potentials of the methods for the detailed investigation of patient specific flow patterns. All CFD investigations of intracranial aneurysms revealed a wide variety of complex intra-aneurysmal flow patterns that are strongly dependent on patient-specific vascular geometry and thus are not easily predictable by a simple inspection or by extrapolation from idealized models. For example, Cebral et al. (19) investigated 210 aneurysms by using patient specific CFD simulations under pulsatile flow conditions and found that ruptured aneurysms were more likely to have complex and stable flow patterns, concentrated inflow, and small impingement regions compared with unruptured aneurysms. Intra-aneurysmal flow patterns ranged from those that are simple and stable to those that are complex and turbulent.
However, CFD has limitations such as simplification of assumptions concerning blood properties, boundary conditions and vessel properties resulting in an incomplete description of hemodynamics and making CFD a very user dependent method (20) (8,21). In addition, CFD-based WSS estimations remain difficult and may require extremely small mesh sizes at the boundary layer of the CFD geometries (22). Nevertheless, CFD has proved to be a useful tool in a number of previous studies (6–16).
4D flow MR imaging has recently been introduced and combines ECG-synchronized 3D phase-contrast MRI with advanced post-processing strategies for the in vivo assessment of 3D blood flow with full volumetric coverage of the vascular region of interest. 4D flow MRI has been extensively validated in the aorta (23–25) and carotid arteries (26–28). Several groups reported on the successful measurement and analysis of 3D flow patterns in IA phantoms compared to reference methods such as particle image velocimetry measurements and CFD (29–31). Recently, we and others (12,14,32–37) have presented the application of 4D flow MRI for the in vivo evaluation of intra-aneurysmal flow and wall shear stress (WSS) in patient feasibility studies. To date, however, no study has provided a quantitative evaluation of intra-aneurysmal 3D velocity distribution and WSS in a cohort of IA patients to correlate hemodynamics factors with aneurysm size, shape and type.
In this study, we evaluated in-vivo intra-aneurysmal hemodynamics in a cohort of 18 patients with 19 small versus large/giant IAs and saccular versus fusiform morphologies using 4D-flow MRI in order to investigate how differences in hemodynamics depend on shape or size of the aneurysms. We hypothesized that different IA groups, as defined by size (small, large giant) and morphology (saccular, fusiform) inherently exhibit different intra-aneurysmal hemodynamics as quantified by intra-aneurysmal 3D velocity distribution, vorticity, and wall shear stress.
MATERIALS AND METHODS
Study cohort
The study was approved by our Institutional Review Board, and informed consent was obtained from all prospectively recruited patients; five (patients 3, 5, 6, 7, 10) were included by retrospective data analysis and chart review, which was also approved by the IRB. Patient demographics and aneurysm characteristics were recorded and studied using our institution’s electronic medical records and PACS database. An experienced interventional neuroradiologist analyzed aneurysm size, locations, morphologies, ruptured/unruptured status, and thrombus burden utilizing all available cross-sectional CT/MR imaging and DSA (digital subtraction angiography). Intracranial aneurysms were assigned to three groups based on aneurysm size and morphology (Group 1, Group 2 and Group 3) as summarized in Figure 1. Group 1 and Group 2 are different in aneurysm size, Group 1 being the large and giant (largest dimension >10 mm) saccular aneurysms and Group 2 the small (largest dimension <= 10 mm) saccular aneurysms. Group 3 consists of only fusiform aneurysms and could not be further subdivided into small and large/giant, as there were no patients with small fusiform aneurysms.
Figure 1.

Summary of groups of aneurysm with different morphology and size. Group 1 and Group 2 included all saccular aneurysms, subdivided into large/giant and small size, respectively. Group 3 included the giant fusiform aneurysms.
MR Imaging
All measurements were performed on 1.5T and 3T MR systems (3T TRIO & 1.5T Avanto, Siemens, Germany) using time-resolved (CINE) 3D PC MRI with three-directional velocity encoding (4D flow MRI) with the following pulse sequence parameters: spatial resolution = 0.99 – 1.8 mm × 0.78 – 1.46 mm × 1.2 – 1.4 mm, TE = 2.9 – 3.3 ms, flip angle = 15°, TR = 5.5 – 6 ms, temporal resolution = 44 – 48 ms, 3-directional velocity encoding with venc = 70 – 80 cm/s. The acquisition time varied between 12 – 15 min.
Data acquisition was synchronized with the cardiac cycle by prospective ECG gating. The total scan time for the 4D flow MRI was 15–20 minutes. 4D flow data were acquired in an axial oblique 3D volume, which included the IA in the center of the 3D volume. Prior to 4D flow MRI, 3D multi slab TOF imaging (TR = 21 ms, TE = 3.8 ms, flip angle = 25°, spatial resolution = 0.6 × 0.6 × 0.6 mm3) and T1-weighted sagittal MPrage (TR = 1900 ms, TE = 2.52 ms, TI = 900 ms, flip angle = 9°, spatial resolution 1 × 1 × 1 mm3) was performed to localize the IA for the 4D flow scan.
Data Analysis
All data analysis was performed with self-written Matlab (The Mathworks, USA) code based on methods by Bock et al. (38) for data preprocessing or Stalder et al. (23) for the calculation of WSS. For the visualization of the 3D blood flow commercial software (EnSight, CEI, USA) was used as illustrated in the workflow graph in Figure 2. Statistical analysis was performed in Matlab and MS Excel (Microsoft Office Professional Plus 2010, Microsoft Corporation, USA).
Figure 2.
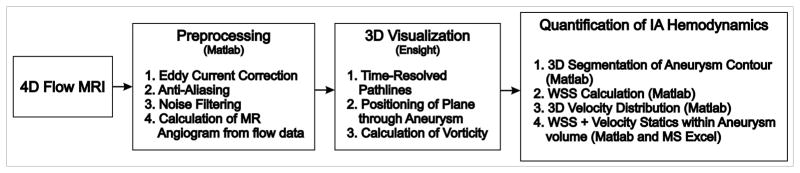
Workflow of 4D-Flow MRI data analysis.
Pre-Processing and 3D Blood Flow Visualization
4D Flow MRI data was preprocessed to correct for aliasing, eddy currents and background noise as described previously (38). Next, an MR angiogram was calculated by taking the piecewise pseudo complex differences of the individual 3D PC-MR images using the following equation (39).
| [1] |
with
| [2] |
IPCMRA represents the resulting MR angiogram, M the anatomical image and V the absolute velocity. The variable threshvelo is a user defined threshold allowing the combinatory usage of phase and magnitude images for the calculation of the PC-MR angiogram. Next, the preprocessed 4D flow data were imported into the 3D visualization software. Intracranial 3D blood flow was visualized using time-resolved pathlines (see Figure 3) with emitter planes in the left and right internal carotid arteries, basilar arteries and at the in-and outflow of the aneurysms. The resulting traces were color-coded according to the local blood flow velocity magnitude. In addition, one 2D plane was positioned through the center of the aneurysm to visualize intra-aneurysmal in-flow pathways by velocity magnitude color coding (see Figure 4) and for vorticity quantification.
Figure 3.
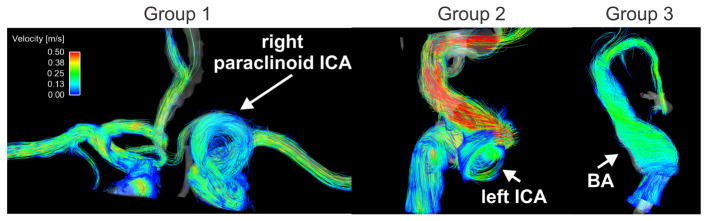
Examples of time resolved 3D pathlines for all three groups: Group 1: A giant saccular aneurysm located at the left paraclinoid ICA (internal carotid artery). Group 2: Small saccular left cavernous ICA aneurysm, and Group 3: large basilar artery fusiform aneurysm (see also supplemental video).
Figure 4.
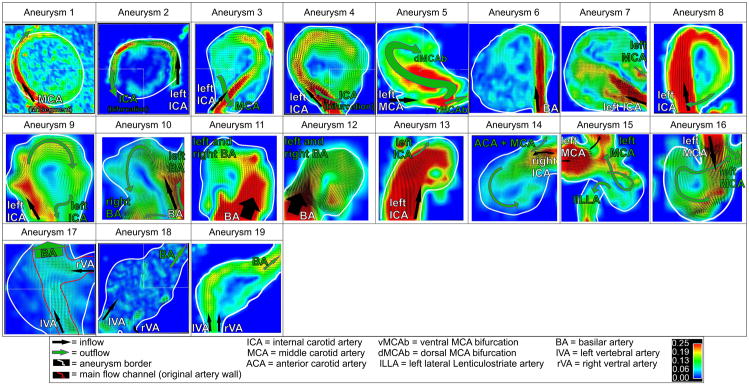
Intra-aneurysmal flow visualization in2D analysis planes through the center of the IAs for all n=19 aneurysms include in the study. Group 1 IAs mostly demonstrated a narrow high-flow channel along the aneurysm wall in combination with large central slow flow regions. Aneurysms in Group 2 showed more prominent high-flow channels peripherally with smaller central slow flow regions. In contrast, slow flow with less defined flow channels were noted in the fusiform IAs (Group 3).
Intra-aneurysmal velocity distribution
For all patients, the aneurysm volume was manually segmented based on the 4D flow magnitude and velocity data. For each voxel within the segmented aneurysm and for all time frames, the blood flow velocities were arranged in a histogram and normalized by the total number of voxels in the segmented volume to allow comparison across subjects. Mean (averaged over aneurysm volume and time in the cardiac cycle), median, and mean peak velocities within the cardiac cycle were determined for each patient.
Wall Shear Stress
The WSS pattern along the segmented aneurysm surface was calculated by cubic spline interpolation of the velocity gradient along the segmented aneurysm contour as described previously (23,35). Briefly, a b-spline interpolation of the measured discrete velocity data was used to directly map the local velocity derivatives (i.e. local velocity gradient) onto the vessel lumen segmentation contour. As a result, regional time-resolved WSS vectors were obtained, which were used to calculate the WSS magnitude along the aneurysm surface. The calculation of WSS and the manual segmentation of the vessel wall were performed using home built software programmed in Matlab. For each cardiac time frame, WSS was averaged over the aneurysm surface and the time-averaged WSS was determined for each patient.
Vorticity
Vort = abs(ζx,ζy,ζz) (with ζx = δw/δy − δv/δz, ζy = δu/δz − δw/δx, ζz = δv/δx − δu/δy and u,v,w being the vector components of the velocity was calculated for 48×48 points within the 2D plane transecting the aneurysm (EnSight, CEI, USA). Data points within the aneurysms were median-filtered to reduce noise, but maintain edge information. Outlier points were defined to differ from the maximum vorticity by more than 25% and then rejected.
Error Propagation Analysis
In order to estimate the accuracy of the velocity measurements as well as the dependent parameter WSS for our specific setup we performed error propagation analysis. The analysis is based on SNR and assumptions of segmentation errors, not the spatial resolution. All following calculations and equations are based on Stalder et al. (23). The SNR in the velocity images was estimated according to:
| [3] |
With the SNRmag measured in the magnitude images using the signal within the aneurysms and the standard deviation in the background noise (venc velocity sensitivity)
The spatial and temporal averaging due to MR acquisition and vessel lumen size affects the error propagation of the WSS calculations. When simplifying the B-spline interpolation to one dimension, the error propagation for the WSS averaged over lumen contour and cardiac cycle is given by:
| [4] |
With an assumed viscosity of blood η = 4.5 cP and inaccuracies associated with spatial averaging with (Δl = temporal sampling period, circumference = median circumference of segmented aneurysm volume) and temporal averaging with over the cardiac cycle. We assumed that the 1D cubic B-spline derivative kernel produced a similar error propagation as evaluated in Stalder et al. and chose the upper limit to accommodate for worst conditions by choosing aB-spline = 1.8/Δl. Further details about the underlying mathematics and the evaluation of the B-spline propagation error can be found in the results and the appendix of Stalder et al. (23).
Statistical Analysis
All continuous variables are reported as mean ± standard deviation. We performed a Lillifors test on the vorticity data, mean and peak velocity data and WSS data to test for normal distribution. WSS numbers were normal distributed and one-way ANOVA was performed for group comparisons followed by multiple comparisons between individual groups using an unpaired t-test. The distributions of vorticity and mean and peak velocities values were not normal and a non-parametric one-way ANOVA using chi-square statistics (Kruskal-Wallis test) and a Mann-Whitney U-test were used to compare medians. For both tests a P value < 0.05 was considered statistically significant.
All hemodynamic parameters were arranged in histograms to determine their mode (most frequently occurring value) and kurtosis (measure of the combined weight of the tails in relation to the rest of the distribution), skewness (measure of asymmetry), and range (minimum value subtracted from the maximum). In addition, a descriptive graphical approach was chosen to compare the histogram distributions for each parameter (mean vorticity, mean WSS, peak velocity and mean velocity). For this the mode, kurtosis, skewness and range was determined for each histogram and then plotted for all three groups in spider web plots. The shapes of these plots provide a visual impression of differences in intra-aneurysmal hemodynamics between the groups.
Correlation analysis
To identify relationships between aneurysm geometry (largest aneurysm dimension) and hemodynamics, (mean WSS, mean velocity) linear regression was performed and Pearson’s correlation coefficient r was calculated; a correlation was considered significant for p < 0.05.
RESULTS
4D flow MRI was successfully acquired to assess neurovascular blood flow velocities in 18 patients (12 females, 6 males, mean age 56 ± 12) with n=19 small, large or giant cerebral aneurysms (mean largest dimension = 16.2 ± 11 mm, range = 6 – 42 mm). Patient demographics and aneurysm characteristics are summarized in Table 1 and Table 2, respectively. Ten patients (6 females, 4 males, mean age 57 ± 14) had large or giant aneurysms (mean largest dimension = 23.1 ± 7.8 mm, range = 14 – 42 mm); the remaining 8 patients (6 females, 2 male, mean age 54 ± 12 aneurysm #9–16, Table 1) had aneurysms < 10 mm in all dimensions (mean largest dimension 7 ± 1 mm, range = 6 – 9 mm). Most aneurysms (n=16) were saccular in geometry and were proximally arising from the anterior circulation internal carotid artery (ICA) bifurcation or posterior circulation basilar artery (BA) (Group 1: n = 8 large/giant aneurysms; Group 2: n = 8 small aneurysms). One of the small saccular aneurysms (aneurysm #15) was multi-lobed with possible blebs, but below spatial resolution of the 4D flow MRI acquisition. The remaining three fusiform aneurysms (Group 3: n = 2 giant, n = 1 large) involved the vertebral arteries (VA) and BA (aneurysm #17–19). One patient harbored two large aneurysms (aneurysm #8 and #19, Table 2), a saccular left ICA and a fusiform VA-BA aneurysm. Two of the large/giant saccular aneurysms (aneurysms 2 and 5) were heavily thrombosed changing the original rather saccular morphology to a rather fusiform flow channel. For the segmentation of the vessel wall in these two aneurysms extra care was taken to segment along the inner aneurysm flow volume and not along the vessel wall.
Table 1.
Patient demographics, symptoms and risk factors.
| Patient | Age | Sex | Symptoms | Risk Factors |
|---|---|---|---|---|
| 1 | 43 | F | Hiccups, Extremity Weakness, Word Finding Difficulties | - |
| 2 | 56 | F | Cranial Nerve Deficits | SM |
| 3 | 47 | F | BlurredVision | SM |
| 4 | 63 | F | - | - |
| 5 | 35 | M | Aphasia, Hemiparesis | SM |
| 6 | 62 | F | Depression, Concentration Difficulty, Disinterest, Falls | SM, HTN |
| 7 | 73 | F | Progressive Visual Decline | HTN, FH |
| 8 | 61 | M | - | SM, HTN |
| 9 | 62 | F | - | SM, FH |
| 10 | 51 | F | SAH | HTN |
| 11 | 52 | F | - | SM, HTN |
| 12 | 58 | M | - | HTN |
| 13 | 30 | F | Double Vision, Cranial Nerve VI Dysfunction | - |
| 14 | 70 | F | SM, HTN | |
| 15 | 45 | F | Headaches | SM, Alcohol, FH, Prior SAH |
| 16 | 62 | M | - | HTN, FH |
| 17 | 49 | M | Stroke, Expressive Aphasia, Ataxia | SM |
| 18 | 82 | M | Diplopia | - |
smoking (SM), hypertension (HTN), family history (FH), subarachnoid hemorrhage (SAH)
Table 2.
Aneurysm Characteristics.
| Aneurysm | Aneurysm Location | Size (APxTPxCC x neck) | Morphology - Etiology | IA Group | Thrombus | Treatment |
|---|---|---|---|---|---|---|
| 1 | M1 segment MCA | 24×26×23 | Saccular-Dissection | 1 | - | - |
| 2 | Cavernous ICA | 25×24×9 | Saccular-Dissection | 1 | Heavy | Endovascular Sacrifice/Trapping |
| 3 | Paraclinoid ICA | 17×25×18×4.5 | Saccular | 1 | - | Clipped |
| 4 | Paraclinoid ICA | 10×14×14 | Saccular | 1 | - | Clipped |
| 5 | Paraclinoid ICA | 22×22×21 | Saccular-Dissection | 1 | Heavy | Clipped |
| 6 | VB Junction and BA | 23×22×22×3 | Saccular-Atherosclerosis | 1 | - | Clipped |
| 7 | Basilar tip | 21×21×23×7 | Saccular | 1 | - | Clipped/Trapped |
| 8 | ICA | 15 × 13 × 14 | Saccular | 1 | - | - |
| 9 | Paraclinoid ICA | 6×6×7 | Saccular | 2 | - | Clipped |
| 10 | Basilar tip | 6×6×5×3 | Saccular | 2 | - | Clipped |
| 11 | Basilar tip | 4×3×6×3 | Saccular | 2 | - | - |
| 12 | Basilar tip | 6×6×6 | Saccular | 2 | - | - |
| 13 | ICA | 6×5×6×3 | Saccular | 2 | - | - |
| 14 | ICA | 6×6×5 | Saccular | 2 | - | - |
| 15 | M1 MCA | 6×6×6×3 | Saccular | 2 | - | Clipped |
| 16 | MCA | 7 × 6 × 10 | Saccular | 2 | - | - |
| 17 | VB junction and BA | 25×17×17 | Fusiform-Atherosclerosis | 3 | - | - |
| 18 | BA | 42×15×17 | Fusiform-Atherosclerosis | 3 | Some | - |
| 19 | BA | 12 × 12 × 14 | Fusiform | 3 | - | - |
3D Blood flow visualization
The combination of 3D spatial encoding and 3-directional velocity encoding allowed for the 3D visualization of complex intracranial flow patterns in all patients as exemplary illustrated in Figure 3 for one patient of each aneurysm group (see also supplemental video).
Based on the visualization of intra-aneurysmal/in-flow pathlines by velocity magnitude color coding, the 19 IAs could be classified into three distinct groups of aneurysm hemodynamics as illustrated Figure 4. Six out of 8 patients in Group 1 demonstrated a narrow high-flow channel along the aneurysm wall in combination with large central slow flow regions in the saccular aneurysms of the anterior circulation. Aneurysms 5 and 7 also had high-flow jet channels but expressed a more complicated flow pattern not following the outline of the aneurysm wall. Aneurysms in Group 2 were more heterogeneous in their flow patterns, but in general showed more prominent high-flow channels peripherally, with smaller slow flow regions centrally in comparison to Group 1. In contrast, slow flow with less defined flow channels was noted in the three fusiform aneurysms constituting Group 3. Aneurysms 17 and 19 exhibited slow flow channels across the aneurysm center and along the wall, whereas aneurysm 18 barely expressed a visible flow direction with very slow swirling flow. Group 3 exhibited slower and more unidirectional flow compared to groups 1 and 2 with the faster and swirling flow along the vessel/aneurysm wall with slow central flow regions.
Error Propagation Analysis
The results for the error propagation analysis for velocity and WSS are summarized in Table 3. Velocity, and WSS errors were in the range of 1.6 % (± 1.6 %), respectively. All errors were much smaller than the differences between the groups indicating the reliability of WSS and velocity comparisons.
Table 3.
SNR in magnitude images and error propagation for velocity and WSS for each aneurysm in absolute numbers as well as in percentage of corresponding median value.
| Aneurysm | SNRmag | σvelo/m/s | σflow/ml/s | σWSS/Pa | σvelo/% of medianvelocity | σWSS/% of median WSS |
|---|---|---|---|---|---|---|
| 1 | 26.96 | 0.0134 | 0.2090 | 0.0018 | 0.92 | 0.12 |
| 2 | 13.33 | 0.0270 | 0.2790 | 0.0045 | 6.82 | 0.28 |
| 3 | 56.94 | 0.0055 | 0.0429 | 0.0011 | 1.27 | 0.08 |
| 4 | 55.49 | 0.0065 | 0.1233 | 0.0011 | 1.12 | 0.05 |
| 5 | 28.23 | 0.0128 | 0.1386 | 0.0020 | 3.08 | 0.28 |
| 6 | 97.98 | 0.0037 | 0.0339 | 0.0008 | 0.59 | 0.05 |
| 7 | 36.77 | 0.0098 | 0.0728 | 0.0015 | 2.68 | 0.17 |
| 8 | 31.14 | 0.0116 | 0.1239 | 0.0018 | 2.55 | 0.13 |
| 9 | 67.44 | 0.0053 | 0.0197 | 0.0016 | 0.66 | 0.04 |
| 10 | 95.83 | 0.0038 | 0.0579 | 0.0006 | 0.67 | 0.03 |
| 11 | 25.66 | 0.0140 | 0.0437 | 0.0043 | 1.79 | 0.19 |
| 12 | 95.80 | 0.0038 | 0.0126 | 0.0013 | 0.34 | 0.03 |
| 13 | 115.39 | 0.0031 | 0.0146 | 0.0008 | 0.22 | 0.02 |
| 14 | 71.34 | 0.0050 | 0.0271 | 0.0014 | 0.34 | 0.03 |
| 15 | 80.32 | 0.0045 | 0.0113 | 0.0012 | 0.63 | 0.06 |
| 16 | 73.97 | 0.0049 | 0.0128 | 0.0016 | 0.76 | 0.10 |
| 17 | 86.40 | 0.0042 | 0.0198 | 0.0012 | 1.86 | 0.19 |
| 18 | 69.65 | 0.0052 | 0.0420 | 0.0010 | 1.77 | 0.19 |
| 19 | 69.65 | 0.0052 | 0.0325 | 0.0011 | 2.90 | 0.27 |
|
| ||||||
| Mean | 63.07 | 0.0079 | 0.0693 | 0.0016 | 1.63 | 0.122 |
| Standard Deviation | 29.28 | 0.0059 | 0.0740 | 0.0011 | 1.56 | 0.089 |
Aneurysm velocity distribution
The results of the analysis of the intra-aneurysmal 3D velocity distribution are summarized in Figure 5. The individual histograms represent the velocity distribution within the aneurysms averaged over all subjects in each group. Differences between groups can clearly be appreciated and include increased mean and median velocities in groups 1 and 2 compared to Group 3 (Figure 5) as well as increased velocity range (range1 = 6.04 and range2 = 4.91 versus range3 = 2.55). The Group 3 velocity histogram emphasizes the presence of substantially reduced velocities in the entire aneurysm volume. All histogram shapes were skewed while Group 3 showed the highest skewness (skewness1 = 1.78 and skewness2 = 1.70 versus skewness3 = 5.65), the highest velocity distribution curve (normalized number of voxels at mode Group 1 = 0.051, 2 = 0.056 and Group 3 = 0.136), and lowest mode (mode1 = 0.4 and mode2 = 0.8 vs. mode3 = 0.35) emphasizing the higher prevalence of slow velocities. Differences in skewness are also reflected by changes in the fraction of velocities higher than the mode between groups (red text in the histogram graphs in Figure 5).
Figure 5.

A–C: Velocity histograms representing the average 3D velocity distribution inside the aneurysms for each of the three groups (A: Group 1, B: Group 2, C: Group 3). D: Mean aneurysm velocities (temporal and spatial average in the segmented 3D aneurysm volume). Significant differences in mean velocities were found between Groups 1–2 versus 3. E: Mean peak velocities showed significant differences between Group 1, 2 and 3. * (p< 0.05).
Comparison of all groups (Kruskal-Wallis) demonstrated significant differences in velocities (p ≪ 0.001). The Mann-Whitney U-test result showed that the highest median velocities were found in both Group 1 and 2 (Figure 5), which were significantly different than Group 3 (Pmvelo,1–3 ≪ 0.001, Pmvelo,2–3 ≪ 0.001, Pmvelo,2–3 ≪ 0.001). Groups 1 and 2 had similar median velocities. However, the highest peak velocities were observed in the large/giant saccular aneurysms with significant differences between groups 1 and 3 and 2 and 3 (Ppvelo, 1–2 = 0.15, Ppvelo,1–3 ≪ 0.001, Ppvelo,2–3 < 0.002,).
Wall shear stress
The results of the quantification of the WSS along the aneurysm surface are summarized in Figure 6. ANOVA revealed a significant difference between the groups (p ≪ 0.001). Multiple comparisons showed that the WSS distribution was decreased for Group 3 versus Group 1 and 2 (PWSS,1 – 2 ≪ 0.001, PWSS,1-3 ≪ 0.001, PWSS,2-3 ≪ 0.001,) as well as Group 1 versus Group 2.
Figure 6.

A–C: WSS histograms representing the average WSS distribution along the aneurysms’ surface for each of the three groups (A: Group 1, B: Group 2, C: Group 3). D: Mean aneurysm WSS (temporal and spatial average along the segmented aneurysm wall) showed significant differences between Groups 1, 2 and 3. E: Mean maximum WSS was also significantly different between Group 1, 2 and 3. * (p< 0.05).
Vorticity
Vorticity was significantly different between groups (Kruskal-Wallis, p ≪ 0.001). Aneurysms vorticity was significantly higher for Group 2 compared to Group 1 as well as Group 1 versus Group 3 (Table 4, PVort,1-2 ≪ 0.001, PVort,1-3 ≪ 0.001, PVort,2-3 ≪ 0.001,).
Table 4.
Mean vorticity, mean WSS, mean velocities and mean peak velocities for each patient group
| Mean Vorticity | Mean WSS in Pa | Mean Velocity in m/s | Mean Peak Velocity in ms/s | |
|---|---|---|---|---|
| Group 1 | 0.039 ± 0.017* | 1.43 ± 0.60* | 1.00 ± 0.77 | 1.56 ± 1.30* |
| Group 2 | 0.072 ± 0.035* | 2.76 ± 1.65* | 1.05 ± 0.80 | 1.18 ± 0.86* |
| Group 3 | 0.013 ± 0.005* | 0.84 ± 0.43* | 0.40 ± 0.21* | 0.75 ± 0.40* |
significant difference in mean compared to the other groups using unpaired t-test
Regression analysis
Correlation analysis revealed a significant inverse relationship (p = 0.02, r = −0.55) between aneurysm size and WSS for all saccular aneurysms (16 observations) as well as for all aneurysms in general (19 observations, p = 0.014, r = −0.55).
Multi-parametric characterization of aneurysm hemodynamics
Figure 7 shows spider web plots for IA hemodynamics as quantified by mean vorticity, time-averaged mean WSS, peak velocity, and mean velocity. As evident from Figure 7A, C and D velocity and vorticity distributions were similar for Groups 1 and 2 with only moderate differences in mode, kurtosis, range, or skewness. In contrast, the distribution of WSS along the aneurysm surface demonstrated clear differences between all three groups. Noticeably, the spider web plots for Group 3 showed a strongly divergent shape for all four parameters with most pronounced differences for mean WSS and peak velocity.
Figure 7.

Spider web plots providing a visual impression of the histograms characteristics of A: mean vorticity, B: mean WSS along the segmented aneurysm surface, C: mean peak intra-aneurysmal velocity, and D: mean intra-aneurysmal velocities.
DISCUSSION
Our findings in this feasibility study demonstrate the potential of 4D flow MRI to identify differences in IA hemodynamics as shown by visualization of intra-aneurysmal flow patterns and quantification of the 3D velocity distribution, vorticity and WSS patterns. Both qualitative and quantitative hemodynamic parameters were clearly different between three aneurysm size and morphology groups. Small saccular aneurysms showed fast velocities, highest vorticity and highest WSS compared to large and giant aneurysms. Moreover, large and giant saccular aneurysms showed high vorticity, high WSS and high peak velocities within the aneurysm and were easy differentiated from fusiform aneurysms with respect to these derived hemodynamic parameters. Within Group 1, thrombus was present in two aneurysms (aneurysm 2 and 5) altering the original saccular aneurysm morphology to a rather fusiform shape of the patent lumen. Further subdivision of morphology groups in future studies might include single lobed versus multi lobed aneurysms, which may have altered flow dynamics. In the present patient cohort only aneurysm #15 had a multi-lobulated shape and demonstrated similar flow characteristics in concordance with Group 2 (saccular small aneurysms). Also, identifying blebs (usually < 1–2 mm in size) and their influence on IA hemodynamics parameters was outside the resolution capability of our in vivo MR 4D flow technique.
Various investigators have previously sought to characterize specific hemodynamic parameters associated with IA rupture for improved risk stratification (8,13,18,40). In general, the understanding of the aneurysm growth and rupture is that the interaction between the hemodynamic forces and vessel wall biology impacts aneurysm wall mechanics. However, hemodynamic studies have not found evidence of an explanatory increase of peak pressure within aneurysms to explain wall failure on a purely mechanical basis. Consequently, there must be an alteration of the aneurysm wall resulting in mechanical weakening. Although the mechanism of aneurysm growth and rupture is still not understood, there are two main theories: high-flow effects and low-flow effects. For both theories, it is postulated that the hemodynamic environment within the aneurysm interacts with the cellular elements of the aneurysm wall to cause weakening. Steiger et al. (41) showed that aneurysm growth could be understood as a passive yield to blood pressure and reactive healing and thickening of the wall with increasing aneurysm diameter. The contradicting theories concentrate on the effects of WSS, with the high-flow theory indicating WSS elevation results in aneurysm growth (42–45) and the low-flow theory with low WSS at the aneurysm wall and its progressive thinning until rupture (46,47).
Our analysis suggests that IA size and morphology subgroups may harbor uniquely separate and divergent hemodynamic characteristics, which may account for the discrepancy in the literature of various hemodynamic parameters being associated with aneurysm rupture or growth/instability. We hypothesize that different aneurysm sizes and morphologies developing from various pathologies of aneurysm development (e.g. hemodynamics, atherosclerosis/inflammation, and dissection) may be prone to different hemodynamic profiles and that interval changes rather than absolute values could be as important for risk stratification. In fact, reduced velocities and WSS in large saccular or fusiform aneurysms may indicate an increased risk of aneurysm progression and thrombus formation (14,48) predisposing to aneurysm rupture.
Both 3D PC MRI and CFD studies have characterized the complexities of blood flow patterns and WSS distributions in the major intracranial arteries. In particular, it was shown that WSS has a nonuniform distribution along the vessels coinciding with the most common locations for aneurysm development (49). In addition, the importance of helical or swirling flows induced by the curving geometry of the intracranial arteries was shown to control the local distribution of WSS forces. In a CFD study with 119 IA patients Xiang et al. (16) could identify a relationship between morphological as well as hemodynamic parameters to aneurysm rupture using a logistic regression model and receiver operating curve statistics. Using statistical methods the significant parameters for the morphological model (size ratio) and for the hemodynamic model (WSS and OSI) were determined. Also, the authors found rupture in 71% of aneurysms with complex flow patterns with multiple vortices whereas aneurysms with simple flow patterns with a single vortex did not rupture (75%). Those results support the investigation of IA hemodynamic parameters as a contributing risk factor for aneurysm rupture. In our study. a correlation analysis confirmed the relationship between IA size and WSS (smaller aneurysm size resulted in higher velocities and thus increased velocity gradients and thus WSS).
Boussel et al (48) investigated seven patients and demonstrated correlation between regions of low WSS and aneurysm progression. In a study by Van Ooij et al 31) , the accuracy of 4D-flow MRI was compared with CFD to evaluate the feasibility of 4D-flow MRI analysis of the velocity flow field in a small intracranial aneurysm. Furthermore, van Ooij et al (van Ooij P, Potters WV, Guédon A, Schneiders JJ, Marquering HA, Majoie CB, vanBavel E, Nederveen AJ. Wall shear stress estimated with phase contrast MRI in an in vitro and in vivo intracranial aneurysm. J Magn Reson Imaging. 2013 Feb 15. doi: 10.1002/jmri.24051. [Epub ahead of print]) showed that WSS direction and regions of high and low wall shear stress can be similar for CFD and 3D PC-MRI in both an in vitro and in vivo aneurysm., the accuracy of 4D-flow MRI was compared with CFD to evaluate the feasibility of 4D-flow MRI analysis of the velocity flow field in a small intracranial aneurysm. Furthermore, van Ooij et al (van Ooij P, Potters WV, Guédon A, Schneiders JJ, Marquering HA, Majoie CB, vanBavel E, Nederveen AJ. Wall shear stress estimated with phase contrast MRI in an in vitro and in vivo intracranial aneurysm. J Magn Reson Imaging. 2013 Feb 15. doi: 10.1002/jmri.24051. [Epub ahead of print]) showed that WSS direction and regions of high and low wall shear stress can be similar for CFD and 3D PC-MRI in both an in vitro and in vivo aneurysm.
In a recent study by Meckel et al. (35), the feasibility of 4D flow MRI in five intracranial aneurysms for the analysis of complex patterns of the intraaneurysmal flow was investigated. Similar to our findings, it was stated that flow patterns, distribution of flow velocity and WSS are determined by the geometry of the aneurysm. In addition, Kecskemeti et al. (37) showed that measurements of small aneurysms obtained using 4D PC MRI correlate well with those obtained with digital subtraction angiography. Also, several other studies reported the feasibility of 4D flow MRI in the assessment of IAs (29,34).
To our knowledge, there is no 4D flow MRI study to date in which a systematic investigation in an IA patient cohort has been performed. Despite still a relatively small cohort of 19 IAs, we performed an in depth analysis of IA hemodynamics using 4D flow MRI data not previously presented in the literature Cognizant of low temporal and spatial resolution as an inherent limitation of the 4D flow MRI technique, only IAs with a size of at least 4 times larger than image resolution were recruited.
The definition of aneurysm groups in our study was based on the prospectively chosen classification scheme used in most of clinical trials including intracranial aneurysm (51,52) (53,54). Our aim was to assess hemodynamics in the context of small versus large aneurysms and saccular vs. fusiform morphology types based on typically used clinical classification schemes. However, these size criteria and 10 mm aneurysm diameter threshold are arbitrary clinical classifications and could be further optimized, perhaps by differentiation of bifurcation versus sidewall aneurysms though these aneurysms may still have similar morphologies (both can be saccular types). To address all variables of size, morphology (saccular vs. fusiform), and location (sidewall vs. bifurcation) future studies with lather patient cohorts are warranted.
Limitations of this study using 4D flow MRI are clearly dependent on its inability to fully capture the wide range of velocities inside IAs, the lack of quantitative markers describing complex intra-aneurysmal flow patterns, and their correlation with any clinical outcome measures (aneurysm rupture or progression). Current MRI protocols measure flow using a defined velocity sensitivity (venc) and thus lack the dynamic range to reliably assess the full velocity spectrum, typically found inside IAs (high flow jet, low unstable flow, vortex and helix flow types). In addition, similar to other in-vivo studies, we relied on purely visual analysis of aneurysm hemodynamics or a manual definition of regions for hemodynamic analysis (10,11,55).
Limited spatial and temporal resolution can lead to underestimation of the WSS magnitude, as shown previously in studies comparing MRI measurements and WSS derived from CFD. The data analysis method is described and validated in detail in Stalder et al. and has been subsequently applied in a number of studies (25,56) including a recent study demonstrating low observer variability and good scan-rescan reliability (57) for application in the thoracic aorta. The influence of spatial resolution on WSS calculations was performed in the original paper using the same WSS analysis strategy as in our paper (23). Based on synthetic data as well as in vivo experiments, Stalder et al. found that a limited resolution of 1mm as in our study causes underestimation of WSS of 60% of the original value. Nevertheless, since all data in our study were acquired with the same protocol, WSS distributions and differences can still reliably be compared between patients from the same study. To relate differences in hemodynamic parameters between groups as found in our study to potential sources if inaccuracies we performed a detailed error propagation analysis. The analysis clearly showed that all other potential sources of inaccuracies (noise, vessel lumen contours segmentation) have only very limited effect on flow and WSS estimation (two orders of magnitude smaller than the measured parameters).
Another drawback on our study is related to the small sample sizes in the three aneurysm groups. Further investigations with larger cohorts in each aneurysm group are necessary to confirm our initial findings in this feasibility study. In addition, future work is needed to develop automated techniques for the detection and quantification of regions with irregular flow that can be directly correlated with outcome measures such as aneurysm rupture or growth/progression as well as distinct aneurysm sizes and morphologies (saccular/fusiform). Longitudinal studies of IA flow patterns are needed to correlate disease progression and patient outcome with regional hemodynamics to investigate the utility of the technique for improved risk stratification and treatment planning.
In conclusion, the aim of this study was to shed light onto variation of 3D blood flow inside intracranial aneurysms and to investigate how differences in hemodynamics are related to shape or size of the aneurysms. In this feasibility study we demonstrated that there is an influence of lesion size and morphology on aneurysm hemodynamics suggesting the potential of 4D-flow MRI to assist in the classification of individual aneurysms.
Supplementary Material
Supplemental video: 3D blood flow visualization in a patient with two intracranial aneurysms representative of Group 1 and Group 3.
Acknowledgments
Grant Support: German Research Foundation (DFG) SCHN 1170/1-1, SIR Foundation Pilot Research Grant, NIH T32 EB005170 and NIH R01 HL088437
The work was supported by the Deutsche Forschungsgemeinschaft (DFG), grant SCHN 1170/1-1 and by the SIR Foundation pilot study grant, RSNA Research Seed Grant, grant RSD1207. Additional support comes from NIH T32 EB005170 and NIH R01 HL088437.
References
- 1.Chen PR, Frerichs K, Spetzler R. Natural history and general management of unruptured intracranial aneurysms. Neurosurgical focus. 2004;17(5):E1. doi: 10.3171/foc.2004.17.5.1. [DOI] [PubMed] [Google Scholar]
- 2.King JT., Jr Epidemiology of aneurysmal subarachnoid hemorrhage. Neuroimaging clinics of North America. 1997;7(4):659–668. [PubMed] [Google Scholar]
- 3.Rinkel GJ, Djibuti M, Algra A, van Gijn J. Prevalence and risk of rupture of intracranial aneurysms: a systematic review. Stroke; a journal of cerebral circulation. 1998;29(1):251–256. doi: 10.1161/01.str.29.1.251. [DOI] [PubMed] [Google Scholar]
- 4.Rahman M, Smietana J, Hauck E, et al. Size ratio correlates with intracranial aneurysm rupture status: a prospective study. Stroke; a journal of cerebral circulation. 2010;41(5):916–920. doi: 10.1161/STROKEAHA.109.574244. [DOI] [PubMed] [Google Scholar]
- 5.Wardlaw JM, White PM. The detection and management of unruptured intracranial aneurysms. Brain : a journal of neurology. 2000;123 ( Pt 2):205–221. doi: 10.1093/brain/123.2.205. [DOI] [PubMed] [Google Scholar]
- 6.Sforza DM, Putman CM, Cebral JR. Hemodynamics of Cerebral Aneurysms. Annual review of fluid mechanics. 2009;41:91–107. doi: 10.1146/annurev.fluid.40.111406.102126. [DOI] [PMC free article] [PubMed] [Google Scholar]
- 7.Gonzalez CF, Cho YI, Ortega HV, Moret J. Intracranial aneurysms: flow analysis of their origin and progression. AJNR American journal of neuroradiology. 1992;13(1):181–188. [PMC free article] [PubMed] [Google Scholar]
- 8.Steinman DA, Milner JS, Norley CJ, Lownie SP, Holdsworth DW. Image-based computational simulation of flow dynamics in a giant intracranial aneurysm. AJNR American journal of neuroradiology. 2003;24(4):559–566. [PMC free article] [PubMed] [Google Scholar]
- 9.Ohta M, Wetzel SG, Dantan P, et al. Rheological changes after stenting of a cerebral aneurysm: a finite element modeling approach. Cardiovascular and interventional radiology. 2005;28(6):768–772. doi: 10.1007/s00270-004-7148-6. [DOI] [PubMed] [Google Scholar]
- 10.Cebral JR, Castro MA, Appanaboyina S, Putman CM, Millan D, Frangi AF. Efficient pipeline for image-based patient-specific analysis of cerebral aneurysm hemodynamics: Technique and sensitivity. Ieee T Med Imaging. 2005;24(4):457–467. doi: 10.1109/tmi.2005.844159. [DOI] [PubMed] [Google Scholar]
- 11.Cebral JR, Mut F, Weir J, Putman CM. Association of Hemodynamic Characteristics and Cerebral Aneurysm Rupture. Am J Neuroradiol. 2011;32(2):264–270. doi: 10.3174/ajnr.A2274. [DOI] [PMC free article] [PubMed] [Google Scholar]
- 12.Boussel L, Rayz V, Martin A, et al. Phase-contrast magnetic resonance imaging measurements in intracranial aneurysms in vivo of flow patterns, velocity fields, and wall shear stress: comparison with computational fluid dynamics. Magnetic resonance in medicine : official journal of the Society of Magnetic Resonance in Medicine/Society of Magnetic Resonance in Medicine. 2009;61(2):409–417. doi: 10.1002/mrm.21861. [DOI] [PMC free article] [PubMed] [Google Scholar]
- 13.Jou LD, Quick CM, Young WL, et al. Computational approach to quantifying hemodynamic forces in giant cerebral aneurysms. AJNR American journal of neuroradiology. 2003;24(9):1804–1810. [PMC free article] [PubMed] [Google Scholar]
- 14.Rayz VL, Boussel L, Ge L, et al. Flow residence time and regions of intraluminal thrombus deposition in intracranial aneurysms. Annals of biomedical engineering. 2010;38(10):3058–3069. doi: 10.1007/s10439-010-0065-8. [DOI] [PMC free article] [PubMed] [Google Scholar]
- 15.Jou LD, Wong G, Dispensa B, et al. Correlation between lumenal geometry changes and hemodynamics in fusiform intracranial aneurysms. AJNR American journal of neuroradiology. 2005;26(9):2357–2363. [PMC free article] [PubMed] [Google Scholar]
- 16.Xiang J, Natarajan SK, Tremmel M, et al. Hemodynamic-morphologic discriminants for intracranial aneurysm rupture. Stroke; a journal of cerebral circulation. 2011;42(1):144–152. doi: 10.1161/STROKEAHA.110.592923. [DOI] [PMC free article] [PubMed] [Google Scholar]
- 17.Cebral JR, Castro MA, Burgess JE, Pergolizzi RS, Sheridan MJ, Putman CM. Characterization of cerebral aneurysms for assessing risk of rupture by using patient-specific computational hemodynamics models. AJNR American journal of neuroradiology. 2005;26(10):2550–2559. [PMC free article] [PubMed] [Google Scholar]
- 18.Hassan T, Ezura M, Timofeev EV, et al. Computational simulation of therapeutic parent artery occlusion to treat giant vertebrobasilar aneurysm. AJNR American journal of neuroradiology. 2004;25(1):63–68. [PMC free article] [PubMed] [Google Scholar]
- 19.Cebral JR, Mut F, Weir J, Putman C. Quantitative characterization of the hemodynamic environment in ruptured and unruptured brain aneurysms. AJNR American journal of neuroradiology. 2011;32(1):145–151. doi: 10.3174/ajnr.A2419. [DOI] [PMC free article] [PubMed] [Google Scholar]
- 20.Tateshima S, Murayama Y, Villablanca JP, et al. In vitro measurement of fluid-induced wall shear stress in unruptured cerebral aneurysms harboring blebs. Stroke; a journal of cerebral circulation. 2003;34(1):187–192. doi: 10.1161/01.str.0000046456.26587.8b. [DOI] [PubMed] [Google Scholar]
- 21.Castro MA, Putman CM, Cebral JR. Computational fluid dynamics modeling of intracranial aneurysms: effects of parent artery segmentation on intra-aneurysmal hemodynamics. AJNR American journal of neuroradiology. 2006;27(8):1703–1709. [PMC free article] [PubMed] [Google Scholar]
- 22.Prakash S, Ethier CR. Requirements for mesh resolution in 3D computational hemodynamics. Journal of biomechanical engineering. 2001;123(2):134–144. doi: 10.1115/1.1351807. [DOI] [PubMed] [Google Scholar]
- 23.Stalder AF, Russe MF, Frydrychowicz A, Bock J, Hennig J, Markl M. Quantitative 2D and 3D phase contrast MRI: optimized analysis of blood flow and vessel wall parameters. Magnetic resonance in medicine : official journal of the Society of Magnetic Resonance in Medicine/Society of Magnetic Resonance in Medicine. 2008;60(5):1218–1231. doi: 10.1002/mrm.21778. [DOI] [PubMed] [Google Scholar]
- 24.Canstein C, Cachot P, Faust A, et al. 3D MR flow analysis in realistic rapid-prototyping model systems of the thoracic aorta: comparison with in vivo data and computational fluid dynamics in identical vessel geometries. Magnetic resonance in medicine : official journal of the Society of Magnetic Resonance in Medicine/Society of Magnetic Resonance in Medicine. 2008;59(3):535–546. doi: 10.1002/mrm.21331. [DOI] [PubMed] [Google Scholar]
- 25.Frydrychowicz A, Stalder AF, Russe MF, et al. Three-dimensional analysis of segmental wall shear stress in the aorta by flow-sensitive four-dimensional-MRI. Journal of magnetic resonance imaging : JMRI. 2009;30(1):77–84. doi: 10.1002/jmri.21790. [DOI] [PubMed] [Google Scholar]
- 26.Harloff A, Albrecht F, Spreer J, et al. 3D blood flow characteristics in the carotid artery bifurcation assessed by flow-sensitive 4D MRI at 3T. Magnetic resonance in medicine : official journal of the Society of Magnetic Resonance in Medicine/Society of Magnetic Resonance in Medicine. 2009;61(1):65–74. doi: 10.1002/mrm.21774. [DOI] [PubMed] [Google Scholar]
- 27.Kohler U, Marshall I, Robertson MB, Long Q, Xu XY, Hoskins PR. MRI measurement of wall shear stress vectors in bifurcation models and comparison with CFD predictions. Journal of magnetic resonance imaging : JMRI. 2001;14(5):563–573. doi: 10.1002/jmri.1220. [DOI] [PubMed] [Google Scholar]
- 28.Papathanasopoulou P, Zhao S, Kohler U, et al. MRI measurement of time-resolved wall shear stress vectors in a carotid bifurcation model, and comparison with CFD predictions. Journal of magnetic resonance imaging : JMRI. 2003;17(2):153–162. doi: 10.1002/jmri.10243. [DOI] [PubMed] [Google Scholar]
- 29.Hollnagel DI, Summers PE, Poulikakos D, Kollias SS. Comparative velocity investigations in cerebral arteries and aneurysms: 3D phase-contrast MR angiography, laser Doppler velocimetry and computational fluid dynamics. NMR in biomedicine. 2009;22(8):795–808. doi: 10.1002/nbm.1389. [DOI] [PubMed] [Google Scholar]
- 30.Marquering H, Van Ooij P, Streekstra G, et al. Multi-Scale Flow Patterns Within an Intracranial Aneurysm Phantom. IEEE transactions on bio-medical engineering. 2011 doi: 10.1109/TBME.2011.2163070. [DOI] [PubMed] [Google Scholar]
- 31.van Ooij P, Guedon A, Poelma C, et al. Complex flow patterns in a real-size intracranial aneurysm phantom: phase contrast MRI compared with particle image velocimetry and computational fluid dynamics. NMR in biomedicine. 2011 doi: 10.1002/nbm.1706. [DOI] [PubMed] [Google Scholar]
- 32.Wetzel S, Meckel S, Frydrychowicz A, et al. In vivo assessment and visualization of intracranial arterial hemodynamics with flow-sensitized 4D MR imaging at 3T. AJNR American journal of neuroradiology. 2007;28(3):433–438. [PMC free article] [PubMed] [Google Scholar]
- 33.Isoda H, Ohkura Y, Kosugi T, et al. In vivo hemodynamic analysis of intracranial aneurysms obtained by magnetic resonance fluid dynamics (MRFD) based on time-resolved three-dimensional phase-contrast MRI. Neuroradiology. 2010;52(10):921–928. doi: 10.1007/s00234-009-0635-3. [DOI] [PubMed] [Google Scholar]
- 34.Hope TA, Hope MD, Purcell DD, et al. Evaluation of intracranial stenoses and aneurysms with accelerated 4D flow. Magnetic resonance imaging. 2010;28(1):41–46. doi: 10.1016/j.mri.2009.05.042. [DOI] [PubMed] [Google Scholar]
- 35.Meckel S, Stalder AF, Santini F, et al. In vivo visualization and analysis of 3-D hemodynamics in cerebral aneurysms with flow-sensitized 4-D MR imaging at 3 T. Neuroradiology. 2008;50(6):473–484. doi: 10.1007/s00234-008-0367-9. [DOI] [PubMed] [Google Scholar]
- 36.Schnell S, Ansari SA, Vakil P, et al. Characterization of cerebral aneurysms using 4D FLOW MRI; 2011 1st of Febuary 2012; Orlando, USA. SCMR/ISMRM Jointly Sponsored Workshop “Exploring New Dimensions of Cardiovascular Flow and Motion”; (#1255313). [Google Scholar]
- 37.Kecskemeti S, Johnson K, Wu Y, Mistretta C, Turski P, Wieben O. High resolution three-dimensional cine phase contrast MRI of small intracranial aneurysms using a stack of stars k-space trajectory. Journal of magnetic resonance imaging : JMRI. 2011 doi: 10.1002/jmri.23501. [DOI] [PMC free article] [PubMed] [Google Scholar]
- 38.Bock J, Kreher BW, Hennig J, Markl M. Optimized pre-processing of time-resolved 2D and 3D Phase Contrast MRI data. 2007; Berlin, Germany. 15th Annual Meeting of ISMRM; p. Abstract 3138. [Google Scholar]
- 39.Bock J, Wieben O, Johnson K, Hennig J, Markl M. Optimal processing to derive static PC-MRA from time-resolved 3D PC-MRI data. Toronto, Canada. Proc Intl Soc Mag Reson Med; 2008. p. 3053.p. Abstract: 3053. [Google Scholar]
- 40.Cebral JR, Castro MA, Appanaboyina S, Putman CM, Millan D, Frangi AF. Efficient pipeline for image-based patient-specific analysis of cerebral aneurysm hemodynamics: technique and sensitivity. IEEE Trans Med Imaging. 2005;24(4):457–467. doi: 10.1109/tmi.2005.844159. [DOI] [PubMed] [Google Scholar]
- 41.Steiger HJ, Aaslid R, Keller S, Reulen HJ. Strength, elasticity and viscoelastic properties of cerebral aneurysms. Heart and vessels. 1989;5(1):41–46. doi: 10.1007/BF02058357. [DOI] [PubMed] [Google Scholar]
- 42.Nakatani H, Hashimoto N, Kang Y, et al. Cerebral blood flow patterns at major vessel bifurcations and aneurysms in rats. Journal of neurosurgery. 1991;74(2):258–262. doi: 10.3171/jns.1991.74.2.0258. [DOI] [PubMed] [Google Scholar]
- 43.Fukuda S, Hashimoto N, Naritomi H, et al. Prevention of rat cerebral aneurysm formation by inhibition of nitric oxide synthase. Circulation. 2000;101(21):2532–2538. doi: 10.1161/01.cir.101.21.2532. [DOI] [PubMed] [Google Scholar]
- 44.Hara A, Yoshimi N, Mori H. Evidence for apoptosis in human intracranial aneurysms. Neurological research. 1998;20(2):127–130. doi: 10.1080/01616412.1998.11740494. [DOI] [PubMed] [Google Scholar]
- 45.Sho E, Sho M, Singh TM, Xu C, Zarins CK, Masuda H. Blood flow decrease induces apoptosis of endothelial cells in previously dilated arteries resulting from chronic high blood flow. Arteriosclerosis, thrombosis, and vascular biology. 2001;21(7):1139–1145. doi: 10.1161/hq0701.092118. [DOI] [PubMed] [Google Scholar]
- 46.Griffith TM. Modulation of blood flow and tissue perfusion by endothelium-derived relaxing factor. Experimental physiology. 1994;79(6):873–913. doi: 10.1113/expphysiol.1994.sp003816. [DOI] [PubMed] [Google Scholar]
- 47.Liepsch DW. Flow in tubes and arteries--a comparison. Biorheology. 1986;23(4):395–433. doi: 10.3233/bir-1986-23408. [DOI] [PubMed] [Google Scholar]
- 48.Boussel L, Rayz V, McCulloch C, et al. Aneurysm growth occurs at region of low wall shear stress: patient-specific correlation of hemodynamics and growth in a longitudinal study. Stroke; a journal of cerebral circulation. 2008;39(11):2997–3002. doi: 10.1161/STROKEAHA.108.521617. [DOI] [PMC free article] [PubMed] [Google Scholar]
- 49.Brisman JL, Song JK, Newell DW. Cerebral aneurysms. The New England journal of medicine. 2006;355(9):928–939. doi: 10.1056/NEJMra052760. [DOI] [PubMed] [Google Scholar]
- 50.Bammer R, Hope TA, Aksoy M, Alley MT. Time-resolved 3D quantitative flow MRI of the major intracranial vessels: initial experience and comparative evaluation at 1.5T and 3.0T in combination with parallel imaging. Magnetic resonance in medicine : official journal of the Society of Magnetic Resonance in Medicine/Society of Magnetic Resonance in Medicine. 2007;57(1):127–140. doi: 10.1002/mrm.21109. [DOI] [PMC free article] [PubMed] [Google Scholar]
- 51.Kataoka K, Taneda M, Asai T, Yamada Y. Difference in nature of ruptured and unruptured cerebral aneurysms. Lancet. 2000;355(9199):203. doi: 10.1016/S0140-6736(99)03881-7. [DOI] [PubMed] [Google Scholar]
- 52.Juvela S, Porras M, Poussa K. Natural history of unruptured intracranial aneurysms: probability of and risk factors for aneurysm rupture. Journal of neurosurgery. 2000;93(3):379–387. doi: 10.3171/jns.2000.93.3.0379. [DOI] [PubMed] [Google Scholar]
- 53.Investigators TISoUIA. Unruptured intracranial aneurysms--risk of rupture and risks of surgical intervention. International Study of Unruptured Intracranial Aneurysms Investigators. The New England journal of medicine. 1998;339(24):1725–1733. doi: 10.1056/NEJM199812103392401. [DOI] [PubMed] [Google Scholar]
- 54.Wiebers DO, Whisnant JP, Huston J, 3rd, et al. Unruptured intracranial aneurysms: natural history, clinical outcome, and risks of surgical and endovascular treatment. Lancet. 2003;362(9378):103–110. doi: 10.1016/s0140-6736(03)13860-3. [DOI] [PubMed] [Google Scholar]
- 55.Mulder G, Bogaerds ACB, Rongen P, van de Vosse FN. On automated analysis of flow patterns in cerebral aneurysms based on vortex identification. J Eng Math. 2009;64(4):391–401. [Google Scholar]
- 56.Harloff A, Nussbaumer A, Bauer S, et al. In vivo assessment of wall shear stress in the atherosclerotic aorta using flow-sensitive 4D MRI. Magnetic resonance in medicine : official journal of the Society of Magnetic Resonance in Medicine/Society of Magnetic Resonance in Medicine. 2010;63(6):1529–1536. doi: 10.1002/mrm.22383. [DOI] [PubMed] [Google Scholar]
- 57.Markl M, Wallis W, Harloff A. Reproducibility of flow and wall shear stress analysis using flow-sensitive four-dimensional MRI. Journal of magnetic resonance imaging : JMRI. 2011;33(4):988–994. doi: 10.1002/jmri.22519. [DOI] [PubMed] [Google Scholar]
Associated Data
This section collects any data citations, data availability statements, or supplementary materials included in this article.
Supplementary Materials
Supplemental video: 3D blood flow visualization in a patient with two intracranial aneurysms representative of Group 1 and Group 3.