Abstract
The mass sensitivity of quartz-crystal microbalance (QCM) was drastically improved by removing electrodes and wires attached on the quartz surfaces. Instead of wire connections, intended vibrations of quartz oscillators were excited and detected by antennas through electromagnetic waves. This noncontacting measurement is the key for ultrahigh-sensitive detection of proteins in liquids as well as quantitative measurements. This review shows the principle of wireless QCMs, their applications to studying interactions among biomolecules and aggregation reactions of amyloid β peptides, and the next-generation MEMS QCM, the resonance acoustic microbalance with naked embedded quartz (RAMNE-Q).
Keywords: biosensor, quartz crystal microbalance, affinity, MEMS
Introduction
It has been well recognized that quantitative evaluation of interactions among biomolecules and between cell and proteins will achieve significant progress in the protein design and drug discovery. For this purpose, various tag proteins have been developed. However, conventional affinity tag systems include large protein tags such as green-fluorescent proteins (∼ >27 kDa), FLAGs with specific antibodies (∼ >150 kDa), and quantum dots (> ∼20 Å),1,2) and they affect the affinity to biomolecules. Also, modifications of proteins for attaching tags could vary their biological properties. Furthermore, individual affinity tags require specific buffer conditions, which will affect functions of examined proteins.3) Therefore, development of low-weight tags, which do not affect the functions of proteins, has been intensively studied.4,5)
The label-free methods are, therefore, important for studying interactions between native biomolecules. There are two representative methods. First is the surface plasmon resonance (SPR) biosensor.6–8) In a conventional SPR measurement, receptor proteins are immobilized on a metallic thin film deposited on a glass plate, which is irradiated from the back surface through a prism by a light, and an analyte is injected. The coupling condition between the evanescent field generated by the incident light and the surface plasmon wave at the metallic film is governed by the macroscopic electric properties in the evanescent field, and the incident angle of the light for exciting SPR changes during the binding reaction between the receptor and target proteins. The incident angle varies as the binding reaction progresses, allowing evaluation of kinetics of the biomolecule reaction. The SPR method inherently possesses a disadvantage that it is insensitive to reactions, which proceed outside the evanescent field. Therefore, it is difficult to monitor a multistep interactions or interactions between cells and proteins.
The second method is the quartz-crystal-microbalance (QCM) biosensor.9–12) Receptor proteins are immobilized on the quartz oscillator surface, and analyte solutions are injected. When target proteins are captured by the receptor proteins, the effective mass of the oscillator increases, resulting in the decrease in the resonance frequency of the oscillator. Then, an injection of washing solution will cause dissociation of the target proteins from receptors, and the resonance frequency will recover. Thus, a real-time monitoring of association and dissociation reactions between biomolecules is possible, providing their binding affinity. Because the fractional frequency change (Δf/f) principally equals the ratio of the adsorbed mass to the oscillator mass,13,14) the QCM biosensor allows quantitative measurement for the binding affinity. Unlike the SPR biosensors, QCM biosensors can detect any mass addition on the quartz surface, and they are applicable to studying interactions between larger biomaterials, such as cells, immobilized on the surface and surrounding proteins.
The sensitivity of the QCM biosensor to the added mass improves as the oscillator mass decreases. Remaining a sufficient active area for biochemical reactions, the reduction of the oscillator mass is achieved by the reduction of its thickness, leading to the increase in the fundamental resonance frequency (f1). Because the amount of the frequency change |Δf| caused by adsorption of proteins is proportional to the square of the fundamental resonance frequency,11,13) thinning the oscillator significantly increases the sensitivity. Besides, a high-frequency QCM measurement is needed for quantitative analysis. The viscosity effect varies the resonance frequency15–17) as well as the mass loading effect, making the quantitative evaluation of the adsorbed protein mass complicated. Low-frequency QCM measurements are easily affected by the viscosity effect, and the simultaneous measurement of resonance frequency and dissipation has been performed for compensating for the frequency change due to the viscosity effect.18–21) Because the viscosity effect becomes insignificant compared with the mass loading effect at high frequencies,11,15,22) a higher frequency QCM measurement is desired.
Previous studies usually used QCMs with fundamental resonance frequencies lower than 10 MHz.9,10,18–21,23–25) However, higher-frequency QCM systems are recently developed. Natesan et al.26) used 16.5 MHz QCM for detecting staphylococcal enterotoxin B and achieved the detection limit of 25 ng/mL. Furusawa et al.27,28) developed a 27 MHz QCM system to increase the sensitivity, although their method cannot adopt a flow-injection-analysis system. Uttenthaler et al.29) developed high frequency QCMs with resonant frequencies from 39 to 110 MHz in the liquid. Those previous studies needed electrodes on both surfaces of the quartz crystals for applying the effective electric field. However, gold electrodes deteriorate the mass sensitivity of QCM because of gold’s mass density much larger than that of quartz, and this influence becomes marked as the fundamental resonance frequency increases. Furthermore, the active sensing region is restricted near the center region where the electrodes are attached, and a large part of surface area remains inactive, deteriorating the sensitivity. Thus, the electrodeless QCM biosensors are obviously preferable.
Wireless-electrodeless QCM (WE-QCM) systems were recently developed, where a naked AT-cut quartz plate was driven by the line antenna or the flat antenna contactlessly,11) and achieved high frequency QCMs with fundamental resonance frequencies up to 180 MHz.30) This review article shows the mechanism of the WE-QCM, its usefulness for bioassays, and its extension to microelectromechanical-system (MEMS) based chip fabrication.
Principle of WE-QCM
Mechanism of QCM biosensor.
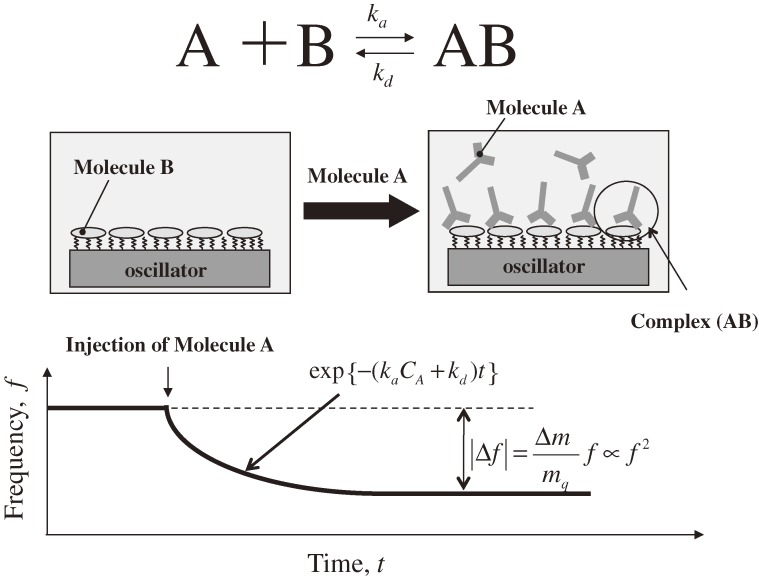
Figure 1 shows a schematic of the typical use of a QCM biosensor for monitoring the binding reaction between molecules A and B with the association-velocity and dissociation-velocity constants ka and kd, respectively. First, the proteins B are immobilized on the quartz-oscillator surface as the receptor proteins, and the fundamental resonance frequency f1 is measured in the flowing buffer solution. After the resonance frequency becomes stable, the analyte solution including the molecules A is injected. The molecules A are specifically captured on the oscillator surface by the molecules B, increasing the effective mass of the oscillator and decreasing the resonance frequency. The frequency decreases exponentially when the binding reaction proceeds with a pseudo-first-order manner,10,14) and the exponential coefficient α is related to the reaction velocity constants and the concentration of molecule A CA as
 |
[1] |
Measurements of the exponential coefficients with various analyte concentrations, therefore, allow us to determine the thermodynamic constants, and then the binding affinity (equilibrium constant) KA = ka/kd, as well as the concentration of the target protein. Thus, the QCM biosensors enable the label-free assay.
Figure 1.
Schematic of the QCM biosensor operation for monitoring a binding reaction between biomolecules A and B. ka and kd are association and dissociation velocity constants, respectively, and CA denotes the concentration of injected analyte. f and Δf are fundamental resonance frequency and frequency change, respectively. Δm and mq are adsorbed mass and mass of the quartz resonator, respectively.
Advantages of WE-QCM.
The frequency change Δf1 of the fundamental mode of the quartz oscillator is principally related with the protein mass Δm adsorbed on the quartz surface by the Sauerbrey equation:
 |
[2] |
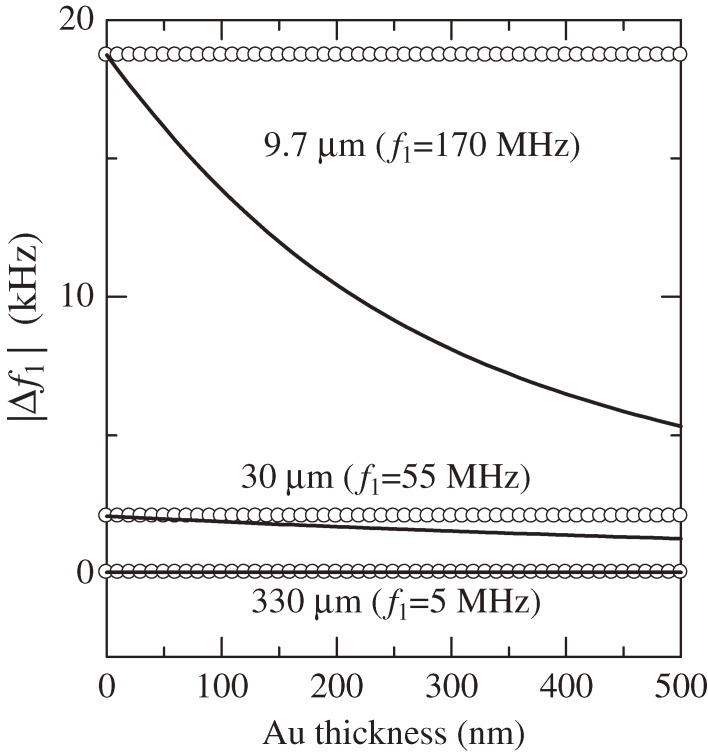
Hence, mq, ρq, vq, and dq denote the mass, the mass density, the sound velocity (usually of the shear wave), and the thickness of the quartz resonator, respectively. ρs denotes the area mass density, which is the mass of the adsorbed protein on the unit surface area. Equation [2] obviously shows that the mass sensitivity (|Δf1/ρs|) of a QCM is inversely proportional to the square of the resonator thickness. (Note that the sensitivity is expressed by |Δf1/ρs| in this paper and this does not equal to the signal-to-noise (S/N) ratio; the S/N ratio highly depends on measurement conditions and should be discussed in individual measurements.) Therefore, thinning the oscillator significantly improves the sensitivity of QCM. However, this has never been straightforward because of the electrodes. Metallic electrodes were indispensable for excitation and detection of vibrations of piezoelectric oscillators. The demand for decreasing the electric resistance has made the electrodes as thick as 100 nm or more. Attachment of such heavy electrodes, however, increases inertia resistance and also mechanical loss due to high damping of metals, deteriorating the sensitivity. Especially, biosensing applications often use noble-metal electrodes because they show high affinity to the thiol-mediated self-assembled monolayers, on which receptor proteins can be immobilized. Mass densities of noble metals (Au: 19,300 kg/m3, Pt: 21,400 kg/m3) are much higher than that of quartz (2,648 kg/m3), deteriorating the mass sensitivity, significantly. The influence of the metallic electrodes enlarges at high frequencies, limiting the available frequency with QCM measurements. Figure 2 shows the influences of the gold electrode on quartz surfaces on the frequency change when 1-nm thick human immunoglobulin G (hIgG) layers are adsorbed on both surfaces, displaying the deterioration of the mass sensitivity caused by the electrode. (The details of the calculation appear in Ref. 22.) For example, a 200-nm thick gold electrode lowers the amount of the frequency changes for 170 and 55 MHz QCMs by 45% and 18%, respectively, while it hardly affects the sensitivity of a 5 MHz QCM. Because of a much larger mass density of gold than quartz and the maximum accelerated velocity at the surface, the inertia resistance caused by the electrode becomes significant, making the Sauerbrey equation invalid for a high-frequency QCM with the electrode. Thus, the electrodeless approach is essential not only for a highly sensitive QCM but also for a quantitative analysis with the Sauerbrey equation.
Figure 2.
Influence of the gold electrode on the amount of the resonance-frequency change caused by the adsorption of human immunoglobulin G layers on both surfaces. The open circles denote the prediction by the Sauerbrey equation, and the solid lines are the analytical calculation for the five-layer model. Resonator thicknesses are shown. This figure was reproduced with permission from Ogi et al.22)
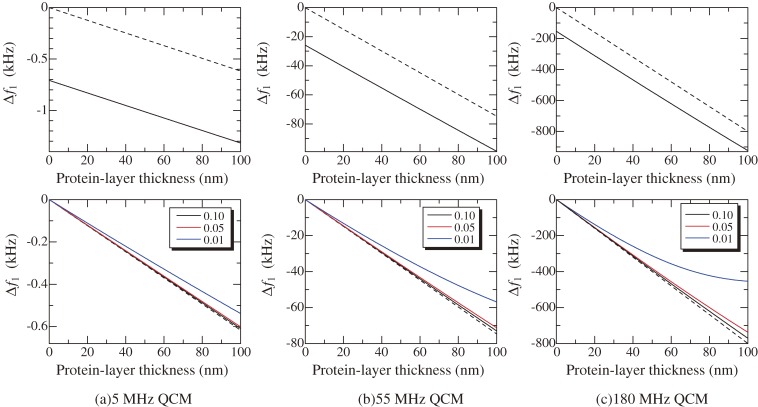
The actual frequency change is caused not only by the mass loading effect, but also by the viscosity effect of the solution15) and the viscoelastic effect of the protein layer.16,17) These effects are analyzed using the Voight model17) for a three-layer model as shown in Fig. 3, consisting of the quartz-oscillator layer, the viscoelastic protein layer, and the viscous solution layer. The results are shown in Fig. 4 for three QCMs with fundamental resonance frequencies of 5, 55, and 180 MHz. The resonance frequencies decrease as the protein adsorption proceeds, and the amount of the frequency change markedly increases for higher frequency QCMs. The frequency change caused by the mass loading is comparable with that caused by the solution viscosity for the low frequency QCM (see upper figures in Fig. 4). Thus, the change in the viscosity of the analyte solution will cause a significant change in the baseline, deteriorating the accuracy of the assay. For the higher-frequency QCMs, the effect is insignificant compared with the mass-loading effect. The viscoelastic properties of the protein layer causes a discrepancy from the Sauerbrey equation for higher frequency QCMs because a very soft layer cannot move on with a high frequency vibration of the substrate (see the blue lines in lower figures in Fig. 4). However, this effect is negligible for standard protein layers composed of high binding bonds with antigen-antibody reaction.
Figure 3.
A three layer model composed of a quartz plate, viscoelastic protein layer adsorbed on the quartz, and the viscous solution layer. ρ, η, μ, and d denote the mass density, viscosity, shear modulus, and thickness, respectively. Subscripts q, p, and sol indicate quantities of quartz, protein layer, and solution, respectively.
Figure 4.
Changes in the fundamental resonance frequencies for (a) 5, (b) 55, and (c) 180 MHz QCMs calculated by the three-layer viscoelastic model. Broken lines show the mass-loading effect based on the Sauerbrey equation. Used parameters are ηsol = 0.001 Pa·s, μp = 1 kPa, ρp = 1100 kg/m3, and dsol = 1 mm. Upper figures are resonance frequency changes for the three QCMs for ηp = 0.1 Pa·s, and lower figures are relative frequency changes to those without the protein layer; numbers indicate ηp values in Pa·s.
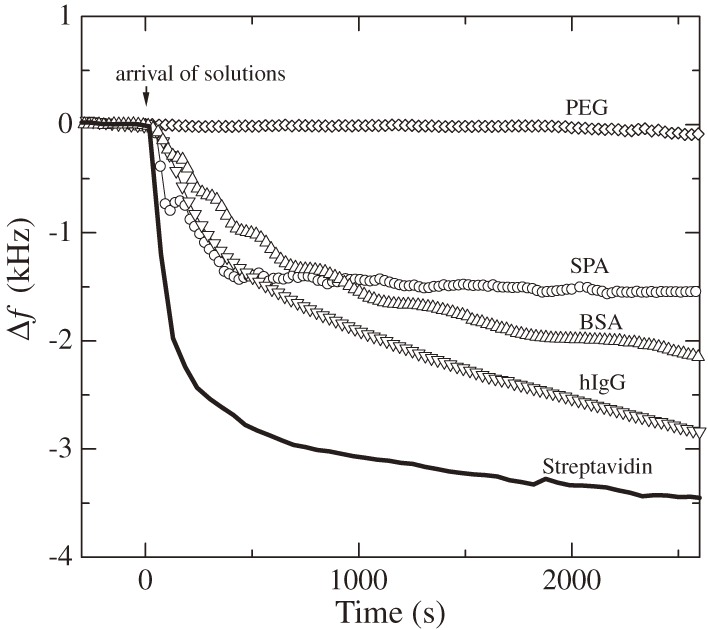
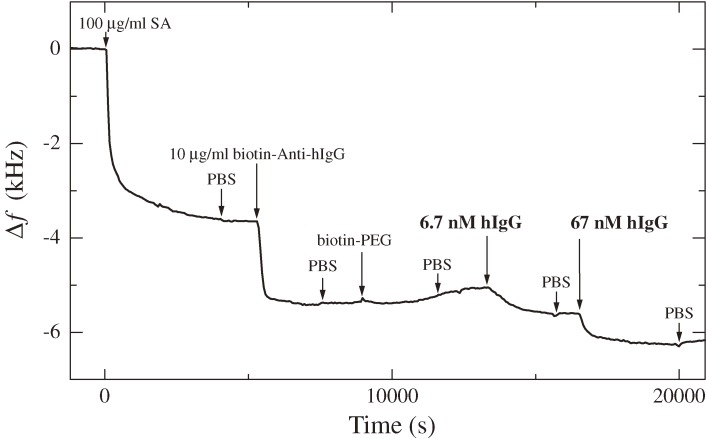
Besides high sensitivity and high quantitative capability, there is a very important advantage in the WE-QCM, that is the replacement-free nature. Other sensor chips used in existing biosensor systems need to be replaced because they use metallic films on their surfaces. The same sensor cannot be used for many times because washing with strong acid or strong alkali deteriorates the adhesion, and metallic films fall off eventually. Biosensor chips must have been replaced, consuming cost and time. Therefore, a replacement-free biosensor has been desired. Because a WE-QCM uses a naked quartz crystal, which is inherently free from the deterioration of electrodes and tolerant to many washing solutions; the quartz crystals can be used permanently. Furthermore, it is revealed that the naked quartz crystal surface adsorbs many proteins with high affinity31,32) as shown in Fig. 5, realizing immobilization of receptor proteins directly on the naked quartz surface without linkers such as self-assembled monolayers. The affinity to streptavidin is especially higher, and using streptavidin base on quartz, we can detect any analyte via biotin-conjugated receptors on streptavidin, where the sensor chip never needs to be replaced as shown in Fig. 6. Because inactive proteins such as bovine serum albumin (BSA) also adsorbs on the naked quartz surfaces, the uncovered surface regions can be blocked by injecting them after receptor proteins as will be seen in Fig. 14.
Figure 5.
Frequency changes observed for injections of 100 µg/mL concentration proteins in a phosphate buffered saline (PBS) solution (f1 = 55 MHz). PEG, SPA, BSA, and hIgG represent polyethylene glycol, staphylococcus protein A, bovine serum albumin, and human immunoglobulin G, respectively. This figure was reproduced with permission from Ogi et al.31)
Figure 6.
A frequency change observed in a multi-injection measurement (f1 = 55 MHz). SA, hIgG, biotin-PEG, and PBS represent streptavidin, human immunoglobulin G, biotin-conjugated polyethylene glycol, and phosphate buffered saline solutions, respectively. This figure was reproduced with permission from Ogi et al.31)
Measurement setup.
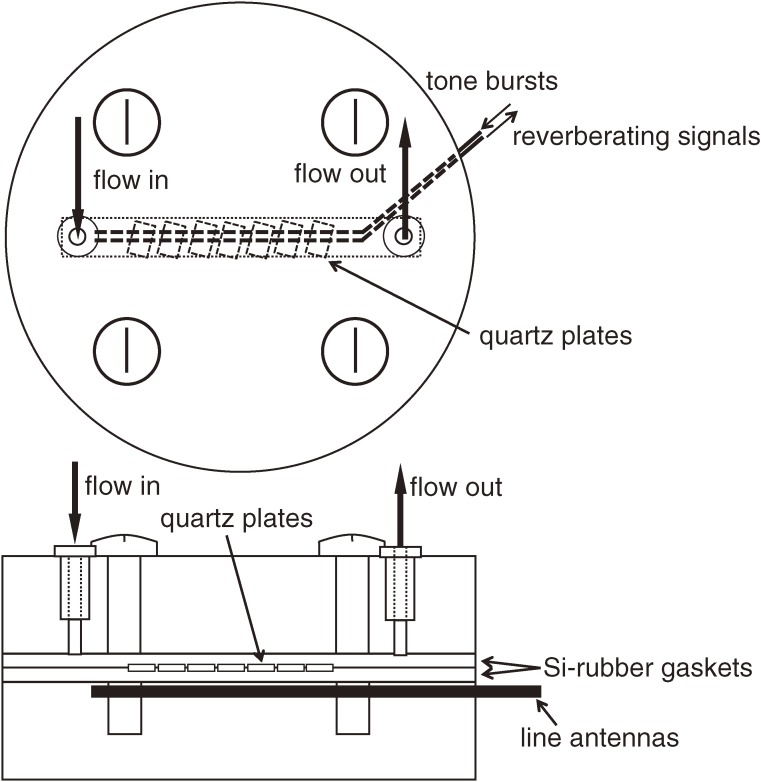
In WE-QCM systems, two line or flat antennas are used for excitation and detection of the shear vibrations of the AT-cut quartz oscillator. Figure 7 shows an example of the sensor cell for a multichannel WE-QCM. The AT-cut quartz oscillators with different thicknesses are aligned along the flow channel. They are lightly sandwiched by two silicon-rubber gaskets. The two line antennas are located outside the flow channel. The tone bursts are applied to the generation antenna, which causes the shear vibrations of the oscillators through the electromagnetic field. After the excitation, the vibrations are detected by the detection antenna through the electromagnetic fields induced by the vibrations. Thus, the noncontacting measurement of the oscillators’ vibrations is achieved with this measurement setup.
Figure 7.
Measurement setup of a multichannel WE-QCM. Many AT-cut quartz resonators are simultaneously excited by a single antenna contactlessly. Their responses are separately detected because of different resonance frequencies.
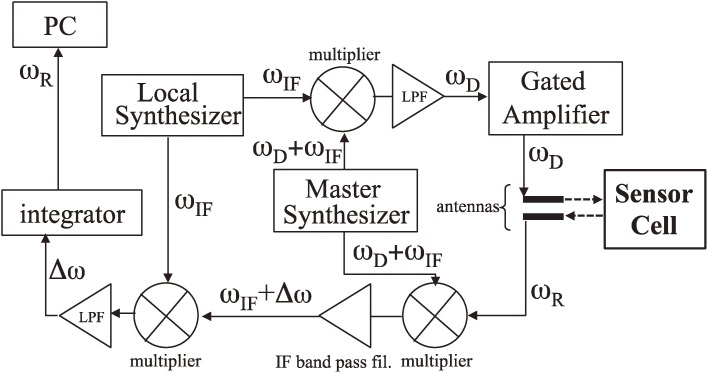
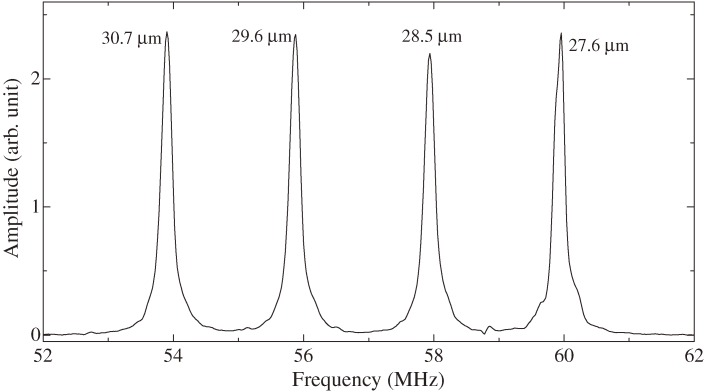
Figure 8 shows the electronics to measure the resonance frequency contactlessly by the antennas. A superheterodyne spectroscopy33,34) was developed with the intermediate frequency (ωIF) of 25 MHz, which is provided by the local synthesizer. The master synthesizer generates a sinusoidal signal with the frequency of ωIF + ωD, where ωD is the driving frequency and it is set to be close to the resonance frequency of the quartz oscillator. The outputs from the two synthesizers enter the first multiplier and the driving-frequency signal with the frequency ωD is produced by the following low-pass filter. After the high-power gated amplifier, the bust signal is fed to the antenna wire for generation, which induces the electric field to cause pure-shear oscillation in the quartz crystal via the converse piezoelectric effect.35) After the excitation, the antenna wire for detection receives the reverberating signal of the oscillator vibration with the resonance frequency ωR. This signal and the reference signal from the master synthesizer enter the second multiplier and the output signal is fed to the third multiplier after the bandpass filter set at ωIF. The reference signal from the local synthesizer also enters the third multiplier, and the output signal of the differential frequency component Δω = ωR − ωD is extracted by the low-pass filter. This beating signal is integrated by the analog integrator, and the final output is stored in the personal computer to calculate the resonance frequency of the quartz oscillator ωR. Figure 9 shows an example of measured resonance spectrum for four-channel WE-QCM.
Figure 8.
The developed electronics and the signal flow for measuring the resonance frequency of the quartz oscillator with the noncontacting manner. This figure was reproduced with permission from Ogi et al.31)
Figure 9.
Resonance spectrum from four-channel quartz plates with different thicknesses between 27.6 and 30.7 µm immersed in PBS measured by the line antennas contactlessly.
The sensor cell is installed in a homebuilt flow-injection-analysis system. An analyte solution is selected and injected by a switching valve among several, which replaces the carrier buffer solution. A steady flow with the flow rate between 100 and 500 µl/min is supplied by a micropump. A degasifier is located before the micropump to decrease the solvent gases in the solution. After the micropump, the solution flows in a 3 m Teflon tube column, which maintains the temperature of the solution at 37 ℃. In the sensor cell, the solution flows along both surfaces of the sensor chips. Note that a WE-QCM can use both surfaces as the sensing region.
High sensitivity of WE-QCM
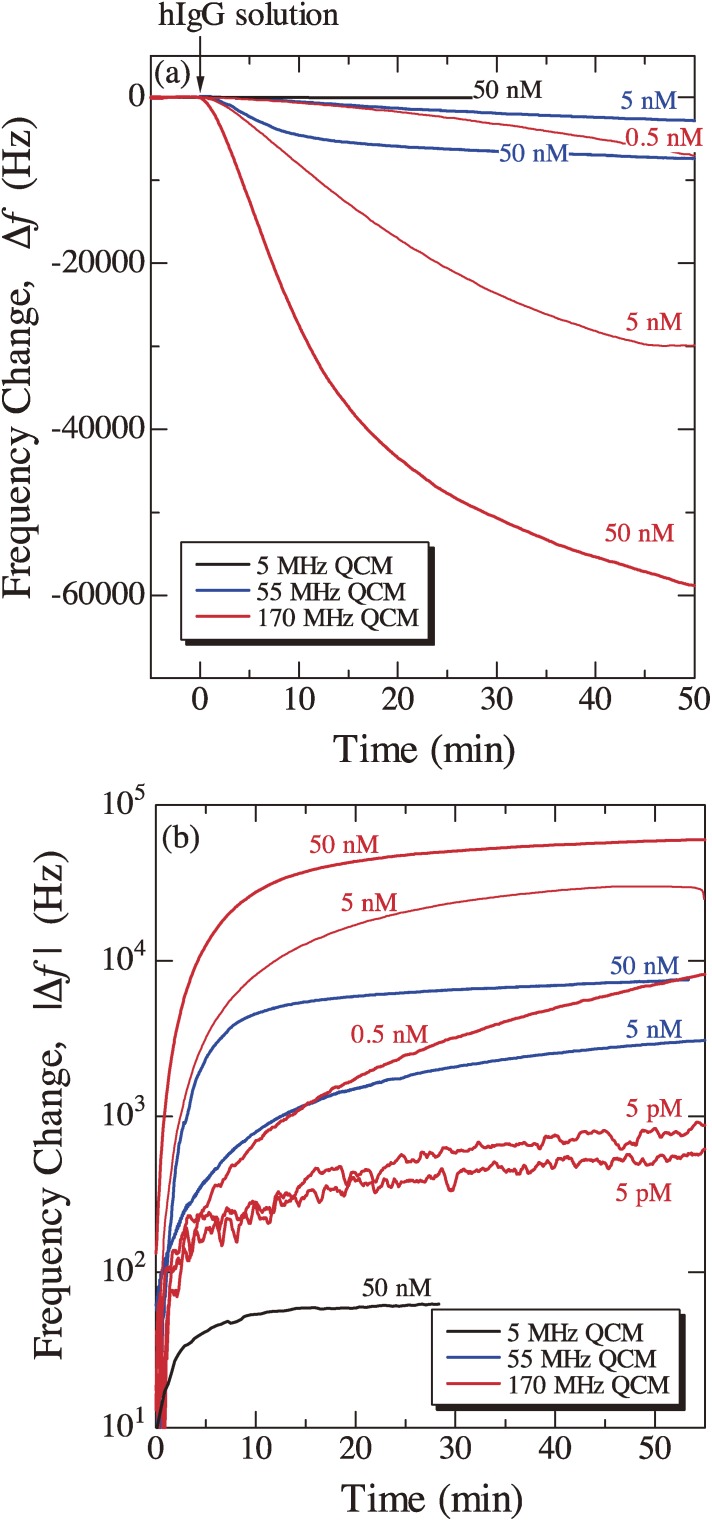
Figure 10 shows typical example for demonstrating the high sensitivity and wide dynamic range of the WE-QCM.22) Staphylococcal protein A (SPA) was immobilized on the both surfaces of quartz resonators, and hIgG solutions with various concentrations between 5 pM and 50 nM were injected. Obviously, the sensitivity of the 170 MHz QCM biosensor is much higher than that of a conventional 5 MHz QCM biosensors. According to the Sauerbrey equation, the mass sensitivity of a QCM considering the electrode area Ae is given by
 |
[3] |
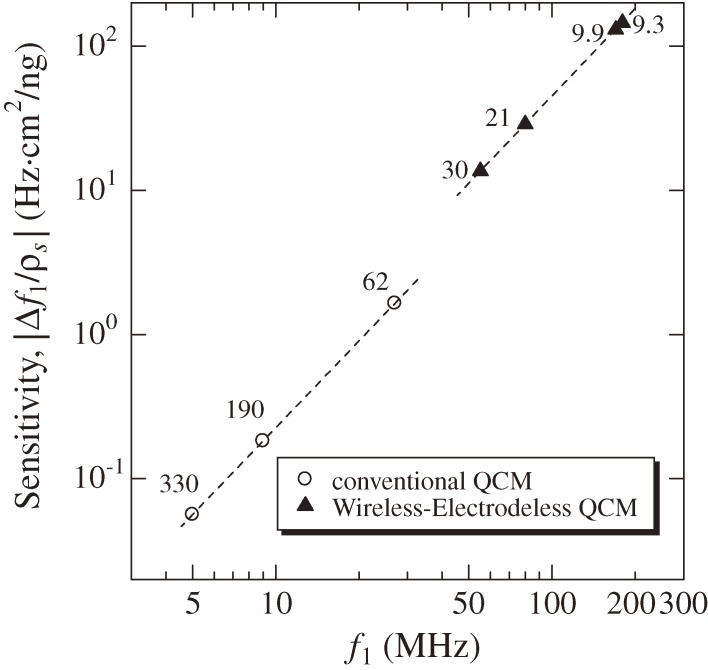
where Aq denotes the one-sided surface area of the quartz crystal. Thus, the ratio Ae/Aq is directly related to the QCM sensitivity, and it is smaller than 1 for a conventional QCM using a single side of a quartz plate, while it nearly equals 2 for the wireless-electrodeless QCM because almost whole both surfaces can be used. Figure 11 shows a relationship between the fundamental resonance frequency and the mass sensitivity (|Δf1/ρs|) for conventional QCMs and WE-QCMs. The mass sensitivities are 0.056, 0.18, and 1.64 Hz·cm2/ng for 5, 9, and 27 MHz conventional QCMs, respectively, whereas they are 6.8, 14, 65, and 73 Hz·cm2/ng for 55, 80, 170, and 180 MHz WE-QCMs, respectively. Thus, the mass sensitivity for a 170 MHz electrodeless QCM is three-orders-of-magnitude larger than that of a conventional 5-MHz single-side QCM. With the 170 MHz WE-QCM, the label-free direct detection of hIgG with a concentration of 0.5 pM was possible, which will be only achieved with this technique. The measured |Δf1| for the injection of 50 nM hIgG solution were 62, 7450, and 61000 Hz for 5, 55, and 170 MHz WE-QCMs, respectively, yielding the linear relationship between f12 and Δf1 with the coefficient of correlation of |R| = 0.9999.22) This agreement with the Sauerbrey equation confirms quantitative aspect of the WE-QCM.
Figure 10.
(a) Typical frequency changes caused by the injection of the human immunoglobulin G (hIgG) solution detected by three electrodeless QCMs. (b) Logarithmic resonance-frequency change during the injection of the hIgG solution. For the 5 pM hIgG solution, two independent measurements are shown. These figures were reproduced with permission from Ogi et al.22)
Figure 11.
Relationship between the fundamental resonance frequency and the mass sensitivity (|Δf/ρs|) for conventional and wireless-electrodeless QCMs. Resonator thicknesses in µm are shown.
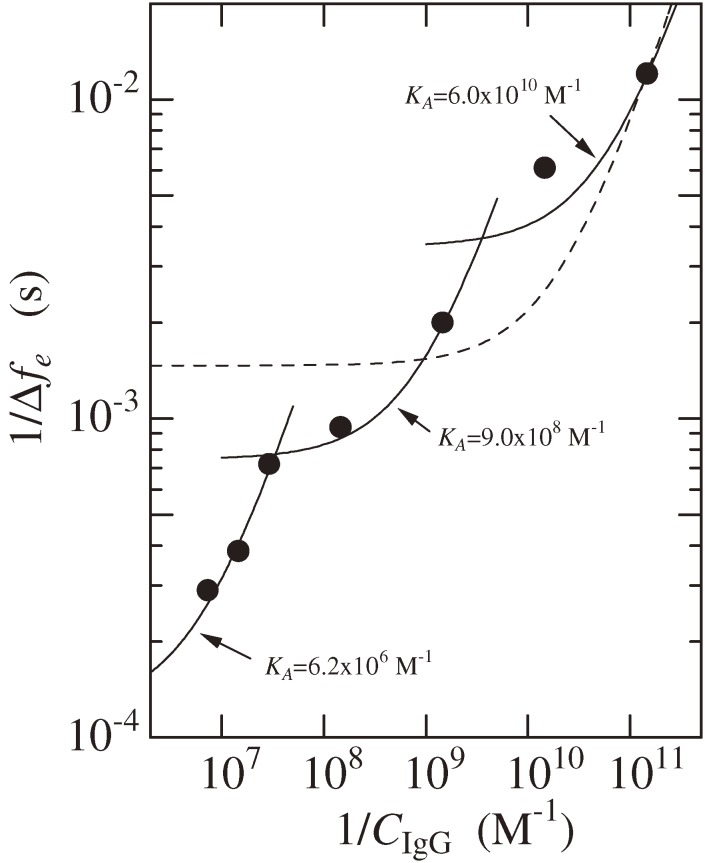
The high sensitivity of a WE-QCM allows evaluation of concentration dependence of binding affinity between biomolecules.36) Figure 12, for example, plots the relationship between the inversed frequency change Δfe−1 at the equilibrium state and the inversed concentration of the injected analyte (IgG) CIgG−1. The reaction kinetics theory predicts a linear relationship between them, and the equilibrium constant KA is given from its slope and intercept.10) A single line, however, failed to fit to the results for a wide concentration range (the broken line), indicating the dependence of KA on the concentration of analyte. The KA value takes 6.2 × 10⁶, 9.0 × 10⁸, and 6.0 × 10¹⁰ M−1 for concentration ranges between 5 and 20 µg/ml, 0.1 and 5 µg/ml, and 1 and 100 ng/ml, respectively. The affinity value thus significantly varies depending on the analyte concentration. The concentration dependence of the affinity between IgG and protein A was attributed to the different structures of the IgG-protein A complex. Hanson and Schumaker37) suggested five plausible structures for IgG-protein A complexes, depending on their molar ratio. Individual complex structures should possess different affinity.
Figure 12.
Relationship between the inversed analyte concentration CIgG−1 and inversed equilibrium frequency change Δfe−1. A WE-QCM with f1 = 55 MHz was used. The broken line shows a fit of the theory to all the measurements. Solid lines are fitted theory to the three data points. This figure was reproduced with permission from Ogi et al.36)
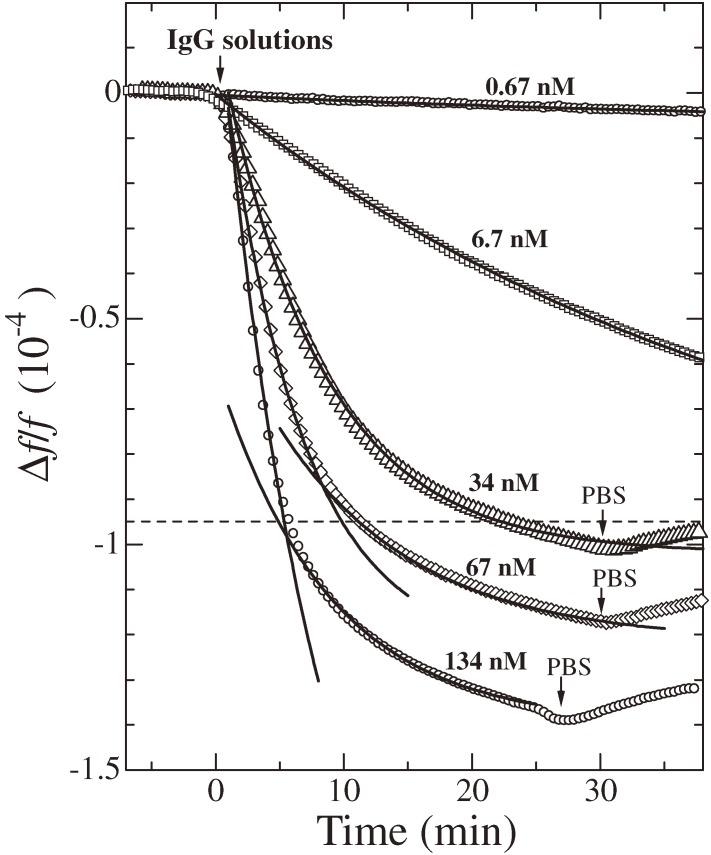
The high-sensitive WE-QCM contributes to avoid deterioration of the apparent affinity due to the hindrance effect. Figure 13 shows binding curves for injections of hIgG solutions of various concentrations on the SPA-immobilized sensor chip.38) Solid lines are the fitted theoretical function. When an hIgG solution arrives at the sensor cell, the frequency starts to decrease exponentially. The theoretical exponential function with a single exponential coefficient given by Eq. [1] well fitted the measurements for lower-concentration solutions. For higher-concentration solutions (>34 nM), however, a single-exponential function failed to fit the observed frequency change, and two exponential functions were apparently required to explain the frequency change. The critical value, at which the frequency change departs from the first exponential function, appeared around Δf/f = 9.5 × 10⁻⁵ (Δf = 5.2 kHz). This critical value was consistently explained from the steric hindrance effect of hIgG molecules. At the critical point, almost the whole surfaces of the oscillator were covered by hIgG molecules, and the steric hindrance subsequently occurred, resulting in deceleration of binding affinity because of buried binding sites of protein A. This result gave an important indication in determining the kinetics constants using a flow injection system. Previous QCMs used only one side of their oscillators, and when a conventional 9 MHz QCM is used, for example, the critical value will be Δf/f = −7.8 × 10⁻⁶ or Δf = −70 Hz. Therefore, the affinity evaluation must be performed using small frequency changes; otherwise, the affinity value will be underestimated due to the steric hindrance effect. Furthermore, not only QCMs but also SPR immunoassays adopted flow injection systems to evaluate the kinetics of biomolecule reactions, and they have to use low-concentration analyte solutions before the steric hindrance effect becomes dominant. Therefore, using a high-sensitive QCM is the key for accurately determining the binding affinity between biomolecules.
Figure 13.
Binding curves for injections of human immunoglobulin G (hIgG) solutions of various concentrations measured by a WE-QCM with f1 = 55 MHz. The solid curves are fitted theory. The horizontal broken line indicates the critical value, by which the steric hindrance effect becomes significant and decreases the apparent affinity. This figure was reproduced with permission from Ogi et al.38)
Multichannel operation
One of the central issues in the QCM study is development of the multichannel QCM (MQCM) biosensor. It increases the efficiency of detection of target proteins and enables monitoring of interactions among three or more biomolecules. Intensive efforts have been, therefore, paid for establishing MQCM biosensors. This MQCM is capable of monitoring the biological reactions in the same liquid environment. Using one channel as a reference, it allows compensation for temperature and viscosity effects. However, the ineluctable interference among channels has been an unsolved problem. The principal approach was developing the one-chip MQCM, where several sensing regions were prepared on a single quartz plate. Tatsuma et al.39) made four sensor regions by chemically etching the quartz plate and confirmed their independent operation by dropping a water droplet. Abe et al.40–42) fabricated different-thickness sensing regions in a single quartz plate by the deep-reactive ion etching method. They demonstrated a four-channel measurement as a gas sensor. Jin et al.43) also developed a four-channel one-chip MQCM and adopted it to a gas sensor. However, because of the ineluctable interference among channels, the development of an MQCM for an immunosensor has been difficult with this approach. Another approach was the combination of many single-channel QCMs,44) where the interference is negligible. However, it required a larger amount of solutions, and the liquid environment (temperature, pressure, and so on) will not be the same among sensor cells, downplaying the important advantage of the MQCM. Also, it is not easy to increase the number of the channel, because many instruments were needed for individual channels.
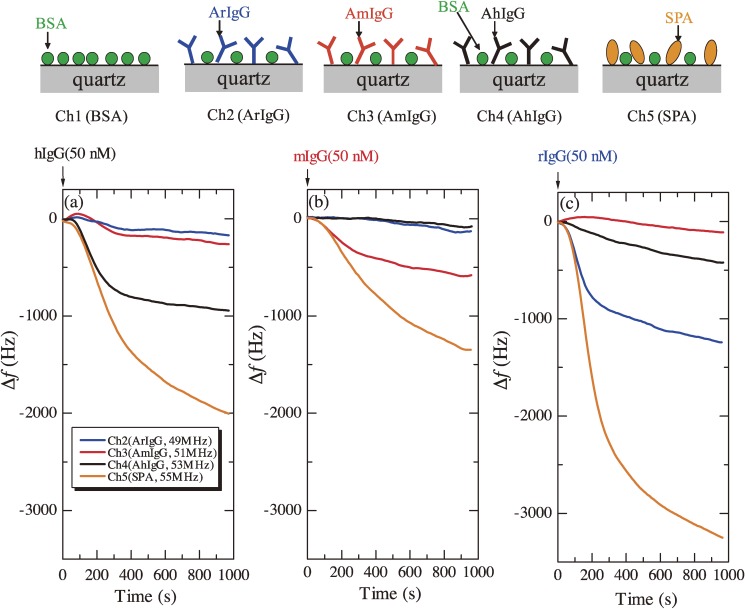
A wireless-electrodeless multichannel QCM (WE-MQCM) was then developed to solve the difficulties.45) The shear vibrations of AT-cut quartz-crystal plates with different thicknesses were simultaneously excited and detected by the same antenna in the same reaction cell. Because of the independent sensor chips, the frequency interference among chips is negligible, while the reactions can be monitored in the same environment. The electrodeless blank quartz oscillators were set in a line along the flow channel. The thicknesses of the quartz plates were varied between 39 and 30 µm, corresponding to 43 and 55 MHz fundamental resonance frequencies, respectively. Up to a 10-channel WE-MQCM was developed, and further increase of the channel number is easily achieved using smaller crystals. The nonspecific binding was used for immobilizing the receptor proteins, which remained the replacement-free nature.
Figure 14 shows examples of application of a five-channel WE-MQCM for detecting different antigen-antibody reactions. Anti hIgG antibody (AhIgG), anti mouse IgG antibody (AmIgG), anti rabbit IgG antibody (ArIgG), SPA, and BSA were immobilized nonspecifically as shown in Fig. 14, and 50 nM analyte solutions were injected. Figures 14(a)–(c) show the frequency changes observed in the five-channel WE-MQCM measurements responding to injections of hIgG, mIgG, and rIgG solutions, respectively, where the frequency change in the reference channel was subtracted. The channel with the antibody receptor showed a significantly larger frequency decrease when the corresponding antigen was injected, while other channels showed lower frequency changes except for the SPA channel. The SPA binds with IgG molecules specifically, and the number of IgG molecule which can bind with a single SPA is larger than one.37) Thus, the amount of the frequency change in the SPA channel was always larger than the other channels. rIgG especially shows higher affinity with SPA,46) resulting in the largest frequency decrease. The simultaneous measurement allowed to observe nonspecific adsorptions. For example, AhIgG binded with rIgG with relatively higher affinity. Thus, the WE-MQCM is useful for studying interactions among proteins. A further increase of the channel number will require reducing the size of the quartz plate for setting all the crystals in the same environment.
Figure 14.
Schematics of five channel quartz surfaces (upper) and binding curves for injections of three different antigen solutions ((a)–(c)). Five quartz channels were prepared, where anti human-immunoglobulin-G antibody (AhIgG), anti mouse-IgG antibody (AmIgG), anti rabbit-IgG antibody (ArIgG), staphylococuss aureus protein A (SPA), and bovine serum albumin (BSA) were immobilized. Their fundamental resonance frequencies were between 43 and 55 MHz. 50-nM human IgG (hIgG), mouse IgG (mIgG), and rabbit IgG (rIgG) solutions were injected. In the lower figures, the response of the reference channel (BSA channel) is subtracted. These figures were reproduced with permission from Ogi et al.45)
Aggregation reaction of amyloid β peptides
Aggregation processes of amyloid β (Aβ) peptides are deeply involved in pathogenic mechanisms of Alzheimer’s disease (AD).47–49) There are two principal full-length Aβ peptides related to AD, Aβ1–40 (Aβ40) and Aβ1–42 (Aβ42), which are extracted from the parental amyloid precursor proteins by enzymes or enzyme complexes.50) Aβ40 is predominantly produced, but Aβ42 is more hydrophobic to cause fibril formation51) and more neurotoxic.52) Thus, understanding of the aggregation mechanism of the Aβ peptides remains a central issue in the peptide polymerization study. Previous works studied their aggregation process in bulk solutions,51,53–56) where interactions among nuclei, aggregates, and monomers dominate the polymerization process for oligomers and fibrils in this case, blinding the most important interaction between nuclei and surrounding peptides. Thus, it is important to systematically study deposition behaviors of peptides on nuclei without involving interactions between nuclei.
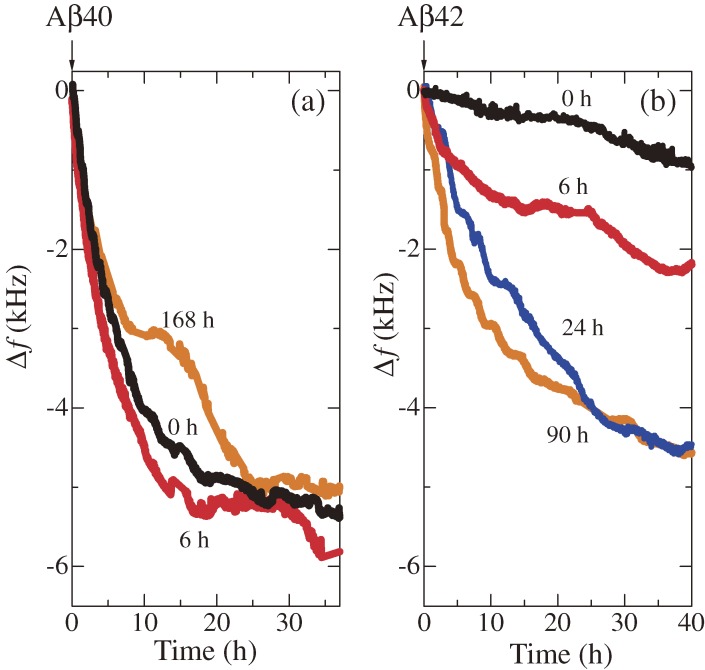
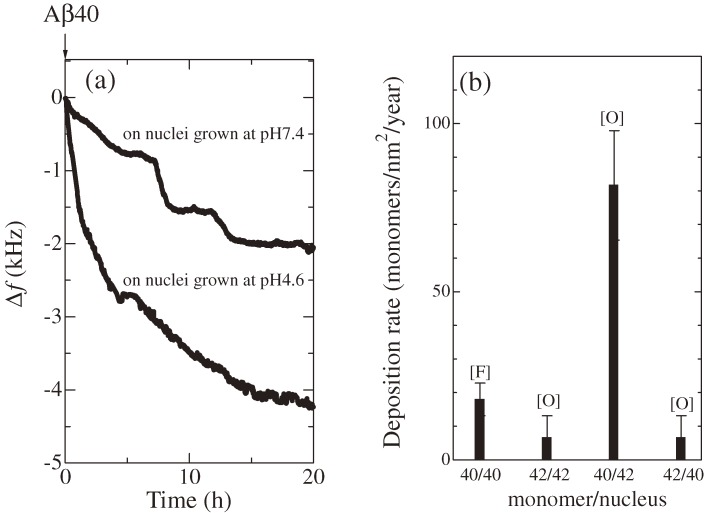
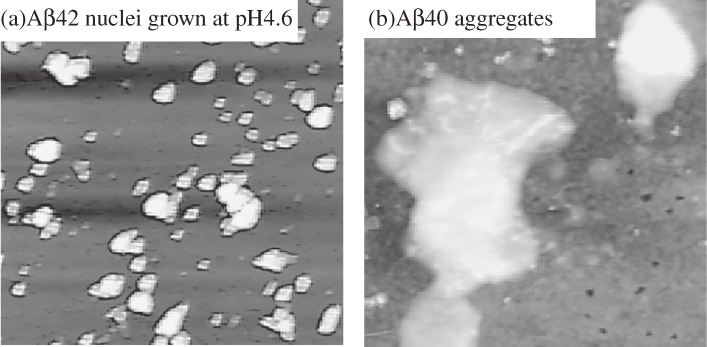
A WE-MQCM was then applied to systematically study the deposition behaviors of Aβ40 and Aβ42 monomers on various nuclei over 40 h.57,58) Figure 15 shows a schematic of such measurements. Aβ40 and Aβ42 nuclei grown at pH 7.4 or 4.6 were immobilized on the quartz surfaces, and the monomer Aβ solution was injected. Figure 16 shows examples of homogeneous-deposition behaviors on the nuclei grown at pH 7.4, displaying successful monitoring of the deposition reactions for a long time. The most important observation was that Aβ40 peptides markedly accumulate on the Aβ42 nuclei grown at pH 4.6 (Fig. 17), resulting in oligomeric deposits (Fig. 18). This deposition rate is much higher than those in other cases (Fig. 17(b)). From these results, an important model for AD was proposed as follows.57) Oligomers and related structures are more neurotoxic than fibrils,59–61) and significant aggregation behavior for oligomeric structures is the key of the AD mechanism. Aβ42 is more hydrophobic and will self-associate just after its production from the amyloid precursor protein by the cleaving enzymes (β and γ secretases50)), which show high activity at lower pH. Therefore, the isolated Aβ42 peptides can form the active nuclei immediately at a lower pH environment, and they diffuse inside and outside cells for neutral pH environments, with which Aβ40 peptides interact more frequently, because most of the produced peptides is Aβ40 (∼90%).62–64) Thus, the large amount of Aβ40 peptides deposit on the Aβ42 nuclei to cause and grow oligomeric structures.
Figure 15.
Schematic of monitoring the aggregation reaction of amyloid β (Aβ) monomers on various nuclei immobilized on the quartz crystals surfaces.
Figure 16.
Real-time monitoring of deposition behaviors of (a) amyloid β 1–40 (Aβ40) and (b) amyloid β 1–42 (Aβ42) peptides on their homogeneous nuclei. The flowed monomer concentrations were 12 µM for both cases. Fundamental resonance frequencies were around 55 MHz. The times for growing the nuclei are shown. These figures were reproduced with permission from Ogi et al.57)
Figure 17.
(a) Deposition behaviors of amyloid β 1–40 (Aβ40) peptides on amyloid β 1–42 (Aβ42) nuclei grown at pH 7.4 and pH 4.6 monitored by a WE-MQCM simultaneously. (b) The deposition rates for depositions of Aβ40 and Aβ42 on nuclei grown at pH 4.6. Symbols [F] and [O] mean that deposited structures were principally fibrils and oligomeric structures, respectively. The notation 40/42, for example, denotes the deposition of Aβ40 monomer on Aβ42 nuclei. Fundamental resonance frequencies were around 55 MHz. These figures were reproduced with permission from Ogi et al.57)
Figure 18.
AFM images (2 µm × 2 µm) for (a) amyloid β 1–42 (Aβ42) nuclei grown at pH 4.6 for 40 h and (b) resultant structure by deposition of amyloid β 1–40 (Aβ40) monomer at pH 7.4 for 40 h. These figures were reproduced with permission from Ogi et al.57)
Frequency responses in Figs. 16 and 17 are not so smooth as those observed for other binding systems. Unlike a usual antigen-antibody binding reaction with a single equilibrium constant, accumulation reaction of Aβ peptides progresses with much more complexity. For example, multiple kinetics will appear including the fibril-end kinetics for transition into the active end and the kinetics for monomer attachment. In this case, an uneven frequency response is expected even in the macroscopic measurement, because all monomers are simultaneously dissolved to grow nuclei. Similar multi-kinetics mechanism will appear in the case of oligomer formation. Thus, the non-smooth frequency change will be a characteristic in the deposition reaction of the Aβ peptides.58)
RAMNE-Q biosensors
While a thinner quartz oscillator achieves a high-sensitive QCM biosensor, it is fragile and easy to break up during its installation in the sensor cell. Also, in a WE-QCM setup, a part of the quartz plate was fixed by sandwiching with two silicon-rubber gaskets, deteriorating the Q value (∼800 at 170 MHz at most). As a breakthrough to these problems, the resonance acoustic microbalance with naked embedded quartz (RAMNE-Q) chip was proposed.65–67) It embeds a bare thin quartz oscillator in a microchannel fabricated in Si wafer by the microelectromechanical system (MEMS) technology, achieving a reusable high-frequency (fundamental resonance frequency of 178 MHz) and high-Q (∼1500) biosensor.
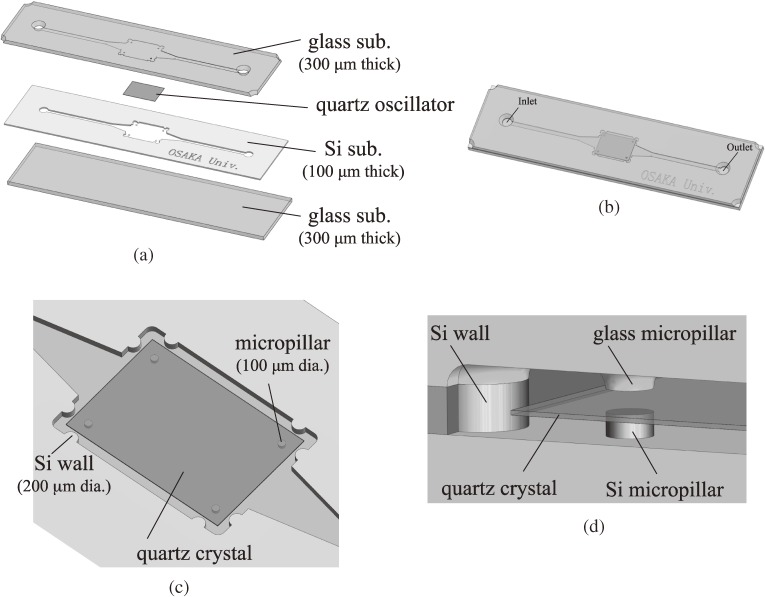
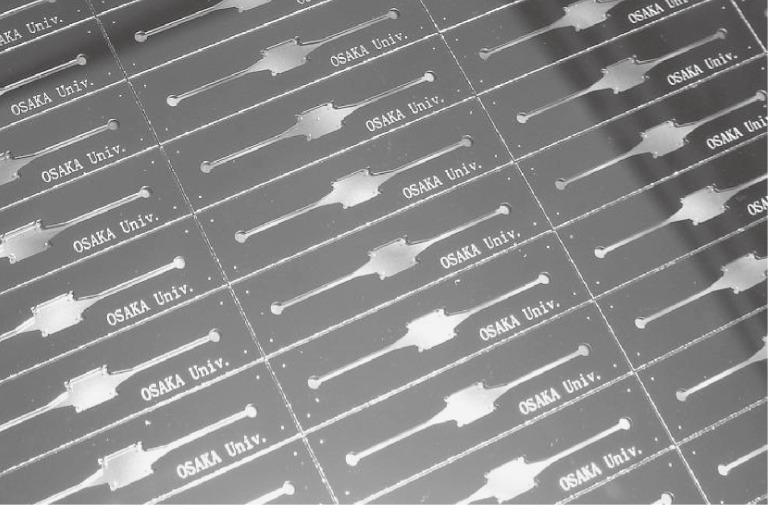
A RAMNE-Q chip is composed of three substrates (glass/silicon/glass) as shown in Figs. 19(a) and (b). The Si microchannel is fabricated by inductively coupled plasma reactive-ion etching (ICP-RIE) into the middle silicon substrate, and a naked AT-cut quartz oscillator is embedded in the microchannel, which is supported by the micropillars and microwalls without fixed parts as illustrated in Figs. 19(c) and (d). The quartz oscillator becomes stable with the point-contact supports even in a solution-flow state. The glass substrates are bonded to both sides of the silicon substrate by the anodic-bonding method. This biosensor chip remains reusable owing to the integration with a rigid package; a washing procedure releases the bonded proteins from the surfaces, making the naked surfaces repeatedly. The structural damping is restricted by the minimized contacts (point contacts) with the quartz oscillator, achieving a high-Q value (∼1500) in the solution flow. Figure 20 shows the appearance of the fabricated RAMNE-Q biosensors before the singulation from the ware.
Figure 19.
(a) Stack of the RAMNE-Q chip. (b) Appearance of the RAMNE-Q chip. (c) The rectangular space in the Si microchannel, where the quartz oscillator is installed. (d) A closeup near the corner. These figures were reproduced with permission from Kato et al.66)
Figure 20.
Appearance of RAMNE-Q chips before the singulation.
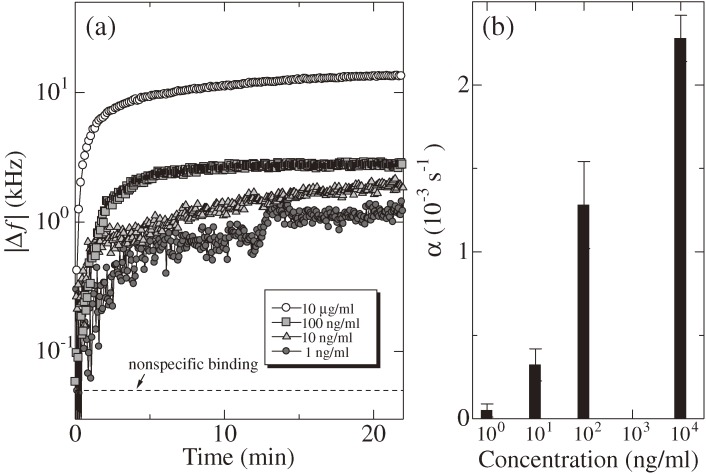
Figure 21 displays the usability of a RAMNE-Q biosensor. A real-time monitoring for detecting hIgG molecules was performed using nonspecifically immobilized SPA molecules on the quartz oscillator. The hIgG concentration was between 0.001–10 µg/ml. A glycin-HCl buffer solution was used for dissociating hIgG from SPA after each binding reaction. The maximum frequency change is shown by the dashed line in Fig. 21(a) for the injection of 10 ng/ml hIgG solution when the SPA molecule was absent, which corresponds to the negative (nonspecific) binding assay. Thus, the specific biding causes significantly larger frequency change (∼20 kHz for 10 ng/ml) than the nonspecific binding (0.05 kHz).
Figure 21.
(a) Binding curves for injections of human immunoglobulin G (hIgG)/PBS solutions of various concentrations from 1 ng/ml and 10 µg/ml in a logarithmic scale (f1 = 178 MHz). (b) The exponential coefficient α for various concentration hIgG solutions. These figures were reproduced with permission from Kato et al.66)
It is appropriate to use Eq. [1] for evaluating the concentration because it is independent of the amount of the receptor protein on the surface. Figure 21(b) shows the α values obtained for different-concentration hIgG solutions, showing a good correlation with the hIgG concentration. The same RAMNE-Q chip was used for many measurements; it was washed before the measurement every time. Nevertheless, identical results were obtained as shown with the error bars in Fig. 21(b), showing the high reproducibility of a single RAMNE-Q biosensor.
Sensitivity amplification with sandwich assays
As an important practical use, QCM biosensors are expected to detect biomarkers. However, human serum contains many blood proteins, and they are adsorbed on the sensor chip surfaces nonspecifically, making it difficult to extract from the total frequency response the small frequency change caused by the binding of a target protein with the receptor on the surface. Also, threshold concentrations are usually lower than the detection limit of QCM biosensors. To overcome these difficulty, mass-amplified sandwich-assay methods were proposed. Gold nanoparticles were, for example, used for the mass amplification in QCM assays.68–70) However, high affinity of gold for proteins32) causes nonspecific adsorption on receptor proteins. Also, preparation of surface-modified particles takes longer. In the WE-QCM, a mass-amplification method using streptavidin was proposed,30) where streptavidin molecules quickly combines with biotins with extremely high affinity. As a target protein, the C-reactive protein (CRP) was adopted, which is an important biomarker for checking inflammation. Its threshold level is about 30 ng/ml, and a very quick assay is often required in an emergency case to judge the cause of illness.
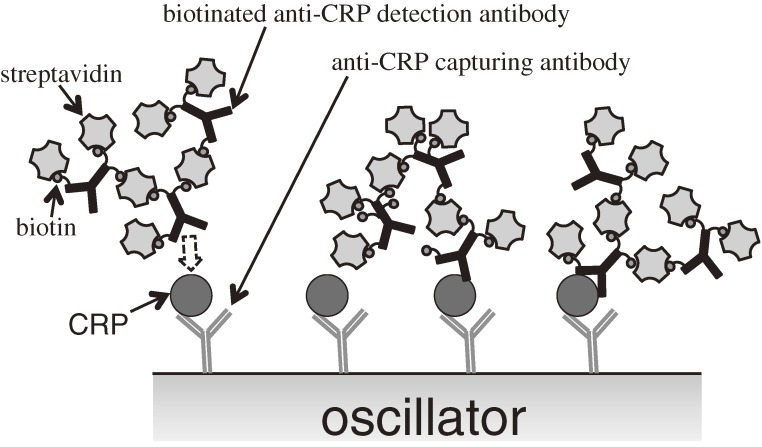
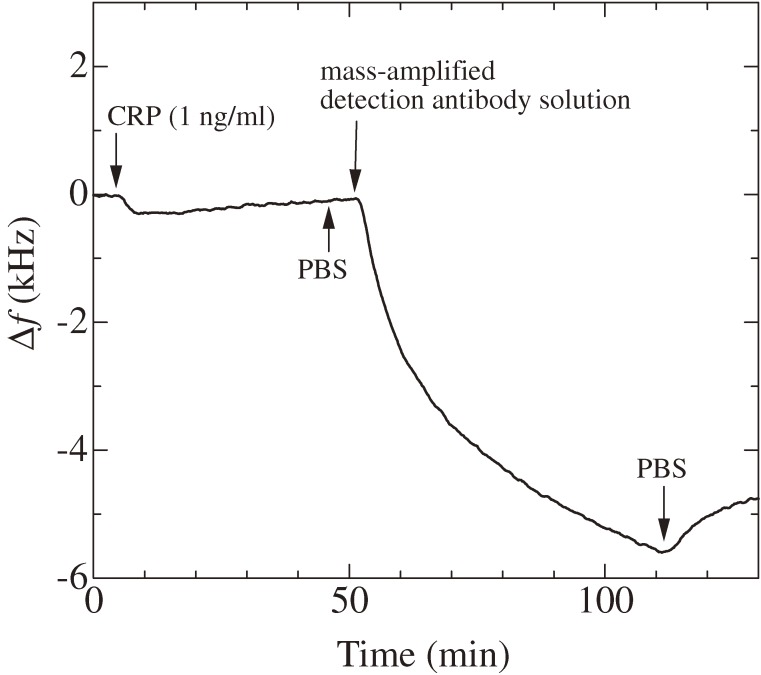
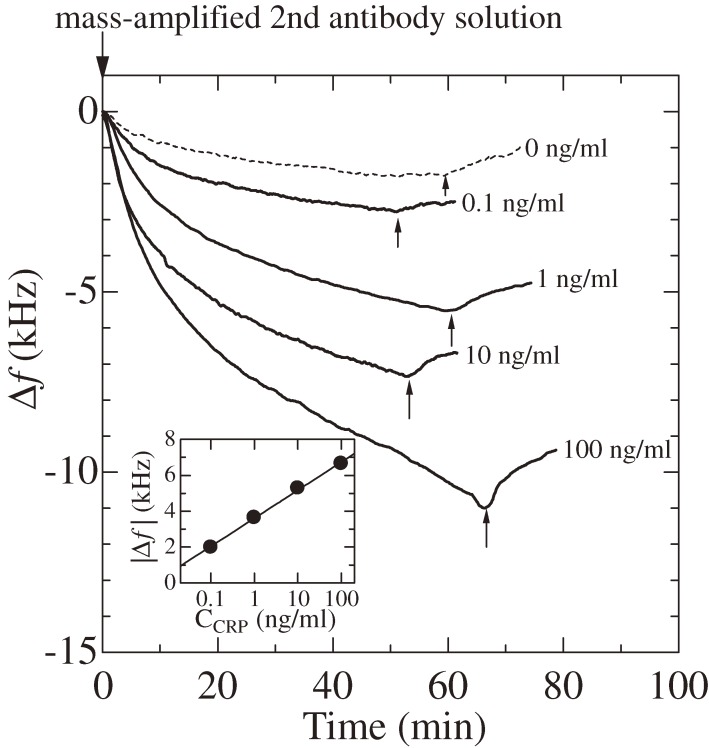
Figure 22 shows the schematic of the sandwich assay with the mass-amplified detection antibody. Because a single streptavidin has four binding sites with biotin, it can connect more than two antibody molecules through biotin terminals. The molecular mass of the detection-antibody complex was estimated to be 3.2 MDa, corresponding to a complex of six detection antibodies with seven streptavidins attached to each antibody. Figure 23 shows an example of the enhanced frequency change by the mass-amplified detection-antibody solution. Injection of the 1 ng/ml CRP solution caused only a 200-Hz frequency decrease, and the baseline increased after 15 min from the injection. Thus, it would have been difficult to estimate the amount of the frequency change caused by the binding of CRP with the capturing antibody. The injection of the mass-amplified detection-antibody solution, however, caused nearly a 5-kHz frequency change, demonstrating the successful amplification of the mass sensitivity. Figure 24 shows the binding curves observed after the arrival of the mass-amplified detection-antibody solution, which was followed by injection of CRP solutions and the PBS solution. The frequency decrease was observed even for the injection of the detection-antibody solution after the analyte solution without CRP molecules (0 ng/ml), indicating the nonspecific binding of the detection-antibody complex onto the capturing antibody. However, this frequency change was significantly smaller than those observed for the analyte solutions containing CRP molecules. The inset in Fig. 24 shows the correlation between the frequency decrement at 20 min after the arrival time of the mass-amplified detection-antibody solution and the concentration of the CRP solution. Such a correlation was obtained when antibodies from the same production lots were used; the frequency change fluctuated among assays from different production lots.30)
Figure 22.
Schematic presentation of the sandwich assay using the mass-amplified detection anti C-reactive-protein (CRP) antibody. This figure was reproduced with permission from Ogi et al.30)
Figure 23.
Frequency response for injections of a 1 ng/ml C reactive protein (CRP), PBS, and the mass-amplified detection-antibody solutions (f1 = 180 MHz). Arrows indicate arrival times of solutions at the sensor cell. This figure was reproduced with permission from Ogi et al.30)
Figure 24.
Binding curves observed for the injection of the mass-amplified detection-antibody solution after the injection of the C-reactive-protein (CRP) solution with various concentrations (f1 = 180 MHz). Arrows indicate the beginning of washing step. The numbers denote the concentration of the CRP solution injected before the mass-amplified detection-antibody solution. The inset shows the correlation between the frequency change and the CRP concentration CCRP at 20 min. This figure was reproduced with permission from Ogi et al.30)
Conclusions
The wireless-electrodeless quartz-crystal-microbalance biosensors have shown great capabilities of quantitatively studying interactions between biomolecules with high sensitivity (large frequency change). Its replacement-free nature will allow us to install it into civilian goods for health and food monitoring. Its sensitivity will be further improved with the RAMNE-Q technology, which also yields high reproducibility and the price reduction with the mass production. The electrodeless aspect of the WE-QCM easily allows its integration with a high-resolution optical methods such as the total internal reflection fluorescence microscopy and confocal microscopy. Therefore, the WE-QCM will be a key measurement tool in life-science studies and diagnosis in near future.
Acknowledgements
The author is deeply grateful to Professor Masahiko Hirao at Osaka University for his continuous help for this research and to Dr. Fumihito Kato at Osaka University for his help for fabricating RAMNE-Q biosensors.
Profile
Hirotsugu Ogi was born in 1967 in Kyoto, Japan. He received BS and MS degrees from Osaka University in mechanical engineering in 1991 and 1993, respectively, and became a research associate at Osaka University in 1993. He received his Ph.D. in 1997 from Osaka University for the study on electromagnetic acoustic resonance for materials characterization. He was invited from National Institute of Standards and Technology in U.S.A. as a guest researcher for fourteen months from July in 1997, where he studied on elastic and anelastic properties of materials. He became an Associate Professor at Osaka University in 2000. He currently studies materials science and bioscience with his originally developed acoustic methods. He was awarded JSPS Prize in 2012 for study on high-sensitive acoustic biosensors.
References
- 1).Green M. (2004) Semiconductor quantum dots as biological imaging agents. Angew. Chem. Int. Ed. Engl. 43, 4129–4131 [DOI] [PubMed] [Google Scholar]
- 2).Bruchez M., Moronne M., Gin P., Weiss S., Alivisatos A. (1998) Semiconductor nanocrystals as fluorescent biological labels. Science 281, 2013–2016 [DOI] [PubMed] [Google Scholar]
- 3).Terpe K. (2003) Overview of tag protein fusions: from molecular and biochemical fundamentals to commercial systems. Appl. Microbiol. Biotechnol. 60, 523–533 [DOI] [PubMed] [Google Scholar]
- 4).Guignet E., Hovius R., Vogel H. (2004) Reversible site-selective labeling of membrane proteins in live cells. Nat. Biotechnol. 22, 440–444 [DOI] [PubMed] [Google Scholar]
- 5).Ojida A., Honda K., Shinmi D., Kiyonaka S., Mori Y., Hamachi I. (2006) Oligo-asp tag/Zn(II) complex probe as a new pair for labeling and fluorescence imaging of proteins. J. Am. Chem. Soc. 128, 10452–10459 [DOI] [PubMed] [Google Scholar]
- 6).Nedelkov D. (2007) Development of surface plasmon resonance mass spectrometry array platform. Anal. Chem. 79, 5987–5990 [DOI] [PMC free article] [PubMed] [Google Scholar]
- 7).Hoa X.D., Kirk A.G., Tabrizian M. (2007) Towards integrated and sensitive surface plasmon resonance biosensors: A review of recent progress. Biosens. Bioelectron. 23, 151–160 [DOI] [PubMed] [Google Scholar]
- 8).Kurita R., Yokota Y., Ueda A., Niwa O. (2007) Electrochemical surface plasmon resonance measurement in a microliter volume flow cell for evaluating the affinity and catalytic activity of biomolecules. Anal. Chem. 79, 9572–9576 [DOI] [PubMed] [Google Scholar]
- 9).Muramatsu H., Dicks M., Tamiya E., Karube I. (1987) Piezoelectric crystal biosensor modified with protein A for determination of immunoglobulins. Anal. Chem. 59, 2760–2763 [DOI] [PubMed] [Google Scholar]
- 10).Liu Y., Yu X., Zhao R., Shangguan D., Bo Z., Liu G. (2003) Quartz crystal biosensor for real-time monitoring of molecular recognition between protein and small molecular medicinal agents. Biosens. Bioelectron. 19, 9–19 [DOI] [PubMed] [Google Scholar]
- 11).Ogi H., Motohisa K., Matsumoto T., Hatanaka K., Hirao M. (2006) Isolated electrodeless high-frequency quartz crystal microbalance for immunosensors. Anal. Chem. 78, 6903–6909 [DOI] [PubMed] [Google Scholar]
- 12).Pei Y., Yu H., Pei Z., Theurer M., Ammer C., Andre S., Gabius H.-J., Yan M., Ramstrom O. (2007) Photoderivatized polymer thin films at quartz crystal microbalance surfaces: sensors for carbohydrate-protein interactions. Anal. Chem. 79, 6897–6902 [DOI] [PMC free article] [PubMed] [Google Scholar]
- 13).Sauerbrey G. (1959) Verwendung von Schwingquarzen zur Wägung dünner Schichten und zur Mikrowägung. Z. Phys. 155, 206–222 [Google Scholar]
- 14).Eddowes M.J. (1987) Direct immunochemical sensing: basic chemical principles and fundamental limitations. Biosensors 3, 1–15 [DOI] [PubMed] [Google Scholar]
- 15).Kanazawa K., Gordon J. (1985) Frequency of a quartz microbalance in contact with liquid. Anal. Chem. 57, 1770–1771 [Google Scholar]
- 16).Reed C.E., Kanazawa K.K., Kaufman J.H. (1993) Physical description of a viscoelastically loaded AT-cut quartz resonator. J. Appl. Phys. 68, 1993–2001 [Google Scholar]
- 17).Voinova M.V., Jonson M., Kasemo B. (1997) Dynamics of viscous amphiphilic films supported by elastic solid substrates. J. Phys. Condens. Matter 9, 7799–7808 [Google Scholar]
- 18).Höök F., Kasemo B., Nylander T., Fant C., Sott K., Elwing H. (2001) Variations in coupled water, viscoelastic properties, and film thickness of a mefp-1 protein film during adsorption and cross-linking: A quartz crystal microbalance with dissipation monitoring, ellipsometry, and surface plasmon resonance study. Anal. Chem. 73, 5796–5804 [DOI] [PubMed] [Google Scholar]
- 19).Jonsson M.P., Jönsson P., Höök F. (2008) Simultaneous nanoplasmonic and quartz crystal microbalance sensing: Analysis of biomolecular conformational changes and quantification of the bound molecular mass. Anal. Chem. 80, 7988–7995 [DOI] [PubMed] [Google Scholar]
- 20).Patel A.R., Kanazawa K.K., Frank C.W. (2009) Antibody binding to a tethered vesicle assembly using QCM-D. Anal. Chem. 81, 6021–6029 [DOI] [PubMed] [Google Scholar]
- 21).Yan M., Liu C., Wang D., Ni J., Cheng J. (2011) Characterization of adsorption of humic acid onto alumina using quartz crystal microbalance with dissipation. Langmuir 27, 9860–9865 [DOI] [PubMed] [Google Scholar]
- 22).Ogi H., Nagai H., Fukunishi Y., Hirao M., Nishiyama M. (2009) 170-MHz electrodeless quartz crystal microbalance biosensor: Capability and limitation of higher frequency measurement. Anal. Chem. 81, 8068–8073 [DOI] [PubMed] [Google Scholar]
- 23).Guzmn E., Ritacco H., Ortega F., Svitova T., Radke C.J., Rubio R.G. (2009) Adsorption kinetics and mechanical properties of ultrathin polyelectrolyte multilayers: Liquid-supported versus solid-supported films. J. Phys. Chem. B 113, 7128–7137 [DOI] [PubMed] [Google Scholar]
- 24).Kang H., Muramatsu H. (2009) Monitoring of cultured cell activity by the quartz crystal and the micro CCD camera under chemical stressors. Biosens. Bioelectron. 24, 1318–1323 [DOI] [PubMed] [Google Scholar]
- 25).Wang S., Milam J., Ohlin A.C., Rambaran V.H., Clark E., Ward W., Seymour L., Casey W.H., Holder A.A., Miao W. (2009) Electrochemical and electrogenerated chemiluminescent studies of a trinuclear complex, [((phen)2Ru(dpp))2RhCl2]5+, and its interactions with calf thymus DNA. Anal. Chem. 81, 4068–4075 [DOI] [PubMed] [Google Scholar]
- 26).Natesan M., Cooper M.A., Tran J.P., Rivera V.R., Poli M.A. (2009) Quantitative detection of staphylococcal enterotoxin B by resonant acoustic profiling. Anal. Chem. 81, 3896–3902 [DOI] [PubMed] [Google Scholar]
- 27).Furusawa H., Komatsu M., Okahata Y. (2009) In situ monitoring of conformational changes of and peptide bindings to calmodulin on a 27 MHz quartz-crystal microbalance. Anal. Chem. 81, 1841–1847 [DOI] [PubMed] [Google Scholar]
- 28).Furusawa H., Ozeki T., Morita M., Okahata Y. (2009) Added mass effect on immobilizations of proteins on a 27 MHz quartz crystal microbalance in aqueous solution. Anal. Chem. 81, 2268–2273 [DOI] [PubMed] [Google Scholar]
- 29).Uttenthaler E., Schr’aml M., Mandel J., Drost S. (2001) Ultrasensitive quartz crystal microbalance sensors for detection of M13-Phages in liquids. Biosens. Bioelectron. 16, 735–743 [DOI] [PubMed] [Google Scholar]
- 30).Ogi H., Yanagida T., Hirao M., Nishiyama M. (2011) Replacement-free mass-amplified sandwich assay with 180-MHz electrodeless quartz-crystal microbalance biosensor. Biosens. Bioelectron. 26, 4819–4822 [DOI] [PubMed] [Google Scholar]
- 31).Ogi H., Okamoto K., Nagai H., Fukunishi Y., Hirao M. (2009) Replacement-free electrodeless quartz crystal microbalance biosensor using nonspecific-adsorption of streptavidin on quartz. Anal. Chem. 81, 4015–4020 [DOI] [PubMed] [Google Scholar]
- 32).Ogi H., Fukunishi Y., Nagai H., Okamoto K., Hirao M., Nishiyama M. (2009) Nonspecific-adsorption behavior of polyethylenglycol and bovine serum albumin studied by 55-MHz wireless–electrodeless quartz crystal microbalance. Biosens. Bioelectron. 24, 3148–3152 [DOI] [PubMed] [Google Scholar]
- 33).Hirao M., Ogi H., Fukuoka H. (1993) Resonance EMAT system for acoustoelastic stress evaluation in sheet metals. Rev. Sci. Instrum. 64, 3198–3205 [Google Scholar]
- 34).Petersen G.L., Chick B.B., Fortunko C.M., Mirao M. (1994) Resonance techniques and apparatus for elastic-wave velocity determination in thin metal plates. Rev. Sci. Instrum. 65, 192–198 [Google Scholar]
- 35).Ogi H., Niho H., Hirao M. (2006) Internal-friction mapping on solids by resonance ultrasound microscopy. Appl. Phys. Lett. 88, 141110 [Google Scholar]
- 36).Ogi H., Motohisa K., Hatanaka K., Ohmori T., Hirao M., Nishiyama M. (2007) Concentration dependence of IgG–protein A affinity studied by wireless-electrodeless QCM. Biosens. Bioelectron. 22, 3238–3242 [DOI] [PubMed] [Google Scholar]
- 37).Hanson D.C., Schumaker V.N. (1984) A model for the formation and interconversion of protein A-immunoglobulin G soluble complexes. J. Immunol. 132, 1397–1409 [PubMed] [Google Scholar]
- 38).Ogi H., Fukunishi Y., Omori T., Hatanaka K., Hirao M., Nishiyama M. (2008) Effects of flow rate on sensitivity and affinity in flow injection biosensor systems studied by 55-MHz wireless quartz crystal microbalance. Anal. Chem. 80, 5494–5500 [DOI] [PubMed] [Google Scholar]
- 39).Tatsuma T., Watanabe Y., Oyama N. (1999) Multichannel quartz crystal microbalance. Anal. Chem. 71, 3632–3636 [DOI] [PubMed] [Google Scholar]
- 40).Abe T., Esashi M. (2000) One-chip multichannel quartz crystal microbalance (QCM) fabricated by Deep RIE. Sens. Actuators A Phys. 82, 139–143 [Google Scholar]
- 41).Hung V.N., Abe T., Minh P.N., Esashi M. (2002) Miniaturized, highly sensitive single-chip multichannel quartz-crystal microbalance. Appl. Phys. Lett. 81, 5069–5071 [Google Scholar]
- 42).Hung V.N., Abe T., Minh P.N., Esashi M. (2003) High-frequency one-chip multichannel quartz crystal microbalance fabricated by deep RIE. Sens. Actuators A Phys. 108, 91–96 [Google Scholar]
- 43).Jin X., Huang Y., Mason A., Zeng X. (2009) Multichannel monolithic quartz crystal microbalance gas sensor array. Anal. Chem. 81, 595–603 [DOI] [PubMed] [Google Scholar]
- 44).Zhang B., Mao Q., Zhang X., Jiang T., Chen M., Yu F., Fu W. (2004) A novel piezoelectric quartz micro-array immunosensor based on self-assembled monolayer for determination of human chorionic gonadotropin. Biosens. Bioelectron. 19, 711–720 [DOI] [PubMed] [Google Scholar]
- 45).Ogi H., Nagai H., Fukunishi Y., Yanagida T., Hirao M., Nishiyama M. (2010) Multichannel wireless-electrodeless quartz-crystal microbalance immunosensor. Anal. Chem. 82, 3957–3962 [DOI] [PubMed] [Google Scholar]
- 46).Hanson D.C., Phillips M.L., Schumaker V.N. (1984) Electron microscopic and hydrodynamic studies of protein A-immunoglobulin G soluble complexes. J. Immunol. 132, 1386–1396 [PubMed] [Google Scholar]
- 47).Lambert M.P., Barlow A.K., Chromy B.A., Edwards C., Freed R., Liosatos M., Morgan T.E., Rozovsky I., Trommer B., Viola K.L., Wals P., Zhang C., Finch C.E., Krafft G.A., Klein W.L. (1998) Diffusible, nonfibrillar ligands derived from Aβ1–42 are potent central nervous system neurotoxins. Proc. Natl. Acad. Sci. U.S.A. 95, 6448–6453 [DOI] [PMC free article] [PubMed] [Google Scholar]
- 48).Bucciantini M., Giannoni E., Chiti F., Baroni F., Formigli L., Zurdo J., Taddei N., Ramponi G., Dobson C.M., Stefani M. (2002) Inherent toxicity of aggregates implies a common mechanism for protein misfolding diseases. Nature 416, 507–511 [DOI] [PubMed] [Google Scholar]
- 49).Stefani M., Dobson C.M. (2003) Protein aggregation and aggregate toxicity: new insights into protein folding, misfolding diseases and biological evolution. J. Mol. Med. 81, 678–699 [DOI] [PubMed] [Google Scholar]
- 50).LaFerla F.M., Green K.N., Oddo S. (2007) Intracellular amyloid-beta in Alzheimer's disease. Nat. Rev. Neurosci. 8, 499–509 [DOI] [PubMed] [Google Scholar]
- 51).Jarrett J.T., Berger E.P., Lansbury P.T., Jr. (1993) The carboxy terminus of the β amyloid protein is critical for the seeding of amyloid formation: Implications for the pathogenesis of Alzheimer's disease. Biochemistry 32, 4693–4697 [DOI] [PubMed] [Google Scholar]
- 52).Takahashi R.H., Milner T.A., Li F., Nam E.E., Edgar M.A., Yamaguchi H., Beal M.F., Xu H., Greengard P., Gouras G.K. (2002) Intraneuronal Alzheimer Aβ42 accumulates in multivesicular bodies and is associated with synaptic pathology. Am. J. Pathol. 161, 1869–1879 [DOI] [PMC free article] [PubMed] [Google Scholar]
- 53).Wood S.J., Maleeff B., Hart T., Wetzel R. (1996) Physical, morphological and functional differences between pH 5.8 and 7.4 aggregates of the Alzheimer's amyloid peptide Aβ. J. Mol. Biol. 256, 870–877 [DOI] [PubMed] [Google Scholar]
- 54).Nybo M., Svehag S.-E., Nielsen E.H. (1999) An ultrastructural study of amyloid intermediates in Aβ1–42 fibrillogenesis. Scand. J. Immunol. 49, 219–223 [DOI] [PubMed] [Google Scholar]
- 55).Bitan G., Kirkitadze M.D., Lomakin A., Vollers S.S., Benedek G.B., Teplow D.B. (2003) Amyloid β-protein (Aβ) assembly: Aβ40 and Aβ42 oligomerize through distinct pathways. Proc. Natl. Acad. Sci. U.S.A. 100, 330–335 [DOI] [PMC free article] [PubMed] [Google Scholar]
- 56).Benseny-Cases N., Cocera M., Cladera J. (2007) Conversion of non-fibrillar β-sheet oligomers into amyloid fibrils in Alzheimer’s disease amyloid peptide aggregation. Biochem. Biophys. Res. Commun. 361, 916–921 [DOI] [PubMed] [Google Scholar]
- 57).Ogi H., Fukunishi Y., Yanagida T., Yagi H., Goto Y., Fukushima M., Uesugi K., Hirao M. (2011) Seed-dependent deposition behavior of Aβ peptides studied with wireless quartz-crystal-microbalance biosensor. Anal. Chem. 83, 4982–4988 [DOI] [PubMed] [Google Scholar]
- 58).Ogi H., Fukushima M., Uesugi K., Yagi H., Goto Y., Hirao M. (2013) Acceleration of deposition of Aβ1–40 peptide on ultrasonically formed Aβ1–42 nucleus studied by wireless quartz-crystal-microbalance biosensor. Biosens. Bioelectron. 40, 200–205 [DOI] [PubMed] [Google Scholar]
- 59).Klein W.L., Krafft G.A., Finch C.E. (2001) Targeting small Aβ oligomers: the solution to an Alzheimer's disease conundrum? Trends Neurosci. 24, 219–224 [DOI] [PubMed] [Google Scholar]
- 60).Mastrangelo I.A., Ahmed M., Sato T., Liu W., Wang C., Hough P., Smith S.O. (2006) High-resolution atomic force microscopy of aoluble Aβ42 oligomers. J. Mol. Biol. 358, 106–119 [DOI] [PubMed] [Google Scholar]
- 61).Walsh D.M., Klyubin I., Fadeeva J.V., Cullen W.K., Anwyl R., Wolfe M.S., Rowan M.J., Selkoe D.J. (2002) Naturally secreted oligomers of amyloid protein potently inhibit hippocampal long-term potentiation in vivo. Nature 416, 535–539 [DOI] [PubMed] [Google Scholar]
- 62).Suzuki N., Cheung T.T., Cai X.-D., Odaka A., Otvos L., Jr., Eckman C., Golde T.E., Younkin S.G. (1994) An increased percentage of long amyloid beta protein secreted by familial amyloid beta protein precursor (beta APP717) mutants. Science 264, 1336–1340 [DOI] [PubMed] [Google Scholar]
- 63).Iwatsubo T., Odaka A., Suzuki N., Mizusawa H., Nukina N., Ihara Y. (1994) Visualization of Aβ42(43) and Aβ40 in senile plaques with end-specific Aβ monoclonals: Evidence that an initially deposited species is Aβ42(43). Neuron 13, 45–53 [DOI] [PubMed] [Google Scholar]
- 64).Gravina S.A., Ho L.B., Eckman C.B., Long K.E., Otvos L., Jr., Younkin L.H., Suzuki N., Younkin S.G. (1995) Amyloid β protein (Aβ) in Alzheimer's disease brain. J. Biol. Chem. 270, 7013–7016 [DOI] [PubMed] [Google Scholar]
- 65).Kato F., Ogi H., Yanagida T., Nishikawa S., Nishiyama M., Hirao M. (2011) High-frequency electrodeless quartz crystal microbalance chip with a bare quartz resonator encapsulated in a silicon microchannel. Jpn. J. Appl. Phys. 50, 07HD03 [Google Scholar]
- 66).Kato F., Ogi H., Yanagida T., Nishikawa S., Hirao M., Nishiyama M. (2012) Resonance acoustic microbalance with naked-embedded quartz (RAMNE-Q) biosensor fabricated by microelectromechanical-system process. Biosens. Bioelectron. 33, 139–145 [DOI] [PubMed] [Google Scholar]
- 67).Kato F., Tsurimoto K., Ogi H., Hirao M. (2013) Application of sandwich assay to resonance acoustic microbalance with naked-embedded quartz biosensor for high-selectivity detection of C-reactive protein. Jpn. J. Appl. Phys. 52, 07HD11 [Google Scholar]
- 68).Mao X., Yang L., Su X.-L., Li Y. (2006) A nanoparticle amplification based quartz crystal microbalance DNA sensor for detection of Escherichia coli O157:H7. Biosens. Bioelectron. 21, 1178–1185 [DOI] [PubMed] [Google Scholar]
- 69).Zhu Z., Su Y., Li J., Li D., Zhang J., Song S., Zhao Y., Li G., Fan C. (2009) Highly sensitive electrochemical sensor for mercury(II) ions by using a mercury-specific oligonucleotide probe and gold nanoparticle-based amplification. Anal. Chem. 81, 7660–7666 [DOI] [PubMed] [Google Scholar]
- 70).Chen Q., Tang W., Wang D., Wu X., Li N., Liu F. (2010) Amplified QCM-D biosensor for protein based on aptamer-functionalized gold nanoparticles. Biosens. Bioelectron. 26, 575–579 [DOI] [PubMed] [Google Scholar]


