

Abstract
Blurring of the cortical gray and white matter border on MRI is associated with normal aging, pathological aging, and the presence of focal cortical dysplasia. However, it remains unclear whether normal variations in signal intensity contrast at the gray and white matter junction reflect the functional integrity of subjacent tissue. This study explores the relationship between verbal abilities and gray and white matter contrast (GWC) in healthy human adults. Participants were scanned at 3 T MRI and administered standardized measures of verbal expression and verbal working memory. GWC was estimated by calculating the non-normalized T1 image intensity contrast above and below the cortical gray/white matter interface. Spherical averaging and whole-brain correlational analyses were performed. Sulcal regions exhibited higher contrast compared to gyral regions. We found a strongly lateralized and regionally specific profile with reduced verbal expression abilities associated with blurring in left hemisphere inferior frontal cortex and temporal pole. Reduced verbal working memory was associated with blurring in widespread left frontal and temporal cortices. Such lateralized and focal results provide support for GWC as a measure of regional functional integrity and highlight its potential role in probing the neuroanatomical substrates of cognition in healthy and diseased populations.
Introduction
Blurring of the gray and white matter juncture is an important marker of neuropathology (Barkovich et al., 2001). Until recently, appreciation of gray and white matter contrast (GWC) was limited to visual inspection of MRI scans; however, new surface-based postprocessing methods allow for quantification of subtle variations in GWC across the cortical mantle. This enables assessment of age-related and disease-related changes in gray and white matter contrast that may not be visually apparent on gross inspection of MRI images. Importantly, it also enables the investigation of regional blurring effects associated with cognitive abilities in healthy individuals.
Blurring of the gray and white matter junction occurs in normal aging, showing larger effect sizes than cortical thinning (Salat et al., 2009). Increased gray–white blurring is found in individuals with Alzheimer's disease (AD) compared to age-matched healthy controls (Salat et al., 2011), with particularly strong effects in temporal and limbic regions. Regional blurring in inferior lateral and medial temporal regions is associated with the extent of hippocampal volume loss in individuals with AD, even after controlling for cortical thinning, suggesting that blurring may reflect a distinct pathology from traditional measures of cortical thickness or volume loss (Salat et al., 2011).
Regional blurring is an established marker of focal cortical neuropathology, particularly in the radiological diagnosis of focal cortical dysplasia (FCD) (Barkovich et al., 2001; Colombo et al., 2003; Huppertz et al., 2005; Thesen et al., 2011). In addition to histological abnormalities in gray matter, such as large dysmorphic neurons and balloon cells, which can lead to cortical thickening in FCD (Blümcke et al., 2011), there is a greater density of white matter neurons just adjacent to the gray–white boundary (Andres et al., 2005; Sisodiya et al., 2009). Together with hypomyelination and gliosis, this can result in blurring of the gray–white boundary in the dysplastic region (Bernasconi et al., 2011). Using cortical thickness and GWC metrics together detects the presence of epileptogenic cortical malformations (of which FCD is one subtype) with high sensitivity and specificity (Thesen et al., 2011).
Despite evidence of age-related and disease-related blurring of the gray–white boundary, it remains unclear whether focal regions of decreased GWC are associated with diminished neuronal functional integrity. Although domain-specific cognitive inefficiency is found in focal cortical dysplasia (Oki et al., 1999; Klein et al., 2000), the direct relationship between regional blurring and function has not been investigated. Multiple contributing factors would have to be considered in a sample of neurologically compromised individuals, making it difficult to establish whether decreased contrast independently contributes to cognitive inefficiency. Therefore, we investigated whether regional blurring of the gray and white boundary is associated with cognitive abilities in neurologically intact volunteers. We chose verbal performance measures for their lateralizing and localizing potential (Turken and Dronkers, 2011) and hypothesized that increased gray–white blurring of left hemisphere language regions such as inferior frontal cortex (Broca's area), lateral temporal, and inferior parietal regions would be associated with individual differences in verbal abilities, relative to age-matched peers, on standardized verbal intelligence indices.
Materials and Methods
Participants.
A sample of 32 healthy adults (16 males/16 females) recruited from the community through Internet-based advertisement gave consent to participate in the study. Participants were determined to be free of psychiatric and neurological disorders through an initial semistructured screening interview. The age range was 21–66 years (mean = 42.36, SD = 11.38). Participants were all right handed, as determined by the Edinburgh Handedness Inventory (Oldfield, 1971), with scores ranging from 40 to 100 (mean = 85.63, SD = 16.40). All participants were above a borderline level of IQ on the Wechsler Adult Intelligence Scale—Third Edition. Full-scale IQ scores ranged from 84 to 143 (mean = 109.53, SD = 16.50). Group education level ranged from an eighth grade education to a graduate degree (mean years of education = 15.19, SD = 2.74). This study was approved by the Institutional Review Board of New York University.
Cognitive assessment.
All subjects completed the Wechsler Adult Intelligence Scale—Third Edition (WAIS-III), a standardized intelligence measure comprised of several subtests that assess a wide-range of cognitive abilities (Wechsler, 1997). Factor analyses of the WAIS-III subtests have identified four indices, two of which are associated with verbal abilities: the Verbal Comprehension Index (VCI) and the Working Memory Index (WMI); and two of which are associated with nonverbal/visuospatial abilities: the Perceptual Organization Index and the Processing Speed Index. Total index scores are calculated based on the sum of the subtest age-corrected scores. Each participant's index Standard Score reflects their performance relative to their age-matched peers (within 5–10 years). We chose to analyze VCI and WMI indices for their neuroanatomical localizing potential, given prior evidence of hemispheric and regionally specific neural substrates for these indices (Gläscher et al., 2009), and robust neuropsychological evidence for left perisylvian involvement in speech and language processes (Damasio and Damasio, 2000; Woermann et al., 2003; Josse and Tzourio-Mazoyer, 2004; Turken and Dronkers, 2011). The VCI is comprised of three subtests (Vocabulary, Similarities, and Information) that assess expressive vocabulary, verbal abstract reasoning, and verbal conceptualization; the WMI is comprised of three subtests (Digit Span, Letter-Number Sequencing, and Arithmetic) that assess phonological attention and concentration.
MRI scanning and image processing.
Imaging was performed at the NYU Center for Brain Imaging on a 3 T Siemens Allegra head-only MR scanner. Image acquisitions included a conventional three-plane localizer and two T1-weighted gradient-echo sequence (MPRAGE) volumes (TE = 3.25 ms, TR = 2530 ms, TI = 1.100 ms, flip angle = 7°, FOV = 256 mm, voxel size = 1 × 1 × 1.33 mm). Acquisition parameters were optimized for increased gray/white matter image contrast. The imaging protocol was identical for all subjects studied. The image files in DICOM format were transferred to a Linux workstation for morphometric analysis. The two T1-weighted images were rigid body registered to each other and reoriented into a common space, roughly similar to alignment based on the AC–PC line. Images were automatically corrected for spatial distortion due to gradient nonlinearity (Jovicich et al., 2006) and B1 field inhomogeneity (Sled et al., 1998), registered, and averaged to improve signal-to-noise ratio. Images were further processed with the FreeSurfer (4.0.2) software package (http://surfer.nmr.mgh.harvard.edu) and customized Matlab software.
Surface reconstruction and gray–white matter contrast measurements.
The averaged volumetric MRI scan was used to construct models of each subject's cortical surface using an automated procedure that involves (1) segmentation of the white matter, (2) tessellation of the gray/white matter surfaces, (3) inflation of the folded surface tessellation, and (4) automatic correction of topological defects. These steps have been described in detail previously (Dale et al., 1999; Fischl et al., 1999, 2001). The white matter surface was refined to obtain submillimeter accuracy in delineating the gray/white matter junction. The surface was then deformed outward to locate the pial surface. Each automated reconstructions was manually checked for errors and corrected, if necessary, by an experienced technician blinded to the hypothesis of the study. Manual intervention was necessary only in <5% of the scans and in every case only minimal. FreeSurfer methodology has shown high validity and reliability for surface generation and reliable correlations with cognitive performance for other measures, such as cortical thickness (Fischl and Dale, 2000; Dickerson et al., 2008). GWC was estimated by calculating the non-normalized T1 image intensity contrast [(white − gray)/(white + gray)] at 0.5 mm above versus below the gray/white interface with trilinear interpolation of the images (Fig. 1). Values can range from 0 to 1, with values closer to 0 indicating less contrast and thus more blurring of the gray/white boundary. Sulcal depth measures were based on FreeSurfer routines that calculate the dot product of the movement vectors with the surface normal, yielding measures of the depth/height of each point above the average surface, and are used for dividing the cortical surface in gyral and sulcal areas. In addition, mean signed curvature was estimated at each vertex using standard FreeSurfer routines, giving a measure of the “sharpness” of cortical folding, differentiating between gyral and sulcal regions. Calculations of these measures were automatic and operator independent. Maps were smoothed with a Gaussian kernel (10 mm FWHM) across the surface and averaged across participants using a spherical averaging technique (Fischl et al., 1999), which accurately matches anatomically homologous regions across participants by aligning sulcal–gyral patterns while minimizing metric distortions. An automated cortical parcellation scheme was used for anatomical localization of results (see Fig. 3III; Fischl et al., 2004).
Figure 1.

Computing GWC. A, Sampling points on T1-weighted MPRAGE image with gray–white (GW) junction surface (pink line) and pial surface (turquoise). The green dot shows the sampling location of the gray matter intensity value at 0.5 mm into the gray matter relative to the GW junction (red dot). The blue dot shows the sampling location of the white matter intensity value at 0.5 mm into the white matter relative to the GW junction. Sampling is repeated at each vertex along the GW junction. B, Model of T1 intensity values plotted as a function of distance from the GW junction. The red circle represents the gray–white boundary. Negative values on the x-axis represent sampling in the white matter [higher (“brighter”) intensities], and positive values represent sampling in the gray matter [lower (“darker”) intensities]. The blue circle represents sampling at 0.5 mm in the white matter, and the green circle represents sampling from the same distance in the gray matter. C, Group maps. I, Average gray–white contrast (average GWC) across all subjects for both the left (LH) and right (RH) hemispheres. Top row shows lateral views, middle row medial views, and bottom row ventral views of the inflated group template surface. Smaller values (dark blue) indicate increased blurring, i.e., less sharp contrast between gray and white matter. II, SD maps showing the variability in GWC across individuals and cortical areas. Higher values (yellow) indicate higher variability.
Figure 3.
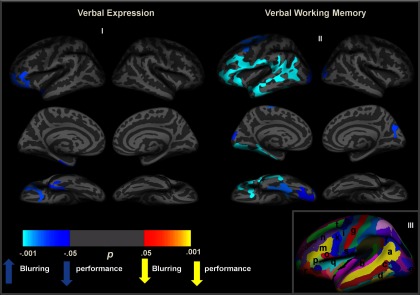
Group correlation cluster maps on the inflated average surface for GWC and performance on the WAIS-III Verbal Comprehension Index (Verbal Expression) (I) and Verbal Working Memory Index (II) across the whole cortical surface, corrected for multiple comparisons. Light blue values represent areas showing decreased performance associated with increase blurring. The absence of any yellow clusters shows that no region showed decreased blurring associated with decreased performance. III, Cortical parcellation scheme of the inflated average surface for anatomical orientation. a, Superior temporal gyrus; b, superior temporal gyrus; c, middle temporal gyrus; d, inferior temporal gyrus; e, occipital pole; f, angular gyrus; g, central sulcus; h, precentral sulcus (superior part); i, precentral gyrus; k, precentral sulcus (inferior part); m, inferior frontal sulcus; n, middle frontal gyrus; o, pars opercularis; p, pars triangularis; q, circular insula sulcus; r, pars orbitalis; s, subcentral gyrus; t, superior frontal sulcus (for a full list of regions, see Fischl et al., 2004).
For each hemisphere, a general linear model was used to estimate the effects of gray and white matter contrast on verbal index scores at each vertex along the cortical surface. We controlled the familywise error rate by means of Monte Carlo simulations as implemented in FreeSurfer 5.0 (Hayasaka and Nichols, 2003; Hagler et al., 2006). The data were tested against an empirical null distribution of maximum cluster size across 10,000 iterations synthesized with an initial cluster threshold of p < 0.05, yielding significant clusters corrected for multiple comparisons across all vertices. Corrected significance clusters of GWC correlations with verbal test scores were mapped onto the inflated surface of the average brain reconstruction for visual display. Given prior reports of a relationship between age and GWC (Salat et al., 2009; Westlye et al., 2010), average GWC values for each significant cluster were extracted and regressed on raw uncorrected VCI and WMI index scores (sum of subtest raw scores) to assess the independent contribution of regional blurring to index score variation after partialing out age and sex effects.
Results
Age, sex, and WAIS-III scores
VCI standard scores in our sample ranged from 88 to 142 (mean = 113.84, SD = 15.03) and WMI standard scores ranged from 78 to 150 (mean = 104.84, SD = 17.37). Pearson correlations revealed that VCI and WMI scores were highly correlated with each other (r = 0.736, p < 0.001). There was no association between age and VCI (r = −0.27, p = 0.142) or WMI (r = −0.207, p = 0.26) scores, which is not surprising considering that all standard scores are age corrected. Years of education were unrelated to VCI (r = 0.29, p = 0.112) or WMI (r = 0.046, p = 0.802) scores, which may represent a sample bias given the strong education effects in the larger WAIS-III standardization sample (Wechsler, 1997). One-way ANOVAs revealed that there were no differences between males and females on VCI scores (t(30) = 0.45, p = 0.65; females: mean = 112.63, SD = 13.9; males: mean = 115.06, SD = 16.44). However, there was a difference on WMI scores (t(30) = 2.07, p = 0.05; females: mean = 98.81, SD = 11.95; males: mean = 110.88, SD = 20.07), which is consistent with the small but significant sex effects observed in the larger standardization sample (Wechsler, 1997).
Group average gray and white matter contrast distribution
Group GWC means and SD for each vertex across the cortical surface are depicted in Figure 1C. There were no sex differences in average gray and white matter contrast in the left (t(30) = 0.128, p = 0.899) or right (t(30) = 0.396, p = 0.695) hemisphere. Figure 2 shows that local GWC is significantly correlated with sulcal depths (r = 0.59, p < 0.001) and curvature (r = 0.79, p < 0.001) and that GWC increases linearly from gyral to sulcal regions. Directly comparing GWC from sulcal regions with GWC from gyral regions, averaged across individuals, showed a significant difference, with lower values (increased blurring) in the gyrus compared to the sulcus (t(31) = 27.46; p < 0.001).
Figure 2.

A, Investigation of gray–white matter contrast differences at the sulcal fundus (S), sulcal wall (W), and gyral crown (G). B, Sulcal depth was measured across the whole cortex and displayed on the inflated cortical surface (red, sulcal areas; gray, sulcal wall; blue, gyral areas). C, GWC along the gyral-sulcal continuum for both the left (LH) and right (RH) hemispheres. Increasing GWC values represent sharper contrast. Zero on the x-axis denotes the middle point between sulcus and gyrus (sulcal wall). Positive numbers reflect areas toward the sulcus, and negative numbers reflect areas toward the gyrus. The green line represents a linear polynomial fit. In both hemispheres, a linear increase in GWC is observed from gyrus (G) to sulcus (S) (r = 0.59, p < 0.001). D, GWC as a function of signed curvature. Increasing GWC values represent sharper contrast. Positive curvature values are associated with degree of curvature in the sulcus and negative values with degree of curvature in the gyrus. Increased GWC is associated with increased curvature in the sulcus (r = 0.79, p < 0.001).
Gray and white matter contrast associated with aging
Gray and white matter contrast was negatively correlated with age across the frontal, parietal, and superior temporal lobes of both hemispheres (at a threshold of p = 0.01, corrected for multiple comparisons), showing decreased contrast with advancing age. Similar to prior findings (Salat et al., 2009), the strongest effects were present in prefrontal and anterior temporal regions bilaterally. There were no regions where GWC was positively correlated with age.
Gray and white matter contrast associated with VCI and WMI
Figure 3 depicts the whole-brain vertex-by-vertex correlations between gray and white matter contrast and VCI (I) and WMI (II) index scores on an inflated surface. Results are strongly left-lateralized, span gyral and sulcal regions, and are unidirectional in that increased blurring is consistently associated with decreased performance. Regions showing correlations with VCI include left inferior frontal cortex (pars triangularis and pars orbitalis) and temporal pole, indicating that more blurring of the gray and white matter junction is associated with lower VCI scores in these regions. There were no regions where blurring was associated with higher VCI scores, nor were there any significant clusters observed in the right hemisphere.
Lower WMI standard scores were associated with more blurring in the left hemisphere inferior frontal cortex (pars triangularis, pars opercularis, and pars orbitalis), middle frontal gyrus (i.e., dorsolateral prefrontal cortex, Brodmann areas 9 and 46), posterior superior frontal gyrus (i.e., frontal eye fields), subcentral gyrus, superior and inferior temporal gyri, and lateral occipital gyrus, as well as a small region in the right hemisphere cuneus and lateral occipital gyrus (see Fig. 3). There were no regions where blurring was associated with higher WMI scores.
To analyze the independent contribution of GWC to VCI performance after partialing out age effects, we performed hierarchical regression analyses for each significant left hemisphere cluster. Regional blurring in the left inferior frontal cluster accounted for an additional 13.8% of the variance in VCI scores (b = −0.47, t(29) = −2.17, p = 0.04), and regional blurring in the left anterior temporal cluster accounted for an additional 16.9% of the variance in VCI scores (b = −0.49, t(29) = −2.49, p = 0.02). Given evidence in our sample of sex differences in working memory scores, age and sex effects were partialed out before regressing inferior frontal and superior temporal cluster averages on WMI scores. Regional blurring in the left frontal cluster (comprised of pars opercularis, pars triangularis, and dorsolateral frontal regions) contributed an additional 14% of the variance in WMI scores (b = −0.49, t(28) = −2.5, p = 0.02), and regional blurring in the left superior temporal cluster (spanning the sulcus and gyrus) contributed an additional 11.7% of the variance in WMI scores (b = −0.42, t(28) = −2.25, p = 0.03). In sum, regional blurring contributed independently to variation in verbal test scores in all clusters after controlling for age and sex.
Discussion
The current results demonstrate a remarkably lateralized and focal relationship between regional contrast of the gray and white matter boundary and verbal abilities in healthy individuals. Stronger performance on a standardized index of verbal intellectual abilities (verbal expression, reasoning, and conceptualization) is associated with sharper gray–white contrast in left hemisphere language regions, specifically, pars triangularis and pars orbitalis (Broca's area), and temporal pole. The left inferior frontal cortex is well established as a critical hub for language processing (Sahin et al., 2009; Burns and Fahy, 2010; Turken and Dronkers, 2011), and the temporal pole is consistently implicated in object naming (Tranel, 2006) and semantic retrieval (Patterson et al., 2007; Tsapkini et al., 2011). Stronger performance on a standardized verbal working memory index is associated with sharper contrast in widespread left hemisphere frontal and temporal regions, consistent with robust evidence from functional neuroimaging (Vigneau et al., 2006) and lesion (Müller and Knight, 2006) studies that indicate a predominance of left lateralized prefrontal and temporal activity during rehearsal/manipulation of phonological material (Baddeley, 1992), as well as left-lateralized frontal eye field activity during verbal cognition (Kinsbourne, 1972; Gur et al., 1983).
Such results have important implications for future MRI morphometry investigations. First, they provide initial evidence that regional blurring of the gray and white matter boundary may be used as a metric to assess individual differences in cognitive abilities. Structural MRI measures such as local gray matter volume, cortical thinning, and white matter fractional anisotropy are increasingly being used to assess cognitive strengths and weaknesses in healthy individuals (Kanai and Rees, 2011), with the understanding that such differences constrain existing cognitive theories (Vogel and Awh, 2008) and provide corroborative evidence for neuroanatomical functional specialization (Blackmon et al., 2010). Given the correlative nature of such studies, it is critical that the structure–performance relationships identified are consistent with findings from functional MRI, electrophysiological, and lesion research. The strongly lateralized findings presented here are consistent with robust evidence for left language lateralization in right-handed individuals (Woermann et al., 2003; Josse and Tzourio-Mazoyer, 2004; Tyler and Marslen-Wilson, 2008; Turken and Dronkers, 2011), strengthening the potential of GWC as a marker of focal neuronal integrity. The strictly unidirectional relationship between GWC and cognitive test scores is worth noting. Unlike cortical thickness, which can have a bidirectional relationship to performance (Kanai and Rees, 2011), sharper contrast was invariably associated with stronger performance.
Second, such results suggest that age-related decline in GWC might explain a portion of the variance in age-related cognitive decline. In the current study, we were interested in the relationship between GWC and cognitive performance, independent of aging. Our results demonstrate that regional blurring contributes to the variance in performance, after controlling for age. However, an age-related decrease in GWC was strong and present across most of the frontal, temporal, and parietal lobes, consistent with prior findings (Salat et al., 2009, 2011). Future studies should investigate the relationship between regional blurring of the gray–white boundary and performance in extended age-range and clinical (e.g., neurodegenerative disease) samples. Prior evidence of more extensive blurring in medial temporal and limbic areas in AD (Salat et al., 2011) suggests that AD-related patterns of memory impairment, such as rapid forgetting (Hart et al., 1988; Kramer et al., 2004; Greenaway et al., 2006), might be partially explained by such regionally specific effects (Jack et al., 2008). Similar to hippocampal volume loss, abnormal blurring of mesial temporal structures may prove to be a sensitive biomarker of neurodegenerative disease progression (Caroli and Frisoni, 2010).
Third, such results highlight the role of GWC as a potential metric to assess the relationship between focal cortical abnormalities and domain-specific cognitive impairment. Given the sensitivity of localized gray–white matter blurring in the detection of developmental cortical malformations (Chan et al., 1998; Barkovich et al., 2001; Thesen et al., 2011), it may prove a useful metric to investigate cognitive deficits associated with neuro-migrational abnormalities. Although the participation of dysplastic cortex in functional networks is debated (Janszky et al., 2003; Kirschstein et al., 2003; Danckert et al., 2007; Duchowny, 2009), domain-specific deficits have been demonstrated in FCD, with lesions in the left hemisphere associated with verbal deficits in children (Klein et al., 2000) and in the left parietal region with left–right disorientation, finger agnosia, and dyscalculia (Oki et al., 1999). Furthermore, postmortem dissection has revealed low-grade dysplastic changes in the dominant hemisphere planum temporale of individuals with developmental dyslexia (Galaburda et al., 1985). Regardless of whether dysplastic regions are functionally networked, their presence impacts cognitive efficiency (Duchowny, 2009), the degree to which might be further investigated in vivo with GWC or a combination of GWC and cortical thickness metrics (Thesen et al., 2011).
The microstructural basis for blurring of the gray–white boundary has yet to be determined; however, it is likely that several processes contribute. Water content is the most important determinant of T1 signal in the brain (Paus et al., 2001). The more water present in a given tissue compartment, the longer the T1 and lower the signal on a T1-weighted image. In an adult brain, T1 is the shortest in white matter and the longest in gray matter, resulting in higher white matter signal intensity. Gray matter atrophy results in increased intensity values due to decreased water content and demyelinating processes result in decreased white matter intensities due to increased water content, both of which would result in poorer differentiation of the gray–white boundary (Magnaldi et al., 1993). These factors likely contributed to the strong age-related GWC effects we observed.
Iron content can influence absolute T1 intensity values, primarily impacting local magnetic inhomogeneities (Paus et al., 2001). However, GWC is a metric that is normalized to the local imaging environment. It is a ratio rather than an absolute measure of tissue intensity; therefore, it controls for field inhomogeneities or variation in absolute signal intensity across cortex. However, as a ratio, it cannot determine whether the performance-related contrast variation is more dependent on white or gray matter properties, or both.
Given that the relationship between regional left hemisphere blurring and verbal functions was present after controlling for aging, other factors outside of gray matter atrophy or demyelination should be considered, such as individual differences in the anatomic arrangement of axons at the gray–white junction and intracortical myelin density. Another factor is the presence of white matter neurons just below cortical layer VI, the density of which is unrelated to aging (Rojiani et al., 1996). Interstitial white matter neurons thinly populate the superficial white matter of healthy adult brains (Hardiman et al., 1988; Ramón y Cajal, 1995; Suárez-Solá et al., 2009; García-Marín et al., 2010). They are believed to be remnants of the embryonic subplate (Chun and Shatz, 1989) that have either failed to undergo programmed cell death (Luhmann et al., 2009) or are the result of disrupted migrational processes (Chevassus-au-Louis and Represa, 1999). Their density is increased at the gyral crown relative to the sulcus (Akbarian et al., 1993), which is consistent with our finding of increased blurring in the gyrus. Such correspondence suggests they may impact GWC values, although direct investigation with combined MRI and histological methods is needed.
Some caveats must be taken into account when interpreting the current findings. First, the sample size was relatively small for the age range we sampled. Although the laterality and regional specificity of the results is striking, replication in a large extended-age sample is recommended for further confirmation. Second, although the direction of the sex difference we observed on the WMI is consistent with findings from the large-scale U.S. WAIS-III standardization sample (Longman et al., 2007; Wechsler, 1997), the size of the discrepancy is larger and may represent a sample bias. Our results do not suggest that variations in GWC contribute to this difference. The relationship between GWC and WMI was independent of sex and there were no sex differences in left or right hemisphere average GWC. Finally, as data on regional GWC variations is only beginning to emerge, the extent to which training or expertise may impact contrast values remains unclear. Longitudinal studies involving skill learning are recommended to determine the degree to which changes in GWC may reflect structural plasticity in subjacent tissue.
In sum, the current study demonstrates a relationship between verbal abilities and blurring of the gray and white matter junction in left hemisphere frontal and temporal regions. Findings support the involvement of a left hemisphere network of temporal and frontal sites to support verbal expression and verbal working memory and suggest that the GWC metric can probe the substrate of the communication pathways that tie this network together. Future studies are recommended to confirm the regional specificity of our findings in large-scale samples and to establish whether GWC might be a mediating variable between neurological disease and cognitive deficits. Additionally, combined histological and MRI studies should attempt to delineate the degree to which cortical atrophy, demyelination, or interstitial white matter neuron density impacts contrast properties at the gray and white matter junction.
Footnotes
This study was supported in part by a grant from FACES (Finding a Cure for Epilepsy and Seizures) to T.T. and by National Institutes of Health (Grant numbers NS18741 and NS44623 to E.H.).
The authors declare no competing financial interests.
References
- Akbarian S, Bunney WE, Jr, Potkin SG, Wigal SB, Hagman JO, Sandman CA, Jones EG. Altered distribution of nicotinamide-adenine dinucleotide phosphate-diaphorase cells in frontal lobe of schizophrenics implies disturbances of cortical development. Arch Gen Psychiatry. 1993;50:169–177. doi: 10.1001/archpsyc.1993.01820150007001. [DOI] [PubMed] [Google Scholar]
- Andres M, Andre VM, Nguyen S, Salamon N, Cepeda C, Levine MS, Leite JP, Neder L, Vinters HV, Mathern GW. Human cortical dysplasia and epilepsy: an ontogenetic hypothesis based on volumetric MRI and NeuN neuronal density and size measurements. Cereb Cortex. 2005;15:194–210. doi: 10.1093/cercor/bhh122. [DOI] [PubMed] [Google Scholar]
- Baddeley A. Working memory. Science. 1992;255:556–559. doi: 10.1126/science.1736359. [DOI] [PubMed] [Google Scholar]
- Barkovich AJ, Kuzniecky RI, Dobyns WB. Radiologic classification of malformations of cortical development. Curr Opin Neurol. 2001;14:145–149. doi: 10.1097/00019052-200104000-00002. [DOI] [PubMed] [Google Scholar]
- Bernasconi A, Bernasconi N, Bernhardt BC, Schrader D. Advances in MRI for ‘cryptogenic’ epilepsies. Nat Rev Neurol. 2011;7:99–108. doi: 10.1038/nrneurol.2010.199. [DOI] [PubMed] [Google Scholar]
- Blackmon K, Barr WB, Kuzniecky R, Dubois J, Carlson C, Quinn BT, Blumberg M, Halgren E, Hagler DJ, Mikhly M, Devinsky O, McDonald CR, Dale AM, Thesen T. Phonetically irregular word pronunciation and cortical thickness in the adult brain. Neuroimage. 2010;51:1453–1458. doi: 10.1016/j.neuroimage.2010.03.028. [DOI] [PMC free article] [PubMed] [Google Scholar]
- Blümcke I, Thom M, Aronica E, Armstrong DD, Vinters HV, Palmini A, Jacques TS, Avanzini G, Barkovich AJ, Battaglia G, Becker A, Cepeda C, Cendes F, Colombo N, Crino P, Cross JH, Delalande O, Dubeau F, Duncan J, Guerrini R, et al. The clinicopathologic spectrum of focal cortical dysplasias: a consensus classification proposed by an ad hoc Task Force of the ILAE Diagnostic Methods Commission. Epilepsia. 2011;52:158–174. doi: 10.1111/j.1528-1167.2010.02777.x. [DOI] [PMC free article] [PubMed] [Google Scholar]
- Burns MS, Fahy J. Broca's area: rethinking classical concepts from a neuroscience perspective. Top Stroke Rehabil. 2010;17:401–410. doi: 10.1310/tsr1706-401. [DOI] [PubMed] [Google Scholar]
- Caroli A, Frisoni GB. The dynamics of Alzheimer's disease biomarkers in the Alzheimer's Disease Neuroimaging Initiative cohort. Neurobiol Aging. 2010;31:1263–1274. doi: 10.1016/j.neurobiolaging.2010.04.024. [DOI] [PMC free article] [PubMed] [Google Scholar]
- Chan S, Chin SS, Nordli DR, Goodman RR, DeLaPaz RL, Pedley TA. Prospective magnetic resonance imaging identification of focal cortical dysplasia, including the non-balloon cell subtype. Ann Neurol. 1998;44:749–757. doi: 10.1002/ana.410440508. [DOI] [PubMed] [Google Scholar]
- Chevassus-au-Louis N, Represa A. The right neuron at the wrong place: biology of heterotopic neurons in cortical neuronal migration disorders, with special reference to associated pathologies. Cell Mol Life Sci. 1999;55:1206–1215. doi: 10.1007/s000180050367. [DOI] [PMC free article] [PubMed] [Google Scholar]
- Chun JJ, Shatz CJ. Interstitial cells of the adult neocortical white matter are the remnant of the early generated subplate neuron population. J Comp Neurol. 1989;282:555–569. doi: 10.1002/cne.902820407. [DOI] [PubMed] [Google Scholar]
- Colombo N, Tassi L, Galli C, Citterio A, Lo Russo G, Scialfa G, Spreafico R. Focal cortical dysplasias: MR imaging, histopathologic, and clinical correlations in surgically treated patients with epilepsy. AJNR Am J Neuroradiol. 2003;24:724–733. [PMC free article] [PubMed] [Google Scholar]
- Dale AM, Fischl B, Sereno MI. Cortical surface-based analysis. I. Segmentation and surface reconstruction. Neuroimage. 1999;9:179–194. doi: 10.1006/nimg.1998.0395. [DOI] [PubMed] [Google Scholar]
- Damasio A, Damasio H. Aphasia and the neural basis for language. In: Mesulam M, editor. Principles of behavioral and cognitive neurology. Ed 2. New York: Oxford UP; 2000. pp. 294–315. [Google Scholar]
- Danckert J, Mirsattari SM, Bihari F, Danckert S, Allman AA, Janzen L. Functional MRI characteristics of a focal region of cortical malformation not associated with seizure onset. Epilepsy Behav. 2007;10:615–625. doi: 10.1016/j.yebeh.2007.03.006. [DOI] [PubMed] [Google Scholar]
- Dickerson BC, Fenstermacher E, Salat DH, Wolk DA, Maguire RP, Desikan R, Pacheco J, Quinn BT, Van der Kouwe A, Greve DN, Blacker D, Albert MS, Killiany RJ, Fischl B. Detection of cortical thickness correlates of cognitive performance: Reliability across MRI scan sessions, scanners, and field strengths. Neuroimage. 2008;39:10–18. doi: 10.1016/j.neuroimage.2007.08.042. [DOI] [PMC free article] [PubMed] [Google Scholar]
- Duchowny M. Clinical, functional, and neurophysiologic assessment of dysplastic cortical networks: implications for cortical functioning and surgical management. Epilepsia. 2009;50(Suppl 9):19–27. doi: 10.1111/j.1528-1167.2009.02291.x. [DOI] [PubMed] [Google Scholar]
- Fischl B, Dale AM. Measuring the thickness of the human cerebral cortex from magnetic resonance images. Proc Natl Acad Sci U S A. 2000;97:11050–11055. doi: 10.1073/pnas.200033797. [DOI] [PMC free article] [PubMed] [Google Scholar]
- Fischl B, Sereno MI, Dale AM. Cortical surface-based analysis. II: inflation, flattening, and a surface-based coordinate system. Neuroimage. 1999;9:195–207. doi: 10.1006/nimg.1998.0396. [DOI] [PubMed] [Google Scholar]
- Fischl B, Liu A, Dale AM. Automated manifold surgery: constructing geometrically accurate and topologically correct models of the human cerebral cortex. IEEE Trans Med Imaging. 2001;20:70–80. doi: 10.1109/42.906426. [DOI] [PubMed] [Google Scholar]
- Fischl B, van der Kouwe A, Destrieux C, Halgren E, Ségonne F, Salat DH, Busa E, Seidman LJ, Goldstein J, Kennedy D, Caviness V, Makris N, Rosen B, Dale AM. Automatically parcellating the human cerebral cortex. Cereb Cortex. 2004;14:11–22. doi: 10.1093/cercor/bhg087. [DOI] [PubMed] [Google Scholar]
- Galaburda AM, Sherman GF, Rosen GD, Aboitiz F, Geschwind N. Developmental dyslexia: four consecutive patients with cortical anomalies. Ann Neurol. 1985;18:222–233. doi: 10.1002/ana.410180210. [DOI] [PubMed] [Google Scholar]
- García-Marín V, Blazquez-Llorca L, Rodriguez JR, Gonzalez-Soriano J, DeFelipe J. Differential distribution of neurons in the gyral white matter of the human cerebral cortex. J Comp Neurol. 2010;518:4740–4759. doi: 10.1002/cne.22485. [DOI] [PubMed] [Google Scholar]
- Gläscher J, Tranel D, Paul LK, Rudrauf D, Rorden C, Hornaday A, Grabowski T, Damasio H, Adolphs R. Lesion mapping of cognitive abilities linked to intelligence. Neuron. 2009;61:681–691. doi: 10.1016/j.neuron.2009.01.026. [DOI] [PMC free article] [PubMed] [Google Scholar]
- Greenaway MC, Lacritz LH, Binegar D, Weiner MF, Lipton A, Munro Cullum C. Patterns of verbal memory performance in mild cognitive impairment, Alzheimer disease, and normal aging. Cogn Behav Neurol. 2006;19:79–84. doi: 10.1097/01.wnn.0000208290.57370.a3. [DOI] [PubMed] [Google Scholar]
- Gur RC, Gur RE, Rosen AD, Warach S, Alavi A, Greenberg J, Reivich M. A cognitive-motor network demonstrated by positron emission tomography. Neuropsychologia. 1983;21:601–606. doi: 10.1016/0028-3932(83)90057-x. [DOI] [PubMed] [Google Scholar]
- Hagler DJ, Jr, Saygin AP, Sereno MI. Smoothing and cluster thresholding for cortical surface-based group analysis of fMRI data. Neuroimage. 2006;33:1093–1103. doi: 10.1016/j.neuroimage.2006.07.036. [DOI] [PMC free article] [PubMed] [Google Scholar]
- Hardiman O, Burke T, Phillips J, Murphy S, O'Moore B, Staunton H, Farrell MA. Microdysgenesis in resected temporal neocortex: incidence and clinical significance in focal epilepsy. Neurology. 1988;38:1041–1047. doi: 10.1212/wnl.38.7.1041. [DOI] [PubMed] [Google Scholar]
- Hart RP, Kwentus JA, Harkins SW, Taylor JR. Rate of forgetting in mild Alzheimer's-type dementia. Brain Cogn. 1988;7:31–38. doi: 10.1016/0278-2626(88)90019-x. [DOI] [PubMed] [Google Scholar]
- Hayasaka S, Nichols TE. Validating cluster size inference: random field and permutation methods. Neuroimage. 2003;20:2343–2356. doi: 10.1016/j.neuroimage.2003.08.003. [DOI] [PubMed] [Google Scholar]
- Huppertz HJ, Grimm C, Fauser S, Kassubek J, Mader I, Hochmuth A, Spreer J, Schulze-Bonhage A. Enhanced visualization of blurred gray-white matter junctions in focal cortical dysplasia by voxel-based 3D MRI analysis. Epilepsy Res. 2005;67:35–50. doi: 10.1016/j.eplepsyres.2005.07.009. [DOI] [PubMed] [Google Scholar]
- Jack CR, Jr, Lowe VJ, Senjem ML, Weigand SD, Kemp BJ, Shiung MM, Knopman DS, Boeve BF, Klunk WE, Mathis CA, Petersen RC. 11C PiB and structural MRI provide complementary information in imaging of Alzheimer's disease and amnestic mild cognitive impairment. Brain. 2008;131:665–680. doi: 10.1093/brain/awm336. [DOI] [PMC free article] [PubMed] [Google Scholar]
- Janszky J, Ebner A, Kruse B, Mertens M, Jokeit H, Seitz RJ, Witte OW, Tuxhorn I, Woermann FG. Functional organization of the brain with malformations of cortical development. Ann Neurol. 2003;53:759–767. doi: 10.1002/ana.10545. [DOI] [PubMed] [Google Scholar]
- Josse G, Tzourio-Mazoyer N. Hemispheric specialization for language. Brain Res Brain Res Rev. 2004;44:1–12. doi: 10.1016/j.brainresrev.2003.10.001. [DOI] [PubMed] [Google Scholar]
- Jovicich J, Czanner S, Greve D, Haley E, van der Kouwe A, Gollub R, Kennedy D, Schmitt F, Brown G, MacFall J, Fischl B, Dale A. Reliability in multi-site structural MRI studies: effects of gradient non-linearity correction on phantom and human data. Neuroimage. 2006;30:436–443. doi: 10.1016/j.neuroimage.2005.09.046. [DOI] [PubMed] [Google Scholar]
- Kanai R, Rees G. The structural basis of inter-individual differences in human behaviour and cognition. Nat Rev Neurosci. 2011;12:231–242. doi: 10.1038/nrn3000. [DOI] [PubMed] [Google Scholar]
- Kinsbourne M. Eye and head turning indicates cerebral lateralization. Science. 1972;176:539–541. doi: 10.1126/science.176.4034.539. [DOI] [PubMed] [Google Scholar]
- Kirschstein T, Fernández G, Grunwald T, Pezer N, Urbach H, Blümcke I, Van Roost D, Lehnertz K, Elger CE. Heterotopias, cortical dysplasias and glioneural tumors participate in cognitive processing in patients with temporal lobe epilepsy. Neurosci Lett. 2003;338:237–241. doi: 10.1016/s0304-3940(02)01398-8. [DOI] [PubMed] [Google Scholar]
- Klein B, Levin BE, Duchowny MS, Llabre MM. Cognitive outcome of children with epilepsy and malformations of cortical development. Neurology. 2000;55:230–235. doi: 10.1212/wnl.55.2.230. [DOI] [PubMed] [Google Scholar]
- Kramer JH, Mungas D, Reed BR, Schuff N, Weiner MW, Miller BL, Chui HC. Forgetting in dementia with and without subcortical lacunes. Clin Neuropsychol. 2004;18:32–40. doi: 10.1080/13854040490507136. [DOI] [PMC free article] [PubMed] [Google Scholar]
- Longman RS, Saklofske DH, Fung TS. WAIS-III percentile scores by education and sex for U.S. and Canadian populations. Assessment. 2007;14:426–432. doi: 10.1177/1073191107304114. [DOI] [PubMed] [Google Scholar]
- Luhmann HJ, Kilb W, Hanganu-Opatz IL. Subplate cells: amplifiers of neuronal activity in the developing cerebral cortex. Front Neuroanat. 2009;3:19. doi: 10.3389/neuro.05.019.2009. [DOI] [PMC free article] [PubMed] [Google Scholar]
- Magnaldi S, Ukmar M, Vasciaveo A, Longo R, Pozzi-Mucelli R. Contrast between white and grey matter: MRI appearance with ageing. Eur Radiol. 1993;3:513–519. [Google Scholar]
- Müller NG, Knight RT. The functional neuroanatomy of working memory: contributions of human brain lesion studies. Neuroscience. 2006;139:51–58. doi: 10.1016/j.neuroscience.2005.09.018. [DOI] [PubMed] [Google Scholar]
- Oki J, Miyamoto A, Takahashi S, Takei H. Cognitive deterioration associated with focal cortical dysplasia. Pediatr Neurol. 1999;20:73–77. doi: 10.1016/s0887-8994(98)00102-7. [DOI] [PubMed] [Google Scholar]
- Oldfield RC. The assessment and analysis of handedness: the Edinburgh inventory. Neuropsychologia. 1971;9:97–113. doi: 10.1016/0028-3932(71)90067-4. [DOI] [PubMed] [Google Scholar]
- Patterson K, Nestor PJ, Rogers TT. Where do you know what you know? The representation of semantic knowledge in the human brain. Nat Rev Neurosci. 2007;8:976–987. doi: 10.1038/nrn2277. [DOI] [PubMed] [Google Scholar]
- Paus T, Collins DL, Evans AC, Leonard G, Pike B, Zijdenbos A. Maturation of white matter in the human brain: a review of magnetic resonance studies. Brain Res Bull. 2001;54:255–266. doi: 10.1016/s0361-9230(00)00434-2. [DOI] [PubMed] [Google Scholar]
- Ramón y Cajal S. Histology of the nervous system of man and vertebrates. Vols I, II. New York: Oxford UP; 1995. Translated (from the French) by Neely and Larry Swanson. [Google Scholar]
- Rojiani AM, Emery JA, Anderson KJ, Massey JK. Distribution of heterotopic neurons in normal hemispheric white matter: a morphometric analysis. J Neuropathol Exp Neurol. 1996;55:178–183. doi: 10.1097/00005072-199602000-00006. [DOI] [PubMed] [Google Scholar]
- Sahin NT, Pinker S, Cash SS, Schomer D, Halgren E. Sequential processing of lexical, grammatical, and phonological information within Broca's area. Science. 2009;326:445–449. doi: 10.1126/science.1174481. [DOI] [PMC free article] [PubMed] [Google Scholar]
- Salat DH, Lee SY, van der Kouwe AJ, Greve DN, Fischl B, Rosas HD. Age-associated alterations in cortical gray and white matter signal intensity and gray to white matter contrast. Neuroimage. 2009;48:21–28. doi: 10.1016/j.neuroimage.2009.06.074. [DOI] [PMC free article] [PubMed] [Google Scholar]
- Salat DH, Chen JJ, van der Kouwe AJ, Greve DN, Fischl B, Rosas HD. Hippocampal degeneration is associated with temporal and limbic gray matter/white matter tissue contrast in Alzheimer's disease. Neuroimage. 2011;54:1795–1802. doi: 10.1016/j.neuroimage.2010.10.034. [DOI] [PMC free article] [PubMed] [Google Scholar]
- Sisodiya SM, Fauser S, Cross JH, Thom M. Focal cortical dysplasia type II: biological features and clinical perspectives. Lancet Neurol. 2009;8:830–843. doi: 10.1016/S1474-4422(09)70201-7. [DOI] [PubMed] [Google Scholar]
- Sled JG, Zijdenbos AP, Evans AC. A nonparametric method for automatic correction of intensity nonuniformity in MRI data. IEEE Trans Med Imaging. 1998;17:87–97. doi: 10.1109/42.668698. [DOI] [PubMed] [Google Scholar]
- Suárez-Solá ML, González-Delgado FJ, Pueyo-Morlans M, Medina-Bolívar OC, Hernández-Acosta NC, González-Gómez M, Meyer G. Neurons in the white matter of the adult human neocortex. Front Neuroanat. 2009;3:7. doi: 10.3389/neuro.05.007.2009. [DOI] [PMC free article] [PubMed] [Google Scholar]
- Thesen T, Quinn BT, Carlson C, Devinsky O, DuBois J, McDonald CR, French J, Leventer R, Felsovalyi O, Wang X, Halgren E, Kuzniecky R. Detection of epileptogenic cortical malformations with surface-based MRI morphometry. PLoS ONE. 2011;6:e16430. doi: 10.1371/journal.pone.0016430. [DOI] [PMC free article] [PubMed] [Google Scholar]
- Tranel D. Impaired naming of unique landmarks is associated with left temporal polar damage. Neuropsychology. 2006;20:1–10. doi: 10.1037/0894-4105.20.1.1. [DOI] [PubMed] [Google Scholar]
- Tsapkini K, Frangakis CE, Hills AE. The function of the left anterior temporal pole: evidence from acute stroke and infarct volume. Brain. 2011 doi: 10.1093/brain/awr050. [DOI] [PMC free article] [PubMed] [Google Scholar]
- Turken AU, Dronkers NF. The neural architecture of the language comprehension network: converging evidence from lesion and connectivity analyses. Front Syst Neurosci. 2011;5:1. doi: 10.3389/fnsys.2011.00001. [DOI] [PMC free article] [PubMed] [Google Scholar]
- Tyler LK, Marslen-Wilson W. Fronto-temporal brain systems supporting spoken language comprehension. Philos Trans R Soc Lond B Biol Sci. 2008;363:1037–1054. doi: 10.1098/rstb.2007.2158. [DOI] [PMC free article] [PubMed] [Google Scholar]
- Vigneau M, Beaucousin V, Hervé PY, Duffau H, Crivello F, Houdé O, Mazoyer B, Tzourio-Mazoyer N. Meta-analyzing left hemisphere language areas: phonology, semantics, and sentence processing. Neuroimage. 2006;30:1414–1432. doi: 10.1016/j.neuroimage.2005.11.002. [DOI] [PubMed] [Google Scholar]
- Vogel EK, Awh E. How to exploit diversity for scientific gain. Curr Dir Psychol Sci. 2008;17:171–176. [Google Scholar]
- Wechsler D. Wechsler Adult Intelligence Scale—Third Edition Administration and Scoring Manual. San Antonio: The Psychological Corporation; 1997. [Google Scholar]
- Westlye LT, Walhovd KB, Dale AM, Bjørnerud A, Due-Tønnessen P, Engvig A, Grydeland H, Tamnes CK, Østby Y, Fjell AM. Differentiating maturational and aging-related changes of the cerebral cortex by use of thickness and signal intensity. Neuroimage. 2010;52:172–185. doi: 10.1016/j.neuroimage.2010.03.056. [DOI] [PubMed] [Google Scholar]
- Woermann FG, Jokeit H, Luerding R, Freitag H, Schulz R, Guertler S, Okujava M, Wolf P, Tuxhorn I, Ebner A. Language lateralization by Wada test and fMRI in 100 patients with epilepsy. Neurology. 2003;61:699–701. doi: 10.1212/01.wnl.0000078815.03224.57. [DOI] [PubMed] [Google Scholar]