

Abstract
We often have to make choices among multiattribute stimuli (e.g., a food that differs on its taste and health). Behavioral data suggest that choices are made by computing the value of the different attributes and then integrating them into an overall stimulus value signal. However, it is not known whether this theory describes the way the brain computes the stimulus value signals, or how the underlying computations might be implemented. We investigated these questions using a human fMRI task in which individuals had to evaluate T-shirts that varied in their visual esthetic (e.g., color) and semantic (e.g., meaning of logo printed in T-shirt) components. We found that activity in the fusiform gyrus, an area associated with the processing of visual features, correlated with the value of the visual esthetic attributes, but not with the value of the semantic attributes. In contrast, activity in posterior superior temporal gyrus, an area associated with the processing of semantic meaning, exhibited the opposite pattern. Furthermore, both areas exhibited functional connectivity with an area of ventromedial prefrontal cortex that reflects the computation of overall stimulus values at the time of decision. The results provide supporting evidence for the hypothesis that some attribute values are computed in cortical areas specialized in the processing of such features, and that those attribute-specific values are then passed to the vmPFC to be integrated into an overall stimulus value signal to guide the decision.
Introduction
A growing consensus in decision neuroscience suggests that the brain makes decisions by assigning values to the stimuli under consideration, which are then compared to make a choice (Montague and Berns, 2002; Wallis, 2007; Rangel et al., 2008; Kable and Glimcher, 2009; Rushworth et al., 2009; Rangel and Hare, 2010). It follows that to understand how the brain makes decisions, we need to begin by studying how it computes stimulus values at the time of choice. A sizable body of fMRI and neurophysiology evidence has shown that activity in ventromedial prefrontal cortex (vmPFC) correlates with stimulus values at the time of choice (Kable and Glimcher, 2007; Knutson et al., 2007; Tom et al., 2007; Hare et al., 2008, 2009, 2010; Boorman et al., 2009; Chib et al., 2009; FitzGerald et al., 2009; Basten et al., 2010; Philiastides et al., 2010; Plassmann et al., 2010; Wunderlich et al., 2010; Litt et al., 2011). Neurophysiology studies have found similar signals in the central orbital cortices (Wallis and Miller, 2003; Padoa-Schioppa and Assad, 2006, 2008; Padoa-Schioppa, 2009). However, little is known about how the stimulus value signals in this area are computed. For example, we do not know what are the input variables that the vmPFC uses to compute stimulus values, or where they are computed.
One intriguing possibility is suggested by research from economics and psychology on the valuation of complex stimuli that differ explicitly on multiple attributes that individuals care about (Lancaster, 1966; Bettman et al., 1998). Cars, which differ on their engine properties, esthetics, and comfort, among other characteristics, represent examples of such stimuli. Studies in these areas suggest that the values assigned to the overall stimulus (e.g., a car) are computed by assigning values to the individual attributes and then integrating them (Bettman et al., 1998). Although this model fits well with many patterns in the behavioral data, it is not known whether the brain actually computes overall stimulus value signals by first computing the individual attribute values, and then adding them up.
We present the results of a human fMRI study designed to investigate two basic open questions about how the brain computes values at the time of choice. First, do the stimulus value signals in vmPFC reflect the integration of individual attribute value signals? Second, are some of the attribute value signals computed outside the vmPFC, in regions specialized in the processing of those attributes? We hypothesized that the value of basic attributes, such as semantic or esthetic features, are computed in cortical areas specialized in the processing of such features, such as the posterior superior temporal gyrus (pSTG) for semantic features, and the fusiform gyrus (FG) for esthetic features. We also hypothesized that those attribute-specific values are then passed to the vmPFC to be integrated into an overall stimulus value signal to guide the decision.
Materials and Methods
Subjects.
Thirty-six right-handed subjects (18–40 years old; 22 males) participated in the experiment. Eleven additional subjects participated in a subset of the tasks but were excluded from further analyses. Seven of them were excluded because their performance in the behavioral training sessions did not meet predefined inclusion criteria. Four of them were excluded due to excessive head motion or software failures. Participants were in good health; had normal or corrected-to-normal vision; had no history of psychiatric diagnoses, neurological illnesses, or metabolic illnesses; and were not taking medications that interfere with the performance of fMRI. None of the participants had prior knowledge of the Korean language. All subjects provided informed consent before participation.
Stimuli.
Ninety two-syllable Korean words were used in the experiment. They spanned three emotional categories: 30 positive, 30 neutral, and 30 negative (Table 1). To induce variation in the visual (i.e., esthetic) preferences of subjects, the words were presented using different colors and font types. For each participant, we constructed three semirandom and nonoverlapping sets of words (A, B, and C), which were used in different phases of the experiment. Each set contained an equal distribution of emotional categories, colors, and font types. The first two sets were used in the main experiment. The last set was used in the functional localizer task (see details below). Stimuli were presented on an LCD monitor (1024 × 768 pixel resolution, 60 Hz refresh rate).
Table 1.
Korean word list and semantic and visual ratings, which were measured using a −1.5 to 1.5 scale
| Negative |
Neutral |
Positive |
||||||||||||||||
|---|---|---|---|---|---|---|---|---|---|---|---|---|---|---|---|---|---|---|
| Korean | English | Semantic |
Visual |
Korean | English | Semantic |
Visual |
Korean | English | Semantic |
Visual |
|||||||
| Mean | SD | Mean | SD | Mean | SD | Mean | SD | Mean | SD | Mean | SD | |||||||
| Set 1 | ||||||||||||||||||
 |
despair | −0.77 | 1.47 | 0.36 | 1.35 |  |
parallel | −0.05 | 1.17 | 0.26 | 1.19 |  |
passion | 0.86 | 1.12 | 0.34 | 0.96 | |
 |
failure | −0.68 | 1.68 | 0.11 | 1.35 |  |
serial | −0.43 | 1.12 | −0.04 | 1.45 |  |
joy | 0.82 | 1.08 | −0.24 | 1.40 | |
 |
disappointment | −0.70 | 1.46 | 0.36 | 1.10 |  |
substitution | −0.29 | 1.44 | 0.56 | 1.20 |  |
love | 0.85 | 1.28 | 0.29 | 1.01 | |
 |
shame | −0.95 | 1.19 | 0.09 | 1.59 |  |
signal | −0.02 | 1.32 | −0.07 | 1.30 |  |
respect | 0.74 | 1.23 | 0.08 | 1.33 | |
 |
irritation | −0.78 | 1.00 | −0.07 | 1.08 |  |
center | 0.08 | 1.21 | 0.00 | 1.12 |  |
wisdom | 0.95 | 0.87 | 0.15 | 1.01 | |
 |
suicide | −1.28 | 0.77 | −0.25 | 0.87 |  |
probability | 0.10 | 1.37 | −0.16 | 1.07 |  |
honest | 0.74 | 1.12 | −0.27 | 0.98 | |
 |
humiliation | −0.92 | 1.34 | −0.22 | 1.52 |  |
analysis | 0.11 | 1.39 | −0.09 | 1.08 |  |
victory | 0.86 | 0.86 | 0.08 | 0.96 | |
 |
scandal | −0.63 | 1.49 | −0.34 | 1.17 |  |
temperature | −0.32 | 1.09 | −0.68 | 1.28 |  |
trust | 0.79 | 1.05 | −0.23 | 1.27 | |
 |
disregard | −0.64 | 1.05 | −0.56 | 1.62 |  |
absorption | −0.18 | 1.33 | −0.58 | 1.44 |  |
truth | 0.96 | 1.08 | −0.38 | 1.63 | |
 |
malodor | −0.77 | 1.29 | 0.02 | 1.08 |  |
altitude | 0.18 | 1.03 | −0.12 | 1.18 |  |
glory | 0.76 | 1.01 | 0.05 | 1.20 | |
| Set 2 | ||||||||||||||||||
 |
disgust | −0.91 | 1.03 | −0.03 | 0.95 |  |
aperture | −0.17 | 1.25 | −0.18 | 0.89 |  |
peace | 0.73 | 1.14 | 0.13 | 1.17 | |
 |
dishonor | −0.94 | 1.11 | −0.27 | 1.36 |  |
area | −0.21 | 1.10 | −0.26 | 1.06 |  |
smile | 0.99 | 1.10 | −0.28 | 1.33 | |
 |
abuse | −1.23 | 0.54 | −0.37 | 1.15 |  |
array | −0.15 | 1.33 | −0.16 | 1.01 |  |
happiness | 0.91 | 0.91 | 0.36 | 1.33 | |
 |
betrayal | −0.87 | 1.40 | 0.14 | 1.33 |  |
calculation | −0.04 | 1.36 | 0.22 | 1.16 |  |
courage | 0.86 | 1.07 | 0.18 | 1.15 | |
 |
insult | −0.74 | 1.14 | 0.10 | 1.03 |  |
method | 0.02 | 1.06 | −0.01 | 1.32 |  |
harmony | 0.72 | 1.13 | 0.04 | 1.33 | |
 |
menace | −0.62 | 1.23 | 0.08 | 1.58 |  |
ratio | −0.16 | 1.21 | −0.20 | 1.30 |  |
success | 0.80 | 1.08 | −0.33 | 1.01 | |
 |
assault | −1.07 | 1.03 | −0.47 | 1.35 |  |
substance | −0.07 | 1.02 | 0.28 | 1.08 |  |
strength | 0.90 | 1.00 | −0.06 | 1.16 | |
 |
arrogance | −0.62 | 1.56 | 0.25 | 0.97 |  |
structure | −0.01 | 0.97 | −0.13 | 0.83 |  |
prosperity | 0.58 | 1.09 | −0.09 | 0.98 | |
 |
cruelty | −0.90 | 1.38 | 0.00 | 0.92 |  |
unit | −0.04 | 1.03 | −0.21 | 1.15 |  |
calmness | 0.68 | 0.87 | −0.24 | 1.13 | |
 |
rape | −1.24 | 1.00 | −0.14 | 1.19 |  |
coefficient | −0.12 | 1.49 | −0.39 | 1.02 |  |
sweet | 0.60 | 1.27 | 0.28 | 0.97 | |
| Set 3 | ||||||||||||||||||
 |
wicked | −0.14 | 1.55 | −0.35 | 1.03 |  |
frequency | −0.18 | 1.28 | 0.15 | 1.28 |  |
charm | 0.68 | 1.06 | 0.13 | 1.11 | |
 |
molestation | −1.19 | 0.99 | 0.32 | 1.07 |  |
density | −0.23 | 1.20 | −0.03 | 1.14 |  |
lively | 0.66 | 1.09 | 0.34 | 1.45 | |
 |
murder | −1.02 | 1.47 | 0.35 | 1.10 |  |
rotation | −0.07 | 1.50 | 0.45 | 1.21 |  |
faithful | 0.65 | 1.21 | 0.20 | 1.03 | |
 |
kidnapping | −0.97 | 1.39 | 0.32 | 1.18 |  |
alloy | −0.05 | 1.35 | 0.33 | 1.10 |  |
friendship | 0.74 | 1.15 | 0.17 | 1.17 | |
 |
prostitution | −1.07 | 1.25 | 0.25 | 1.08 |  |
equation | −0.08 | 1.43 | 0.32 | 1.04 |  |
freedom | 0.85 | 1.00 | 0.34 | 0.81 | |
 |
adultery | −1.09 | 1.01 | 0.13 | 1.12 |  |
boundary | −0.07 | 0.99 | 0.19 | 1.10 |  |
hope | 0.80 | 1.14 | 0.05 | 1.41 | |
 |
greed | −0.68 | 1.42 | 0.39 | 1.04 |  |
surface | −0.08 | 1.24 | 0.05 | 1.25 |  |
delight | 0.74 | 0.83 | −0.01 | 1.33 | |
 |
fraud | −0.80 | 1.25 | −0.16 | 1.20 |  |
transformation | 0.30 | 1.27 | −0.07 | 1.19 |  |
devotion | 0.63 | 1.20 | 0.03 | 1.12 | |
 |
obscenity | −0.66 | 1.66 | −0.02 | 1.26 |  |
experiment | 0.28 | 1.45 | 0.27 | 1.17 |  |
spirit | 0.79 | 1.03 | −0.34 | 0.77 | |
 |
lewd | −0.78 | 1.30 | −0.11 | 1.10 |  |
detail | 0.00 | 1.08 | −0.23 | 1.38 |  |
sincerity | 0.61 | 1.12 | −0.24 | 1.51 | |
| Total | −0.86 | 0.24 | 0.00 | 0.27 | −0.06 | 0.16 | −0.02 | 0.28 | 0.78 | 0.11 | 0.02 | 0.23 | ||||||
Task.
The experiment took place during 4 separate days, all within the span of a week. During the first 3 d, subjects completed behavioral tasks outside the scanner. In the last day they participated in the main fMRI task.
Day 1: liking ratings.
Using an analog scale, subjects provided liking ratings for the three word sets (Fig. 1A). They were asked to provide these ratings based on how much they liked its visual features. Note that at the time of the ratings, the subjects did not know the meaning of the Korean words. Subjects also rated the semantic meaning of 90 English words, which were given by the translation of the Korean words (Fig. 1A). They were asked to provide these ratings based on how much they liked the meaning and concepts associated with each word. The English words were always shown in the same color, size, and font. The order of the two rating tasks was counterbalanced across subjects. To reduce noise of measurement, subjects completed two separate semantic and visual rating runs. For every subject, the final rating for stimulus was given by the average of these two ratings. In every trial, a stimulus was shown for 2 s, and afterward subjects entered their rating at their own pace by selecting a position in a horizontal bar with a mouse. To minimize spatial biases, the initial position of the cursor was randomized in each trial, and the direction of the scale (dislike–like vs like–dislike) was counterbalanced across participants. To induce stronger preferences over the stimuli, subjects were informed during the initial instruction period that they would receive a gray T-shirt with the exact image shown in a randomly selected trial printed on it.
Figure 1.
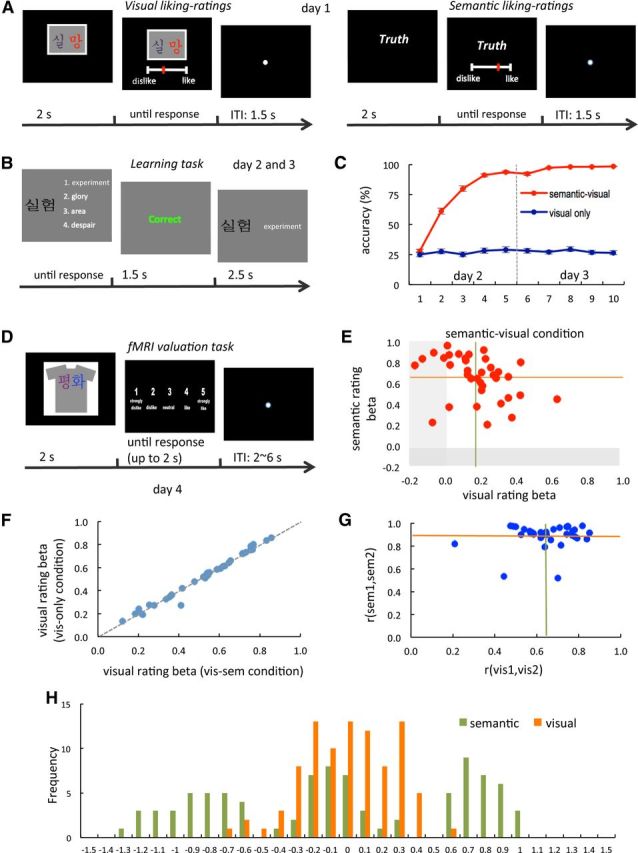
Task design and behavioral evidence. A, Trial structure of the visual and semantic liking-rating tasks. B, Trial structure of the Korean learning task. C, Performance over time in the Korean learning task. Error bar indicates SEMs. D, Trial structure of the fMRI valuation task. E, Estimated individual coefficients for a linear regression of stimulus values on visual and semantic ratings. Each individual is represented by a point. Semantic–visual trials only. Green and orange lines present mean β coefficients. Visual and semantic ratings were normalized to a −1.5 to 1.5 scale. F, Estimated individual coefficients for the visual attribute in a similar linear regression, estimated separately by condition. The dotted line represents a 45° line. G, Scatter plot summarizing the results of the test–retest correlations of semantic and visual ratings. H, Histogram of semantic and visual ratings.
Days 2–3: Korean learning.
Subjects participated in 10 runs of the following learning task, five on each day. The purpose of the task was to teach them to recognize with high accuracy the meaning of all of the Korean words in stimulus set A. Stimulus set B was used as a control: subjects were exposed to these words an equal number of times, but for the reasons described below, could not learn the meaning of these words. Each run of the task had 60 trials, one for each Korean word in stimulus sets A and B, presented in random order. In each trial, a Korean word was shown in black font for 2 s on the left side of a gray screen, and four English words appeared in white on the right side (Fig. 1B). Participants were asked to choose the option that corresponded to the translation of the Korean word. Trials from each stimulus set were treated differently. For stimulus set A, one of the options was always the correct answer, and the other three were translations of randomly chosen words in the full Korean word set. For this set, feedback (correct/incorrect) was provided for 1.5 s immediately after response, followed by a subsequent 2.5 s display of the concurrent Korean–English word pair. In contrast, no feedback was provided for stimulus set B, and a question mark was paired with the target Korean (instead of the corresponding English translation, as in the previous case). Participants were informed that they would have to reach at least 80% accuracy criteria in two of the runs to be able to move to the fMRI task. All participants reached the criterion for stimulus set A but, as expected, performance for stimulus set B remained at chance level (Fig. 1C).
Day 3: postlearning liking ratings.
Immediately after the Korean learning task, subjects were asked to provide liking ratings for each of the 60 Korean words. Task structure and instruction were similar to visual liking rating trials of day 1.
To ensure that subjects had stable preferences over the liking and semantic dimensions, we imposed the following prespecified criterion as a requirement for advancing to the fMRI stage of the experiment. First, the test–retest reliability of the initial ratings was calculated separately for visual and semantic liking ratings for each individual. One subject who showed nonsignificant test–retest reliability between two initial visual rating runs (rt1,t2 = 0.13, p > 0.05) was excluded for further analyses. Second, the linear relationships between the initial liking ratings (visual and semantic) and the postlearning ratings were examined separately for the experimental and control sets. In particular, for every subject and rating type, we estimated a linear regression of the rating from the initial session on the rating from the postlearning session. Six subjects who showed nonsignificant estimated coefficients (p > 0.05) were excluded due to the inconsistency (unreliability) of their ratings.
Day 4: fMRI tasks.
On the final day of the study, subjects completed the following two tasks inside the scanner, always in the listed order.
First, they performed a valuation task that is the core task of the experiment. As shown in Figure 1D, in every trial they were shown for 2 s images of a T-shirt with a printout of one of the stimuli from sets A and B (6° × 6° of visual angle), and afterward had up to 2 s to enter a liking rating indicated by pressing a button. In this task, subjects were asked to rate how much they would like to get each particular T-shirt at the end of the experiment (scale: strongly dislike, dislike, neutral, like, strongly like). To exclude motor-related responses of no interest, the response button mapping was counterbalanced (left to right; right to left) across participants. The stimulus order was fully randomized. A white fixation cross (randomly jittered: uniform 2 ∼ 6 s) was presented between trials. Importantly, the ratings in this task provide a measure of the overall stimulus values (i.e., they reflect both their visual and semantic properties). Subjects performed two runs of the task, and each stimulus was presented once in each run. For every subject, the overall stimulus value signal for each T-shirt was computed by averaging the ratings provided in both runs.
Second, subjects performed a simple one-back working memory task, which served as a functional localizer. The task was administrated in a blocked fashion using T-shirts with unknown Korean words, English words, or pictures of scenes. The Korean set was set C and the English set was given by its translation. For scenes, house and building images were used. A total of six Korean, six English, and six scene blocks were presented in random order. Each block began with a 2.75 s display describing the block type (Korean, English, or scene), followed by 12 1.5 s stimulus presentations separated by 500 ms white fixation crosses. Each block involved two stimulus repetitions at random times. Subjects were asked to indicate the occurrence of the repetitions with a button press. The scene block served as a control in the fMRI analyses used to localize regions of interest (ROIs). It allowed us to identify the areas of the pSTG involved in semantic processing (through the contrast “English vs scene” minus “Korean vs scene”) and the areas of the FG involved in visual processing of Korean words (through the contrast “Korean vs scene” minus “English vs scene”).
A few days after the experiment, a T-shirt showing the Korean word stimulus shown in a random experimental trial was sent by mail to the subjects.
The logic behind the task design is described in detail in the Results section.
MRI data acquisition.
Anatomical and functional scans were acquired using a Siemens 3 T Trio scanner (Siemens Medical Systems) with an eight-channel phased-array head coil. Structural images were acquired first with a high-resolution MPRAGE anatomical sequence [TR, 1500 ms; TE, 3.05 ms; TI, 800 ms; 1 mm isotropic voxel; 256 mm field of view (FOV)]. Next, blood oxygenation level-dependent (BOLD) contrast functional images were acquired with gradient-echo echo-planar T2*-weighted imaging. To optimize functional sensitivity of signals in the orbitofrontal cortex, T2* images were acquired in an oblique orientation of 30° to the anterior commissure–posterior commissure line (Deichmann et al., 2003). Each functional volume consisted of 44 axial slices (TR, 2750 ms; TE, 30 ms; flip angle, 80°; FOV, 192 mm; 64 × 64 matrix; 3 mm isotropic voxel).
fMRI preprocessing.
Analysis of fMRI data was performed using the Analysis of Functional NeuroImages package (Cox, 1996) as well as custom-made software. The first four functional volumes of each run were removed to account for equilibration effects in the scanner's magnetic field. The following sequence of processing steps was applied to each subject's data: slice-time correction, motion correction, spatial resampling (3 × 3 × 3 mm) and normalization to the standard Talairach template, Gaussian spatial smoothing (FWHM, 6 mm), and intensity normalization (each voxel's mean was set to 100).
General linear model analyses.
We estimated several separate general linear models (GLMs) of the BOLD responses during the main valuation task. All models assumed a first-degree autoregressive [AR(1)] model, and included motion parameters, constants, and linear time trends for each run as regressors of no interest. All regressors of interest were convolved with a canonical hemodynamic response function (HRF).
We estimated the models in three steps. First, we estimated the model and performed the contrast of interest at the individual level. Second, we implemented a mixed-effects analysis by comparing the relevant individual regression coefficients using t tests or repeated-measures ANOVAs. Finally, for inference purposes, we performed multiple-comparison corrections at the cluster level using Monte Carlo simulations with the AlphaSim program (http://afni.nimh.nih.gov). Statistical inferences at the whole-brain level were performed at a corrected threshold of p < 0.05, by imposing a p < 0.005 statistical threshold and a minimum cluster extent of 41 voxels (3 × 3 × 3 mm). For the predetermined regions of interest, including vmPFC and the areas identified by the functional localizers described below, we performed small-volume corrections at the cluster level (extent threshold of 11 voxels for vmPFC, 10 voxels for FG, and 14 voxels for pSTG). Activation coordinates are reported using Talairach coordinates.
GLM-1.
The goal of this GLM was to identify areas that correlated with stimulus values in each condition (Fig. 2A). This model included the following regressors of interest:
An indicator function for stimulus presentation during semantic–visual trials
An indicator function for stimulus presentation during semantic–visual trials multiplied by the stimulus value for the item shown in that trial
An indicator function for stimulus presentation during visual-only trials
An indicator function for stimulus presentation during visual-only trials multiplied by the stimulus value for the item shown in that trial.
Figure 2.

Properties of the stimulus value computations in vmPFC. A, vmPFC activity correlates with stimulus value in semantic–visual and visual-only trials. B, A common area of vmPFC correlates with stimulus values in both conditions. C, Beta plot comparing the size of the vmPFC responses to stimulus values in both conditions. D, Beta plot comparing the size of the vmPFC responses to visual and semantic values in both conditions. Whole-brain analyses were thresholded at p < 0.05 (corrected). Coordinates are in Talairach space.
GLM-2.
The goal of this GLM was to identify regions that correlated with semantic and visual attribute values in each condition. This model included the following regressors of interest:
An indicator function for stimulus presentation during semantic–visual trials
An indicator function for stimulus presentation during semantic–visual trials multiplied by the visual rating for the item shown in that trial
An indicator function for stimulus presentation during semantic–visual trials multiplied by the semantic rating for the item shown in that trial
An indicator function for stimulus presentation during semantic–visual trials multiplied by the interaction term of two ratings (visual * semantic ratings) for the item shown in that trial
An indicator function for stimulus presentation during visual-only trials
An indicator function for stimulus presentation during visual-only trials multiplied by the visual rating for the item shown in that trial
An indicator function for stimulus presentation during visual-only trials multiplied by the semantic rating for the item shown in that trial
An indicator function for stimulus presentation during visual-only trials multiplied by the interaction term of two ratings (visual * semantic ratings) for the item shown in that trial.
GLM-3.
This model was used in the semantic part of the ROI analysis for Figure 3D,F. The model contained the following regressors of interest:
An indicator function for the presentation of a stimulus with a negative semantic attribute during semantic–visual trials
An indicator function for the presentation of a stimulus with a neutral semantic attribute during semantic–visual trials
An indicator function for the presentation of a stimulus with a positive semantic attribute during semantic–visual trials
An indicator function for the presentation of a stimulus with a negative semantic attribute during visual-only trials
An indicator function for the presentation of a stimulus with a neutral semantic attribute during visual-only trials
An indicator function for the presentation of a stimulus with a positive semantic attribute during visual-only trials
Figure 3.

Properties of the visual and semantic attribute value computations. A, Activity in left pSTG correlated with semantic ratings in the semantic–visual condition. A right-side small figure shows English (vs scene)–Korean (vs scene) contrast from localizer trials. B, Activity in FG correlated with semantic ratings in the semantic–visual condition. A right-side small figure shows Korean (vs scene)–English (vs scene) contrast from localizer trials. The conjunction of the whole-brain and the localizer contrasts is depicted in green. C, Beta plots comparing the responsivity of left pSTG to semantic and visual ratings during the semantic–visual condition. D, Beta plots comparing the responsivity of left pSTG to the valences of the semantic and visual ratings during the semantic–visual condition. E, Beta plots comparing the responsivity of right FG to semantic and visual ratings during the semantic–visual condition. F, Beta plots comparing the responsivity of right FG to the valences of the semantic and visual ratings during the semantic–visual condition. Whole-brain analyses were thresholded at p < 0.05 (corrected). Right FG was plotted in the ROI plots. For D and F, semantic and visual ratings were divided into three levels. pSTG/MTG, posterior superior/middle temporal gyrus. Coordinates are in Talairach space.
GLM-4.
This model was used in the visual part of the ROI analysis for Figure 3D,F. The model is analogous to GLM-3, except that trials were broken by the valence of the visual attributes.
Functional localizers.
We used the data from the functional localizer to characterize the location of the FG and the left pSTG at the group level. We identified the location of the FG that was responsive to the Korean words by looking for voxels that responded more strongly to the Korean (vs scene: baseline) than the English (vs scene: baseline) block at p < 0.05 (corrected) within an anatomically defined mask of the FG (Fig. 3B, right). This functional contrast was motivated by the previous findings: (1) the FG responds to the visual form of words (Fiez and Petersen, 1998; McCandliss et al., 2003), and (2) the subset of FG responds to the foreign Korean words after language training (Xue et al., 2006; Xue and Poldrack, 2007). We identified the location of the left pSTG by looking for voxels that responded more strongly to the English block (vs scene) than to the Korean block (vs scene) (for which the meaning was unknown) within an anatomically defined mask of the left superior and middle temporal gyrus (Fig. 3A, right). We used this functional contrast to identify the left pSTG region (also known as Wernicke's area), in which semantic language processing occurs (Price, 2000; Van Petten and Luka, 2006).
Psycho-physiological interaction analysis.
We estimated several psycho-physiological interaction (PPI) models to test the hypotheses about the correlation between the activity in areas involved in the valuation of semantic and visual attributes and the activity in vmPFC.
The goal of the first PPI was to identify brain areas in which BOLD activity shows more functional connectivity with vmPFC during the semantic–visual trials.
The analysis was done in three steps. First, we extracted a spatially averaged time-series of BOLD activity in the vmPFC ROI that was given by areas of vmPFC that correlated with stimulus values in both the semantic–visual and visual-only conditions (conjunction analysis, p < 0.05 corrected; Fig. 2B). Nuisance variance associated with drifts of the BOLD signal (constant and linear terms for each run) were removed from the extracted time-series, which was then deconvolved using a model of a canonical HRF (Gitelman et al., 2003).
Second, for every individual, we estimated a GLM with the following regressors:
In interaction (PPI) between the deconvolved vmPFC signal and an indicator function of visual–semantic trials (1 during stimulus presentation and 0 otherwise)
An indicator function of visual–semantic trials
An interaction (PPI) between the deconvolved vmPFC signals and an indicator function of visual-only trails
An indicator function of visual-only trials
-
The extracted time-series in the vmPFC
This GLM also included the following regressors of no interest:
An indicator function for stimulus presentation during semantic–visual trials multiplied by the visual ratings
An indicator function for stimulus presentation during semantic–visual trials multiplied by the semantic ratings
An indicator function for stimulus presentation during semantic–visual trials multiplied by the interaction term of two ratings (visual * semantic ratings)
An indicator function for stimulus presentation during visual-only trials multiplied by the visual rating.
All regressors except the fifth one were convolved with a canonical HRF.
Third, we performed second-level analyses by carrying out one-sample t tests on the first-level contrasts for the first and third regressors (PPI term).
We expected that the vmPFC region would show significant functional connectivity with the areas in which specific value attributes are computed at the time of decision. These hypotheses were systematically tested by examining functional connectivity with the pSTG ROI for semantic value attribute computation and the FG ROI for the esthetic value attribute computation. For completeness, we also report the whole-brain PPI result.
ROI analyses.
To avoid biases due to a nonindependent selection of the ROIs, all of the ROI analyses employ a leave-one-subject-out (LOSO) approach (Esterman et al., 2010). In particular, to define the ROI used to compute the statistics for subject i, we estimated the GLM of interest using only the data from all other subjects except i. We then computed the average response for subject i, often called an average β value, in a 4 mm radius sphere centered at the peak of the group-level contrast for the group that excludes subject i. This was repeated for every subject. The extracted β values, one for each subject, were then compared through paired or one-sample t tests.
Results
We addressed the two main questions of the paper using the multidate and multitask experimental design described above. The use of this complex design was necessary to address a nontrivial difficulty: the nature of the attribute space that the brain uses in computing stimulus values is not known, which makes it hard to isolate the relevant attribute levels and to measure their values accurately.
It is useful to begin by describing the “big logic” of the task. We constructed an artificial stimulus set in which we were able to isolate and measure stimulus and attribute values. The stimuli were customized gray T-shirts with a Korean word printed prominently on them (Fig. 1D). Subjects cared about the T-shirts because at the end of the experiment they got the one shown in a randomly selected trial. The words differed in their semantic (or meaning) attributes and on their visual (or esthetic) attributes. The semantic attributes ranged from very negative words like “rape” to very positive ones like “hope” (Table 1). The visual attributes were varied by changing colors and font types. The word stimuli were constructed by randomly combining both attributes. A series of tasks allowed us to obtain independent behavioral measures of the values each subject assigned to each attribute, as well as the integrated stimulus value they assigned to each T-shirt (i.e., based on both its visual and semantic attributes).
This design allowed us to test the following three hypotheses. First, we hypothesized that a common area of vmPFC would correlate with stimulus values, independently of which subset of attributes was available to the subject to compute them at the time of choice. This hypothesis was based on the fact that vmPFC BOLD responses at the time of choice have been shown to reliably correlate with stimulus values using a wide class of objects (Kable and Glimcher, 2007; Knutson et al., 2007; Tom et al., 2007; Hare et al., 2008, 2009, 2010; Boorman et al., 2009; Chib et al., 2009; FitzGerald et al., 2009; Basten et al., 2010; Philiastides et al., 2010; Plassmann et al., 2010; Wunderlich et al., 2010; Litt et al., 2011) for which very different types of attributes are likely to be important for computing stimulus values (e.g., food vs monetary gambles vs charitable donations).
Second, we hypothesized that the stimulus value signals in vmPFC would reflect the value of both visual and semantic values. In addition to the body of evidence demonstrating the role of vmPFC in valuation during decision-making, the hypothesis was based on the fact that there is strong behavioral support for the computation and integration of attribute values in decision making (Lancaster, 1966; Simonson and Tversky, 1992; Tversky and Simonson, 1993; Frisch and Clemen, 1994; Bettman et al., 1998).
Third, we hypothesized that semantic and visual attribute values would be at least partially computed outside vmPFC, in areas known to be specialized in the processing of those attributes. In particular, we expected that the FG, which have been reliably shown to be involved in the processing of visual features (Fiez and Petersen, 1998; Joseph, 2001; McCandliss et al., 2003; Bolger et al., 2005), would also be involved in assigning value to the visual attributes. Similarly, we expected that the pSTG, which have been shown to be involved in semantic and conceptual processing (Price, 2000; Martin and Chao, 2001; Thompson-Schill, 2003; Van Petten and Luka, 2006; Binder et al., 2009), would also be involved in assigning value to the semantic attributes.
Fourth, we hypothesized that the areas involved in the computation of attribute-specific values would exhibit increased functional connectivity with vmPFC at the time of choice, as one would expect if the attribute value signals are passed to vmPFC to be integrated into an overall stimulus value. The strong anatomical connections of the vmPFC with sensory and temporal cortex are consistent with and provide motivation for this last hypothesis (Carmichael and Price, 1996; Cavada et al., 2000; Ongür and Price, 2000; Saleem et al., 2000).
The experiment took place over four separate dates and required subjects to complete various tasks. On day 1, subjects unfamiliar with the Korean language participated in a visual and a semantic liking-rating task (Fig. 1A). In the visual rating task they were shown the Korean words that would be eventually printed in the T-shirts (which varied in font and color) and were asked to provide a rating of how much they liked or disliked each particular design. Since the subjects did not know Korean at this time, this gave us a measure of their value for the visual attributes uncontaminated by the semantic attributes (group level correlation: mean r = 0.01, SD = 0.18, not significant, 2-sided t test against 0). In the semantic liking-rating task, they were shown the English translation of the same words, always in the same color and font, and were asked to rate how much they liked or disliked the meaning of each of them. This provided us with a measure of their values for the semantic attributes uncontaminated by the visual attributes. Importantly for some of the tests below (Fig. 1H, Table 1), the manipulation induced a distribution of semantic and visual attribute values that spanned both the positive and negative ranges, which suggests that the stimulus sets included a mixture of appetitive and aversive attributes in both dimensions.
On days 2–3, subjects participated in a Korean learning task. The main purpose of this task was to teach the subjects Korean so that they could process both the semantic and visual attributes during the main fMRI valuation task. As shown in Figure 1B, subjects learned the words by repeatedly solving a multiple-choice guessing game and receiving feedback (correct/incorrect). Importantly, we only taught them the meanings of half of the words (while keeping exposure to the stimuli constant). This allowed us to have two conditions in the main valuation task: a semantic–visual condition in which subjects could process both the semantic and visual attributes of the T-shirts, and a visual-only condition in which they could process the visual attributes, but not the semantic ones. We created both conditions to carry out a robustness check of our hypotheses: the activity related to the valuation of semantic attributes, as well as its interaction with the value signals in vmPFC, should be present in the visual–semantic condition, when semantic attributes are available, but not in the visual-only condition, when they are not available. Note that this provides a robustness check by showing that the attribute-based valuation mechanisms hypothesized here are activated only for those attributes that the brain can process at the time of choice. Figure 1C shows that the learning task (day 2 and 3) was successful in teaching subjects the meaning of words in the semantic–visual set, but that knowledge of the meaning remained at chance in the visual-only condition.
Finally, on day 4, subjects participated in the main valuation task while we scanned their brains with fMRI (Fig. 1D). In each trial they were shown one of the T-shirts (randomly selected from either condition) and had to enter a rating indicating how much they would like to own it at the end of the experiment. These ratings provide a measure of the overall stimulus value (reflecting both semantic and visual attributes) for each subject and T-shirt.
To be able to carry out independent tests of some of our hypotheses regarding the role of FG and pSTG on attribute value coding, we also performed a functional localizer task. Subjects participated in a one-back working memory task in which they were shown blocks of T-shirts with unknown Korean words, blocks of T-shirts with unknown English words, or blocks of T-shirts with scenes of houses or buildings.
Behavioral evidence for attribute-based value integration
For each individual, we estimated a linear regression of stimulus values (given by the stimulus value rating they provided on the main fMRI valuation task) on the visual and semantic attribute values (given by the ratings that they provided in the initial behavioral task), as well as their interaction. For items in the visual-only condition, the value of the semantic attribute values was set to zero. Figure 1E depicts the individual estimated coefficients for each attribute. The mean coefficient was positive and significant for both attributes (visual ratings: mean, 0.17; SD, 0.17; p < 0.001; semantic ratings: mean, 0.66; SD, 0.21; p < 0.001; 1-sided t tests against 0). The interaction effect was not significant (mean, 0.06; SD, 0.17; not significant). This result is consistent the hypothesis that the stimulus values assigned to each T-shirt reflect the integration of the value of its attributes.
We also tested for the reliability of these behavioral measures of attribute integration by estimating a separate linear regression of stimulus values on both types of attributes, as well as their interaction, separately for visual–semantic and visual-only trials. This was done one individual at a time. If the visual attributes are reliably incorporated into the stimulus value signals, and there are no interaction effects, one would expect that the estimated coefficients for the visual attribute would be very similar across conditions. As shown in Figure 1F, this is indeed what we found.
vmPFC activity correlates with stimulus values
Our first hypothesis states that a common area of vmPFC would correlate with stimulus values independently of which subset of attributes was available to the subject to compute them at the time of choice. We tested this hypothesis by estimating a GLM of the BOLD responses during the valuation task to identify areas in which neural responses at the time of stimulus presentation, when the T-shirts are being valued, correlated with the overall stimulus values of each T-shirt. The model looked for separate responses in semantic visual and visual-only conditions. We found that activity in vmPFC was positively correlated with stimulus values in both conditions (Fig. 2A; p < 0.05 corrected; x = 0, y = 35, z = 2 for semantic–visual condition; x = −7, y = 23, z = −10 for visual-only condition; all coordinates are in Talairach space). A conjunction analysis showed that a common area of vmPFC correlated with stimulus values in both conditions (Fig. 2B; p < 0.05 corrected; x = −6, y = 29, z = −5). In the semantic–visual condition activity in the left pSTG (x = −46, y = −55, z = 10), FG (left: x = −31, y = −58, z = −10; right: x = 33, y = −41, z = −21), and middle frontal gyrus (MFG; x = −29, y = 43, z = 29) also correlated with stimulus values. In the visual-only condition activity in a similar area of MFG (x = −22, y = 17, z = 38) also correlated with stimulus values. See Table 2 for a complete list of activations.
Table 2.
Regions correlated with overall stimulus values (fMRI liking-ratings)
| Region | Side | Talairach |
t | ||
|---|---|---|---|---|---|
| x | y | z | |||
| VOVERALL: semantic–visual condition | |||||
| Medial orbitofrontal cortex/anterior cingulate cortex | L/R | 0 | 35 | 2 | 6.06 |
| Caudate | L | −7 | 8 | 5 | 4.39 |
| R | 5 | 5 | 5 | 3.95 | |
| Inferior frontal gyrus | R | 38 | 26 | 14 | 4.27 |
| Middle frontal gyrus, anterior | L | −29 | 43 | 29 | 4.40 |
| Middle frontal gyrus, posterior | L | −23 | 5 | 47 | 6.15 |
| R | 14 | 20 | 41 | 5.26 | |
| Middle/posterior cingulate cortex | L/R | 5 | −28 | 29 | 4.63 |
| Superior temporal gyrus, posterior | L | −46 | −55 | 10 | 4.15 |
| Middle temporal gyrus, posterior | R | 41 | −58 | 8 | 4.17 |
| Superior parietal lobule | L | −7 | −61 | 47 | 3.95 |
| Inferior parietal lobule | L | −37 | −43 | 35 | 4.64 |
| R | 44 | −46 | 38 | 5.00 | |
| Fusiform gyrus | L | −31 | −58 | −10 | 3.81a |
| R | 33 | −41 | −21 | 4.03 | |
| Superior occipital gyrus | L | −31 | −76 | 29 | 3.91 |
| VOVERALL: visual-only condition | |||||
| Medial orbitofrontal cortex | L | −7 | 23 | −10 | 4.48a |
| Inferior frontal gyrus | L | −34 | 38 | 8 | 4.00 |
| Middle frontal gyrus | L | −22 | 17 | 38 | 4.38 |
| Precuneus | L | −4 | −61 | 32 | 3.70 |
| Inferior parietal lobule | L | −28 | −65 | 38 | 5.26 |
| VOVERALL: semantic–visual > visual only | |||||
| Insular, posterior | R | 44 | −19 | 11 | 4.39 |
L, Left; R, right.
ap < 0.05 with small-volume correction (extent threshold k = 10 voxels for FG; extent threshold k = 11 voxels for vmPFC). p < 0.05 with whole-brain cluster size correction (height threshold T = 2.72, p < 0.005; extent threshold k = 41 voxels).
We also performed an independent ROI analysis of the vmPFC signal to compare the strength of the stimulus value signal in both conditions. The test was performed by averaging the estimated β values for the stimulus value regressors in each condition within the ROI from the conjunction map computed separately for each subject by using the LOSO method described in the Materials and Methods. We found no differences on the strength of the stimulus values signals between the two conditions (Fig. 2C; t = 0.01, not significant, paired t test).
Figure 2A shows that at a common threshold of p < 0.05 corrected, the extent of the areas that significantly correlate with stimulus values is much larger in the semantic–visual than in the visual-only condition. There is a natural explanation for this. Figure 1G shows that the visual ratings seem to be measured with more noise than the semantic ratings. As is well known in statistics, measurement error on the independent variables biases the estimated regression coefficients toward zero. In our experiment, the stimulus values in the visual-only condition are based only on the noisy visual attribute values. As a result, our ability to detect areas that correlated with stimulus values is reduced in the visual-only condition.
Together, the results for this section show that an area of vmPFC similar to the one that has been found in previous decision-making studies, contained a stimulus value signal of similar magnitude at the time of decision, independently of the number of attributes available to the subjects.
vmPFC stimulus value signals reflect attribute values
Our second hypothesis states that the stimulus value signals in vmPFC would reflect the value of both visual and semantic values. We tested this hypothesis by performing several additional independent ROI analyses in the vmPFC ROI described above. In particular, we estimated a second GLM in which responses at the time of evaluation were modulated by both visual and semantic attribute values, separately for each condition. As before, for each subject we averaged the estimated β values within the ROI, and then performed tests across subjects. As shown in Figure 2D, we found that vmPFC responses were significantly correlated with both visual and semantic attribute values during the semantic–visual condition, but only with visual attributes during the visual-only condition. In addition, there were no significant differences on the responsivity of the vmPFC signal to the visual attribute values between the two conditions (t = 0.65; 2-tailed; not significant).
Together, these findings provide evidence consistent with the hypothesis that the area of vmPFC widely shown to correlate with stimulus values at the time of decision contains information about the individual attribute value components. Furthermore, a comparison between the semantic–visual and visual-only conditions shows that the semantic attribute information is only reflected in vmPFC when that information is available to the brain. This is what one would expect if the vmPFC stimulus value signals are computed, at least in part, by integrating attribute value information.
pSTG activity correlates with semantic attribute value signals
The next hypothesis states that semantic and visual attribute values would be at least partially computed outside vmPFC, in areas known to be specialized in the processing of those attributes. In particular, we hypothesized that the pSTG would be involved and specialized in computing semantic attribute values, whereas the FG would be involved and specialized in the computation of visual attribute values.
We tested the pSTG component of the hypothesis by carrying out a whole-brain analysis to look for areas that correlated with the value of the semantic attributes at the time of evaluation. Given that semantic information is available only during the semantic–visual condition, we only looked for the semantic attribute signals during that condition. As expected, we found that activity in an area of left pSTG (Fig. 3A; x = −47, y = −55, z = 11) correlated with the semantic attribute values (Table 3). This area of left pSTG was a strict subset of the area identified by the independent semantic processing functional localizer (Fig. 3A).
Table 3.
Regions correlated with visual and semantic ratings
| Region | Side | Talairach |
t | ||
|---|---|---|---|---|---|
| x | y | z | |||
| VVISUAL: semantic–visual condition | |||||
| Medial orbitofrontal cortex/anterior cingulate cortex | L/R | −4 | 26 | 5 | 5.08 |
| Inferior frontal gyrus, anterior | R | 56 | 8 | 11 | 4.16 |
| Precentral gyrus | R | 44 | −22 | 53 | 4.39 |
| Postcentral gyrus | R | 56 | −19 | 17 | 4.83 |
| Fusiform gyrus | L | −33 | −41 | −21 | 3.15a |
| R | 21 | −35 | −18 | 3.30a | |
| VSEMATIC: semantic–visual condition | |||||
| Medial orbitofrontal cortex/anterior cingulate cortex | L/R | −9 | 30 | −1 | 5.10 |
| Superior temporal gyrus, posterior | L | −47 | −55 | 11 | 4.90a |
| Superior parietal lobule | L | −31 | −40 | 56 | 3.82 |
| Precuneus | L | −19 | −70 | 20 | 4.02 |
| VVISUAL: visual-only condition | |||||
| Inferior frontal gyrus, anterior | L | −28 | 32 | 5 | 4.20 |
| Middle frontal gyrus | L | −25 | 2 | 32 | 4.15 |
| R | 35 | 17 | 35 | 4.23 | |
ap < 0.05 with small volume correction (extent threshold k = 10 voxels for FG; extent threshold k = 14 voxels for pSTG). p < 0.05 with whole-brain cluster size correction (height threshold T = 2.72, p < 0.005; extent threshold k = 41 voxels).
We performed several additional ROI-based tests of our hypotheses. All of them were performed on the subset of the left pSTG region identified by the functional localizer for semantic processing in which activity at the time of evaluation correlated with stimulus values at the time of evaluation (at p < 0.05 corrected). Importantly, to guarantee the independence of the analyses, the ROIs were identified the LOSO procedure described in the Materials and Methods section.
First, we compared the extent to which the responses in left pSTG reflected the visual and semantic attribute values. We found that activity in the left pSTG (x = −46, y = −55, z = 10) was significantly responsive to the semantic attribute values (t = 3.57, 1-tailed, p < 0.001), but not to the visual attribute values (t = 0.90, 1-tailed, not significant; Fig. 3C). However, the direct contrast between two attribute values was not significant (t = −0.89, 1-tailed, not significant), which might reflect a lack of power due to the excess noise in measuring the visual attribute values.
Second, we compared the average response in left pSTG as a function of the valence of either the semantic or the visual attributes of the stimulus shown on each trial. This required the estimation of additional GLMs, which are described in detail in the Materials and Methods section. As shown in Figure 3D, activity in left pSTG was increasing on the valence of the semantic attributes (F = 10.31, p < 0.005; linear contrast), as one would expect if it reflected the semantic attribute values, but was not increasing on the valence of the visual attribute values (F = 0.18, not significant; linear contrast).
An important concern with this result is that the activity in pSTG might reflect some form of attentional modulation as opposed to a genuine semantic attribute value signal. The analyses reported in Figure 3D allow us to address this concern. If the results reflected an attentional value signal, then one would expect the activity to be highest for liked and disliked stimuli, and lowest for the neutral stimuli. But this is not the case. Instead, we find that the responses in the pSTG are increasing in the valence of the semantic attributes, as is expected of an area that reflect this type of attribute value signal. One potential concern with this argument is that our stimuli might not have fully spanned the negative and positive valence. The selection of semantic stimuli, which span words from “rape” to “hope,” and the subject's rating data suggest that this was not an issue (Fig. 1H, Table 1).
Together, the results in this section are consistent with the hypothesis that responses in the left pSTG at the time of evaluation reflect the computation of semantic attribute value signals, but they do not reflect the computation of visual attribute values.
FG activity correlates with visual attribute value signals
We next performed a related series of tests of the hypothesis that FG is involved and specialized in computing visual attribute values.
We began by carrying out a whole-brain analysis to look for areas that correlated with the value of the visual attributes at the time of evaluation. In this case, we looked for visual attribute signals in both conditions. As expected, we found that activity in bilateral FG (left: x = −33, y = −41, z = −21; right: x = 21, y = −35, z = −18) correlated with the visual attribute values during the semantic–visual condition. This area of FG was a strict subset of the area identified by the independent visual processing functional localizer (Fig. 3B). Unexpectedly, we did not find similar activity in FG during the visual-only condition at our omnibus threshold, although the predicted activity was there at much lower thresholds. See Table 3 for a complete list of activations.
A potential post hoc reason for why we did not find a significant visual value signal in FG in the visual-only condition is that subjects might have paid less attention in that condition, which would decrease the strength of the signals. This is consistent with what we saw in vmPFC in Figure 2A. The differential attention could be due to the fact that subjects have significantly weaker preferences for the visual than for the semantic attributes (Fig. 1H).
Using the same methods as before, we performed two additional post hoc, independent ROI tests of our hypotheses regarding FG. Because we did not find a robust visual attribute value signal in visual-only trials, we performed the tests only for the semantic–visual condition. First, we compared the strength of the response in FG to the visual and semantic ratings during the semantic–visual trials. We found that activity in the right FG (x = 33, y = −41, z = −21) was significantly responsive to the visual attribute values (t = 2.39, 1-tailed, p < 0.05; Fig. 3E), but not to semantic attribute values (t = 0.47, 1-tailed). As hypothesized, a subsequent direct comparison between two attribute values was significant (t = 1.92, 1-tailed, p < 0.05). The left FG result was not significant. Second, we found that responses in the right FG area were increasing on the valence of the visual (Fig. 3F; F = 4.22, p < 0.05; linear contrast), but not of the semantic attribute values (F = 0.04, not significant; linear contrast).
Together, the results in this section provide supporting evidence to the hypothesis that activity in areas like FG, that specialize in the processing of the visual features of the stimuli, reflect the attribute values of this type of information. The results also support the hypothesis that the computation of attribute values is specialized to visual information, since the semantic attribute values are not reflected in this area.
Functional connectivity analyses
Finally, we performed two different functional connectivity analyses to test the hypothesis that the areas of pSTG and FG associated with the computation of attribute value signals pass that information to vmPFC so that it can be integrated into overall stimulus value signals. The basic idea of the test is as follows. First, since the semantic information is available in semantic–visual trials, but not in visual-only trials, there should be positive functional connectivity at the time of evaluation between the left pSTG area involved in computing semantic attribute values and the vmPFC area involved in computing stimulus values during the semantic–visual trials, but not during the visual-only trials. Second, there should be positive functional connectivity at the time of evaluation between the FG involved in computing visual attributes and the vmPFC area in both conditions.
We performed both tests by estimating a PPI model that looks for areas that exhibit an increased correlation with the vmPFC ROI (Fig. 4;Table 4, whole-brain results) in each of the two conditions separately. The PPI analyses included parametric modulators for the visual and semantic value signals at the time of decision as regressors of no interest. Thus, any increase in connectivity between vmPFC and FG or pSTG at the time of decision cannot be attributed to the fact that both sets of areas correlate with the attribute values.
Figure 4.

PPI analyses. A, The left pSTG exhibited stronger correlation with vmPFC in the semantic–visual condition than in the visual-only condition. B, The right FG exhibited significant correlations with vmPFC in both conditions.
Table 4.
PPI analysis
| Region | Side | Talairach |
t | ||
|---|---|---|---|---|---|
| x | y | z | |||
| Semantic–visual trials | |||||
| Middle/superior temporal gyrus, posterior | L | −34 | −52 | 11 | 3.71a |
| Middle frontal gyrus, anterior | L | −46 | 5 | 35 | 5.61 |
| R | 47 | −1 | 29 | 5.62 | |
| Insula, anterior | L | −37 | 11 | 11 | 5.33 |
| R | 29 | 14 | 14 | 5.55 | |
| Medial frontal cortex/middle cingulate cortex | L/R | −6 | −8 | 51 | 4.95 |
| Fusiform gyrus | L | −19 | −34 | −19 | 4.68 |
| R | 38 | −43 | −19 | 4.55 | |
| Putamen | L | −19 | 2 | 8 | 4.31 |
| Thalamus | R | 14 | −13 | 14 | 4.58 |
| Inferior parietal gyrus | L | −41 | −59 | 41 | 5.45 |
| R | 47 | −37 | 38 | 6.23 | |
| Precuneus | L | −30 | −64 | 45 | 4.87 |
| R | 20 | −70 | 44 | 6.11 | |
| Visual only | |||||
| Fusiform gyrus | R | 40 | −46 | −9 | 2.54a |
| Medial frontal cortex/middle cingulate cortex | L/R | 11 | 20 | 35 | 3.13 |
| Precuneus | L | −31 | −70 | 38 | 3.51 |
| Semantic–visual > visual only | |||||
| Middle/superior temporal gyrus, posterior | L | −52 | −22 | 5 | 4.32 |
| R | 59 | −25 | 5 | 4.53 | |
| Middle frontal gyrus, anterior | L | −31 | −11 | 46 | 3.79 |
| Insula, anterior | L | −40 | 11 | 14 | 6.02 |
| R | 32 | 5 | 5 | 5.46 | |
| Medial frontal cortex/middle cingulate cortex | L/R | −7 | −7 | 47 | 3.99 |
| Parahippocampal gyrus | L | −28 | −1 | −19 | 4.95 |
| Thalamus | R | 11 | −10 | 8 | 4.11 |
| Inferior parietal gyrus | L | −43 | −40 | 38 | 4.03 |
| R | 47 | −40 | 38 | 4.67 | |
| Precuneus | L/R | 5 | −61 | 59 | 4.74 |
ap < 0.05 with small volume correction (extent threshold k = 10 voxels for FG; extent threshold k = 14 voxels for pSTG). p < 0.05 with whole-brain cluster size correction (height threshold T = 2.72, p < 0.005; extent threshold k = 41 voxels).
Consistent with our hypothesis, the vmPFC showed a positive functional connectivity with the left pSTG ROI during semantic–visual condition (t = 2.15, 1-tailed, p < 0.05), but not during visual-only condition (t = −0.63, 1-tailed, not significant). The functional connectivity between vmPFC and pSTG was stronger during semantic–visual condition compared with visual-only condition (t = 2.39, 1-tailed, p < 0.05). We also found a similar PPI pattern between vmPFC and the right FG ROI. The vmPFC showed a positive functional connectivity with the right FG ROI during both semantic–visual condition (t = 3.56, 1-tailed, p < 0.005) and visual-only condition (t = 1.82, 1-tailed, p < 0.05). As expected, the functional connectivity between vmPFC and FG was not significantly different between two conditions (t = 1.02, 1-tailed, not significant).
These connectivity analyses provide additional support for the hypothesis that the pSTG participates in the computation of values for semantic attributes and that this information is passed to vmPFC for computing an overall stimulus value whenever the attribute information is available, and that an analogous relationship holds for FG and the computation of the visual attribute values.
Discussion
The experiments described here were designed to test the hypothesis that stimulus value signals in vmPFC reflect the integration of attribute-specific value signals computed in cortical regions specialized in processing the properties of those attributes. We used a paradigm in which subjects had to evaluate the overall attractiveness of T-shirts that differed in their visual esthetic and in their semantic attributes. Importantly, the paradigm allowed us to look for neural correlates of the overall stimulus values, the value of the visual attributes, and the value of the semantic attributes. Our findings are consistent with this hypothesis. First, we found that activity in the vmPFC correlated with the overall stimulus values assigned to the T-shirts, as well as with the semantic and visual attribute values. Second, we found that activity in the FG, an area that has been previously shown to be involved in the processing of visual features (Fiez and Petersen, 1998; McCandliss et al., 2003), correlated with the values of the visual esthetic attributes, but not with the values of the semantic attributes. Third, we found that activity in the pSTG, an area previously shown to be involved in semantic and conceptual processing (Price, 2000; Van Petten and Luka, 2006), correlated with the value of the semantic attributes, but not with the value of the visual esthetic attributes. Fourth, the FG and pSTG exhibited functional connectivity with the area of vmPFC associated with the computation of stimulus values, which should be the case if the attribute value signals are passed to the vmPFC to be integrated into an overall stimulus value.
Testing these hypotheses is important for several reasons. First, preference models based on the integration of attribute values are cornerstones of behavioral research. Thus, it is important to know whether the vmPFC valuation system guides choices using computations consistent with these models. Second, this model of stimulus value computation has desirable computational properties. In particular, a valuation system that uses this code does not need to learn the value of each specific stimulus through direct experience. Instead, as long it can learn the value of each level of the attributes, it is able to generalize and assign adequate stimulus values to any object with those attributes. Third, if correct, our hypothesis implies that the values assigned to stimuli at the time of decision, and thus the decisions that are made, depend on subject's abilities to process and evaluate particular attributes. This is important because it would imply that behavioral deficits could be in part traced back to perceptual deficits. As an extreme example, some individuals might behave selfishly not because they do not care about others, but because impairments in their social processing might preclude them from fully characterizing the impact of their decisions on others.
One novel aspect of the study is worth highlighting. Several papers have shown that the value computations in vmPFC reflect the integration of various types of information (Basten et al., 2010; Philiastides et al., 2010; Park et al., 2011). For example, in Philiastides et al. (2010), subjects made choices over stimulus associated with probabilistic rewards, and were able to estimate the associated probabilities by integrating information about the likelihood of the rewards that were given before the choices. Meanwhile, in Park et al. (2011), subjects needed to decide whether to accept pain (in the form of electric shocks) in exchange for monetary compensation. All of these studies found that the vmPFC responses at the time of decision reflected the estimated and/or integrated value of the stimulus. This was also the case in our study, in which subjects were asked to evaluate T-shirts that differ on the semantic and esthetic properties of the logo printed on them, and vmPFC responses at the time of decision reflect the overall stimulus value assigned to the T-shirts. However, none of the previous studies addressed the central question of our study: whether attribute values are being computed in specialized regions beyond vmPFC, and whether these signals are passed to vmPFC to compute an overall stimulus values.
The closest study is Basten et al. (2010), in which subjects needed to evaluate complex stimuli associated with both gains and losses. They found that, at the time of decision, activity in the amygdala correlated with the potential losses, activity in ventral striatum correlated with the potential gains, and activity in vmPFC correlated with the net value of the stimulus. Their results are consistent with the hypothesis that gains and losses are different attributes encoded, respectively, in amygdala and ventral striatum, and that this information is then integrated in vmPFC. However, it is not obvious if gains and losses are different attributes, as opposed to different levels of the same “feature” (a view widely favored in behavioral economics). To sidestep this problem, here we have constructed a choice setting with two clearly distinct attributes: the semantic and visual properties of the T-shirt logos.
The finding that activity in vmPFC correlated with the overall stimulus values assigned to the T-shirts is consistent with a sizable and rapidly growing body of human fMRI work (Kable and Glimcher, 2007; Knutson et al., 2007; Tom et al., 2007; Hare et al., 2008, 2009, 2010; Boorman et al., 2009; Chib et al., 2009; FitzGerald et al., 2009; Basten et al., 2010; Philiastides et al., 2010; Plassmann et al., 2010; Wunderlich et al., 2010; Litt et al., 2011). Previous studies have shown that the responses of the vmPFC at the time of decision are similar for multiple classes of items matched for value (Chib et al., 2009). In contrast, here we show that the value of different stimulus attributes is represented in a common area of vmPFC. This provides a potential mechanism through which the vmPFC might be able to assign values in a common scale for very different items: the values of at least some attributes could be computed in other regions of cortex specialized in the processing of this aspect of stimuli, and those values could then be passed to cortex to be integrated into an overall value signal.
We emphasize two limitations of this part of the results. First, our tests do not rule out the possibility that the value of some attributes is computed within the vmPFC itself, before integration into a final stimulus value signal. In fact, evidence consistent with this view comes from various neurophysiological studies that have found that parts of the orbitofrontal cortex encode information about the basic perceptual properties of food stimuli and the satiety state (Rolls, 2005; Rolls and Grabenhorst, 2008). Second, we cannot also distinguish between two important alternative interpretations of the overall stimulus value signals reflected in the vmPFC BOLD responses. One possibility is that the BOLD responses might reflect single unit activity encoding overall stimulus value signals. Another possibility is that the BOLD responses might reflect the population responses of spatially intermingled neurons, each of which computes the value of single attributes only.
We found that activity in the FG at the time of decision was correlated with the visual values assigned to the T-shirts, but not with the semantic values. Several previous studies have reported activity in FG consistent with this finding. For example, the FG was correlated with the attractiveness of paintings (Vartanian and Goel, 2004) and faces (Kranz and Ishai, 2006; Winston et al., 2007; Chatterjee et al., 2009), and the place-related area in the parahippocampal gyrus correlated with the ratings given to scenes (Yue et al., 2007). However, none of these previous studies showed that this area correlated with the value of visual esthetic attributes, but not with the value of other attributes. Significantly, they did not rule out the possibility that activity in this area might have correlated with overall stimulus values, as opposed to only the specific values of the attributes associated with that region.
We also found that activity in the left pSTG at the time of decision was correlated with the semantic values assigned to the T-shirts, but not with the visual values. A recent study by our group found that activity of the right pSTG positively correlated with subjects' willingness to give during charitable donation decisions (Hare et al., 2010). Note that the benefit of a charitable donation is abstract and relatively sensory-irrelevant, compared with other primary or secondary rewards. Here we found that the semantic attribute value of the T-shirts was encoded on the left pSTG (closely overlapped with Wernicke's area), an area that has been tightly linked with semantic processing of language. In both cases the pSTG may be processing abstract or conceptual stimulus attributes, but there might be systematic lateralization difference with the right being more involved in social considerations, and the left specialized in the computation of values that involved semantic processing.
It is important to emphasize that our experimental design allowed us to rule out the possibility that the attribute value signals in FG and pSTG reflect simple forms of attention-related activity, as opposed to valuation (Schall, 2005; Litt et al., 2011). To see why, note that attention activity increases with the absolute value of the stimulus: attention is higher for strongly appetitive and aversive items, and lower for more mildly rated stimuli. In contrast, value signals increase linearly with values: they are lowest for highly negative and strongest for highly appetitive stimuli. As shown in Figure 3, the response in FG increased linearly with the visual esthetic ratings, which is consistent with encoding the value of the visual attribute, and it did not have the V shape that would be expected if this area reflected increased attention to visual semantic attributes. An analogous argument applies for the responses in pSTG.
The results also rule out the possibility that the attribute value, like responses in FG and pSTG, reflect simple feedback from vmPFC to these sensory areas. If that were the case, you would expect activity in FG and pSTG to respond to the overall value of the stimulus, which is what is encoded in vmPFC, and not to the attribute values specific to each area. We emphasize, however, that our data cannot rule out the possibility of more sophisticated forms of feedback. In particular, the data are consistent with a model in which the BOLD in vmPFC responses reflect the population responses of spatially intermingled neurons, each of which computes the value of single attributes only, and each of which feeds back only to the area encoding the sensory information related to the attribute value being encoded.
Finally, we emphasize that although our study provides evidence in favor of the hypothesis that the overall stimulus value signals in vmPFC reflect the integration of attribute-specific value signals, it leaves open the important issue of systematically characterizing which attributes are evaluated within vmPFC, and which are attributes used by the brain to carry out stimulus value computations. Although here we find evidence in support of the use of visual and semantic attributes, it is likely that the attribute code used by the brain is much more basic than the one identified here.
Footnotes
This work was supported by the National Science Foundation (Grants SES-0851408, SES-0926544, and SES-0850840), National Institutes of Health (Grant R01 AA018736), the Betty and Gordon Moore Foundation, and the Lipper Foundation.
The authors declare no competing financial interests.
References
- Basten U, Biele G, Heekeren HR, Fiebach CJ. How the brain integrates costs and benefits during decision making. Proc Natl Acad Sci U S A. 2010;107:21767–21772. doi: 10.1073/pnas.0908104107. [DOI] [PMC free article] [PubMed] [Google Scholar]
- Bettman J, Luce M, Payne J. Constructive consumer choice processes. J Consumer Res. 1998;25:187–217. doi: 10.1086/209535. [DOI] [Google Scholar]
- Binder JR, Desai RH, Graves WW, Conant LL. Where is the semantic system? A critical review and meta-analysis of 120 functional neuroimaging studies. Cereb Cortex. 2009;19:2767–2796. doi: 10.1093/cercor/bhp055. [DOI] [PMC free article] [PubMed] [Google Scholar]
- Bolger DJ, Perfetti CA, Schneider W. Cross-cultural effect on the brain revisited: universal structures plus writing system variation. Hum Brain Mapp. 2005;25:92–104. doi: 10.1002/hbm.20124. [DOI] [PMC free article] [PubMed] [Google Scholar]
- Boorman ED, Behrens TE, Woolrich MW, Rushworth MF. How green is the grass on the other side? Frontopolar cortex and the evidence in favor of alternative courses of action. Neuron. 2009;62:733–743. doi: 10.1016/j.neuron.2009.05.014. [DOI] [PubMed] [Google Scholar]
- Carmichael ST, Price JL. Connectional networks within the orbital and medial prefrontal cortex of macaque monkeys. J Comp Neurol. 1996;371:179–207. doi: 10.1002/(SICI)1096-9861(19960722)371:2<179::AID-CNE1>3.0.CO%3B2-%23. [DOI] [PubMed] [Google Scholar]
- Cavada C, Compañy T, Tejedor J, Cruz-Rizzolo RJ, Reinoso-Suárez F. The anatomical connections of the macaque monkey orbitofrontal cortex. A review. Cereb Cortex. 2000;10:220–242. doi: 10.1093/cercor/10.3.220. [DOI] [PubMed] [Google Scholar]
- Chatterjee A, Thomas A, Smith SE, Aguirre GK. The neural response to facial attractiveness. Neuropsychology. 2009;23:135–143. doi: 10.1037/a0014430. [DOI] [PubMed] [Google Scholar]
- Chib VS, Rangel A, Shimojo S, O'Doherty JP. Evidence for a common representation of decision values for dissimilar goods in human ventromedial prefrontal cortex. J Neurosci. 2009;29:12315–12320. doi: 10.1523/JNEUROSCI.2575-09.2009. [DOI] [PMC free article] [PubMed] [Google Scholar]
- Cox RW. AFNI: software for analysis and visualization of functional magnetic resonance neuroimages. Comput Biomed Res. 1996;29:162–173. doi: 10.1006/cbmr.1996.0014. [DOI] [PubMed] [Google Scholar]
- Deichmann R, Gottfried JA, Hutton C, Turner R. Optimized EPI for fMRI studies of the orbitofrontal cortex. Neuroimage. 2003;19:430–441. doi: 10.1016/S1053-8119(03)00073-9. [DOI] [PubMed] [Google Scholar]
- Esterman M, Tamber-Rosenau BJ, Chiu YC, Yantis S. Avoiding non-independence in fMRI data analysis: leave one subject out. Neuroimage. 2010;50:572–576. doi: 10.1016/j.neuroimage.2009.10.092. [DOI] [PMC free article] [PubMed] [Google Scholar]
- Fiez JA, Petersen SE. Neuroimaging studies of word reading. Proc Natl Acad Sci U S A. 1998;95:914–921. doi: 10.1073/pnas.95.3.914. [DOI] [PMC free article] [PubMed] [Google Scholar]
- FitzGerald TH, Seymour B, Dolan RJ. The role of human orbitofrontal cortex in value comparison for incommensurable objects. J Neurosci. 2009;29:8388–8395. doi: 10.1523/JNEUROSCI.0717-09.2009. [DOI] [PMC free article] [PubMed] [Google Scholar]
- Frisch D, Clemen RT. Beyond expected utility: rethinking behavioral decision research. Psychological Bulletin. 1994;116:46–54. doi: 10.1037/0033-2909.116.1.46. [DOI] [PubMed] [Google Scholar]
- Gitelman DR, Penny WD, Ashburner J, Friston KJ. Modeling regional and psychophysiologic interactions in fMRI: the importance of hemodynamic deconvolution. Neuroimage. 2003;19:200–207. doi: 10.1016/S1053-8119(03)00058-2. [DOI] [PubMed] [Google Scholar]
- Hare TA, O'Doherty J, Camerer CF, Schultz W, Rangel A. Dissociating the role of the orbitofrontal cortex and the striatum in the computation of goal values and prediction errors. J Neurosci. 2008;28:5623–5630. doi: 10.1523/JNEUROSCI.1309-08.2008. [DOI] [PMC free article] [PubMed] [Google Scholar]
- Hare TA, Camerer CF, Knoepfle DT, Rangel A. Value computations in ventral medial prefrontal cortex during charitable decision making incorporate input from regions involved in social cognition. J Neurosci. 2010;30:583–590. doi: 10.1523/JNEUROSCI.4089-09.2010. [DOI] [PMC free article] [PubMed] [Google Scholar]
- Hare TA, Camerer CF, Rangel A. Self-control in decision-making involves modulation of the vMPFC valuation system. Science. 2009;324:646–648. doi: 10.1126/science.1168450. [DOI] [PubMed] [Google Scholar]
- Joseph JE. Functional neuroimaging studies of category specificity in object recognition: a critical review and meta-analysis. Cogn Affect Behav Neurosci. 2001;1:119–136. doi: 10.3758/CABN.1.2.119. [DOI] [PubMed] [Google Scholar]
- Kable JW, Glimcher PW. The neural correlates of subjective value during intertemporal choice. Nat Neurosci. 2007;10:1625–1633. doi: 10.1038/nn2007. [DOI] [PMC free article] [PubMed] [Google Scholar]
- Kable JW, Glimcher PW. The neurobiology of decision: consensus and controversy. Neuron. 2009;63:733–745. doi: 10.1016/j.neuron.2009.09.003. [DOI] [PMC free article] [PubMed] [Google Scholar]
- Knutson B, Rick S, Wimmer GE, Prelec D, Loewenstein G. Neural predictors of purchases. Neuron. 2007;53:147–156. doi: 10.1016/j.neuron.2006.11.010. [DOI] [PMC free article] [PubMed] [Google Scholar]
- Kranz F, Ishai A. Face perception is modulated by sexual preference. Curr Biol. 2006;16:63–68. doi: 10.1016/j.cub.2005.10.070. [DOI] [PubMed] [Google Scholar]
- Lancaster KJ. A new approach to consumer theory. J Pol Econ. 1966;74:132–157. doi: 10.1086/259131. [DOI] [Google Scholar]
- Litt A, Plassmann H, Shiv B, Rangel A. Dissociating valuation and saliency signals during decision-making. Cereb Cortex. 2011;21:95–102. doi: 10.1093/cercor/bhq065. [DOI] [PubMed] [Google Scholar]
- Martin A, Chao LL. Semantic memory and the brain: structure and processes. Curr Opin Neurobiol. 2001;11:194–201. doi: 10.1016/S0959-4388(00)00196-3. [DOI] [PubMed] [Google Scholar]
- McCandliss BD, Cohen L, Dehaene S. The visual word form area: expertise for reading in the fusiform gyrus. Trends Cogn Sci. 2003;7:293–299. doi: 10.1016/S1364-6613(03)00134-7. [DOI] [PubMed] [Google Scholar]
- Montague PR, Berns GS. Neural economics and the biological substrates of valuation. Neuron. 2002;36:265–284. doi: 10.1016/S0896-6273(02)00974-1. [DOI] [PubMed] [Google Scholar]
- Ongür D, Price JL. The organization of networks within the orbital and medial prefrontal cortex of rats, monkeys and humans. Cereb Cortex. 2000;10:206–219. doi: 10.1093/cercor/10.3.206. [DOI] [PubMed] [Google Scholar]
- Padoa-Schioppa C. Range-adapting representation of economic value in the orbitofrontal cortex. J Neurosci. 2009;29:14004–14014. doi: 10.1523/JNEUROSCI.3751-09.2009. [DOI] [PMC free article] [PubMed] [Google Scholar]
- Padoa-Schioppa C, Assad JA. Neurons in the orbitofrontal cortex encode economic value. Nature. 2006;441:223–226. doi: 10.1038/nature04676. [DOI] [PMC free article] [PubMed] [Google Scholar]
- Padoa-Schioppa C, Assad JA. The representation of economic value in the orbitofrontal cortex is invariant for changes of menu. Nat Neurosci. 2008;11:95–102. doi: 10.1038/nn2020. [DOI] [PMC free article] [PubMed] [Google Scholar]
- Park SQ, Kahnt T, Rieskamp J, Heekeren HR. Neurobiology of value integration: when value impacts valuation. J Neurosci. 2011;31:9307–9314. doi: 10.1523/JNEUROSCI.4973-10.2011. [DOI] [PMC free article] [PubMed] [Google Scholar]
- Philiastides MG, Biele G, Heekeren HR. A mechanistic account of value computation in the human brain. Proc Natl Acad Sci U S A. 2010;107:9430–9435. doi: 10.1073/pnas.1001732107. [DOI] [PMC free article] [PubMed] [Google Scholar]
- Plassmann H, O'Doherty JP, Rangel A. Appetitive and aversive goal values are encoded in the medial orbitofrontal cortex at the time of decision making. J Neurosci. 2010;30:10799–10808. doi: 10.1523/JNEUROSCI.0788-10.2010. [DOI] [PMC free article] [PubMed] [Google Scholar]
- Price CJ. The anatomy of language: contributions from functional neuroimaging. J Anat. 2000;197:335–359. doi: 10.1046/j.1469-7580.2000.19730335.x. [DOI] [PMC free article] [PubMed] [Google Scholar]
- Rangel A, Hare T. Neural computations associated with goal-directed choice. Curr Opin Neurobiol. 2010;20:262–270. doi: 10.1016/j.conb.2010.03.001. [DOI] [PubMed] [Google Scholar]
- Rangel A, Camerer C, Montague PR. A framework for studying the neurobiology of value-based decision making. Nat Rev Neurosci. 2008;9:545–556. doi: 10.1038/nrn2357. [DOI] [PMC free article] [PubMed] [Google Scholar]
- Rolls ET. Taste, olfactory, and food texture processing in the brain, and the control of food intake. Physiology and Behavior. 2005;85:45–56. doi: 10.1016/j.physbeh.2005.04.012. [DOI] [PubMed] [Google Scholar]
- Rolls ET, Grabenhorst F. The orbitofrontal cortex and beyond: from affect to decision-making. Prog Neurobiol. 2008;86:216–244. doi: 10.1016/j.pneurobio.2008.09.001. [DOI] [PubMed] [Google Scholar]
- Rushworth MF, Mars RB, Summerfield C. General mechanisms for making decisions? Curr Opin Neurobiol. 2009;19:75–83. doi: 10.1016/j.conb.2009.02.005. [DOI] [PubMed] [Google Scholar]
- Saleem KS, Suzuki W, Tanaka K, Hashikawa T. Connections between anterior inferotemporal cortex and superior temporal sulcus regions in the macaque monkey. J Neurosci. 2000;20:5083–5101. doi: 10.1523/JNEUROSCI.20-13-05083.2000. [DOI] [PMC free article] [PubMed] [Google Scholar]
- Schall JD. Decision making. Curr Biol. 2005;15:R9–R11. doi: 10.1016/j.cub.2004.12.009. [DOI] [PubMed] [Google Scholar]
- Simonson I, Tversky A. Choice in context: tradeoff contrast and extremeness aversion. J Marketing Res. 1992;29:281–295. doi: 10.2307/3172740. [DOI] [Google Scholar]
- Thompson-Schill SL. Neuroimaging studies of semantic memory: inferring “how” from “where”. Neuropsychologia. 2003;41:280–292. doi: 10.1016/S0028-3932(02)00161-6. [DOI] [PubMed] [Google Scholar]
- Tom SM, Fox CR, Trepel C, Poldrack RA. The neural basis of loss aversion in decision-making under risk. Science. 2007;315:515–518. doi: 10.1126/science.1134239. [DOI] [PubMed] [Google Scholar]
- Tversky A, Simonson I. Context-dependent preferences. Management Science. 1993;39:1179–1189. doi: 10.1287/mnsc.39.10.1179. [DOI] [Google Scholar]
- Van Petten C, Luka BJ. Neural localization of semantic context effects in electromagnetic and hemodynamic studies. Brain Lang. 2006;97:279–293. doi: 10.1016/j.bandl.2005.11.003. [DOI] [PubMed] [Google Scholar]
- Vartanian O, Goel V. Neuroanatomical correlates of aesthetic preference for paintings. Neuroreport. 2004;15:893–897. doi: 10.1097/00001756-200404090-00032. [DOI] [PubMed] [Google Scholar]
- Wallis JD. Orbitofrontal cortex and its contribution to decision-making. Annu Rev Neurosci. 2007;30:31–56. doi: 10.1146/annurev.neuro.30.051606.094334. [DOI] [PubMed] [Google Scholar]
- Wallis JD, Miller EK. Neuronal activity in primate dorsolateral and orbital prefrontal cortex during performance of a reward preference task. Eur J Neurosci. 2003;18:2069–2081. doi: 10.1046/j.1460-9568.2003.02922.x. [DOI] [PubMed] [Google Scholar]
- Winston JS, O'Doherty J, Kilner JM, Perrett DI, Dolan RJ. Brain systems for assessing facial attractiveness. Neuropsychologia. 2007;45:195–206. doi: 10.1016/j.neuropsychologia.2006.05.009. [DOI] [PubMed] [Google Scholar]
- Wunderlich K, Rangel A, O'Doherty JP. Economic choices can be made using only stimulus values. Proc Natl Acad Sci U S A. 2010;107:15005–15010. doi: 10.1073/pnas.1002258107. [DOI] [PMC free article] [PubMed] [Google Scholar]
- Xue G, Poldrack RA. The neural substrates of visual perceptual learning of words: implications for the visual word form area hypothesis. J Cogn Neurosci. 2007;19:1643–1655. doi: 10.1162/jocn.2007.19.10.1643. [DOI] [PubMed] [Google Scholar]
- Xue G, Chen C, Jin Z, Dong Q. Language experience shapes fusiform activation when processing a logographic artificial language: An fMRI training study. Neuroimage. 2006;31:1315–1326. doi: 10.1016/j.neuroimage.2005.11.055. [DOI] [PubMed] [Google Scholar]
- Yue X, Vessel EA, Biederman I. The neural basis of scene preferences. Neuroreport. 2007;18:525–529. doi: 10.1097/WNR.0b013e328091c1f9. [DOI] [PubMed] [Google Scholar]