

Abstract
Long-term plasticity in sensory systems is usually conceptualized as changing the interpretation of the brain of sensory information, not an alteration of how the sensor itself responds to external stimuli. However, here we demonstrate that, in the adult mouse olfactory system, a 1-week-long exposure to an artificially odorized environment narrows the range of odorants that can induce neurotransmitter release from olfactory sensory neurons (OSNs) and reduces the total transmitter release from responsive neurons. In animals heterozygous for the olfactory marker protein (OMP), this adaptive plasticity was strongest in the populations of OSNs that originally responded to the exposure odorant (an ester) and also observed in the responses to a similar odorant (another ester) but had no effect on the responses to odorants dissimilar to the exposure odorant (a ketone and an aldehyde). In contrast, in OMP knock-out mice, odorant exposure reduced the number and amplitude of OSN responses evoked by all four types of odorants equally. The effect of this plasticity is to preferentially sparsen the primary neural representations of common olfactory stimuli, which has the computational benefit of increasing the number of distinct sensory patterns that could be represented in the circuit and might thus underlie the improvements in olfactory discrimination often observed after odorant exposure (Mandairon et al., 2006a). The absence of odorant specificity in this adaptive plasticity in OMP knock-out mice suggests a potential role for this protein in adaptively reshaping OSN responses to function in different environments.
Introduction
Adaptive plasticity can permit dynamic optimization of sensory systems for different statistical distributions of sensory stimuli in a changing environment (Kaas, 1991; Dahmen and King, 2007; Schwarzkopf et al., 2009; Pienkowski and Eggermont, 2011). In sensory areas of the mammalian cerebral cortex, the sensory environment during development has long been understood to determine the circuit architecture (Hubel and Wiesel, 1970; Katz and Shatz, 1996; Cohen-Cory, 2002), and it is increasingly clear that experience-dependent neuroplasticity can continue throughout adulthood (Weinberger, 2004; Karmarkar and Dan, 2006; Goel and Lee, 2007; Li et al., 2008; Gilbert et al., 2009; Wilbrecht et al., 2010; de Villers-Sidani and Merzenich, 2011; Mendez and Bacci, 2011). In contrast to these higher brain regions, primary sensory neurons (e.g., photoreceptors in the retina, inner hair cells in the cochlea, etc.) are generally presumed to be plastic only early in life (Tian and Copenhagen, 2001; Tyler et al., 2007) and then to provide stable sensory inputs to the brain thereafter. However, this presumption has proved difficult to test because of the difficulty in performing longitudinal experiments in primary sensory neurons in most sensory modalities, particularly in vivo.
Olfactory sensory neurons (OSNs), the primary sensory neurons in the olfactory system, bind odorants in the nasal cavity and project their axons through the olfactory nerve to the olfactory bulbs of the brain. Each OSN in the nasal epithelium expresses one of a repertoire of ∼1000 olfactory receptors in the mouse, and as the axons reach the bulb, they segregate by receptor type such that all of the OSNs expressing a given receptor project to one or two specific glomeruli (spherical structures in which OSN axons converge and synapse onto postsynaptic neurons) on the surface of the olfactory bulb (Mombaerts, 2006). An odorant binding to a subset of odorant receptor types in the epithelium stimulates those OSNs to fire action potentials and thus evokes neurotransmitter release from OSN synaptic terminals into a corresponding subset of olfactory bulb glomeruli. This synaptic output from OSNs can be visualized optically in vivo in gene-targeted mice that express the fluorescent exocytosis indicator synaptopHluorin (spH) from the locus for olfactory marker protein (OMP), resulting in expression in OSN presynaptic terminals (OMP–spH mice; Bozza et al., 2004). The patterns of synaptic input evoked by odorant presentation are odorant specific, stable across time (Bozza et al., 2004), and similar across mice (Soucy et al., 2009), thus providing a model system in which experience-dependent plasticity in the primary sensory input to the CNS can be observed in the same individual over time.
Here, we used optical imaging techniques in OMP–spH mice to visualize patterns of primary sensory input to the olfactory bulb of the brain and how those patterns are changed when adult mice live in an artificially odorized environment for 1 week. Because the odorant selectivity of mature OSNs is determined in part by OMP expression (Lee et al., 2011; Kass et al., 2013b), we then compared the effects of odorant exposure between OMP heterozygous (OMP−/+) and OMP knock-out (OMP−/−) mice.
Materials and Methods
Subjects.
Adult (4–9 months old) male and female OMP–spH mice were used as subjects in the imaging experiments (Czarnecki et al., 2011, 2012; Kass et al., 2013b). In this mouse line, spH is expressed under the OMP promoter in all OSN terminals, and spH signals indicate neurotransmitter release from the olfactory nerve into olfactory bulb glomeruli (Bozza et al., 2004). Mice heterozygous for both OMP and spH were generated by crossing OMP−/−–spH mice with wild-type 129 mice as described previously (Czarnecki et al., 2011; Kass et al., 2013b). OMP is highly and selectively expressed in mature OSNs. Because OMP has been implicated in olfactory transduction (although its specific function remains elusive), we hypothesized that it may play a role in adaptively shaping OSN physiology in response to environmental stimuli. Thus, the rationale for including OMP−/+ mice and OMP−/− mice in the present study was to determine whether OMP plays a role in activity-dependent plasticity in primary olfactory representations.
The results shown in Figures 2, 3, and 6D came from a total of 36 olfactory bulbs in 18 OMP−/+–spH mice, and the results shown in Figures 4, 5, and 6E came from a total of 48 olfactory bulbs in 24 OMP−/−–spH mice. The number of OMP−/+ subjects assigned to each exposure group is indicated in the procedure summary shown in Figure 2A, and the exposure group assignment for OMP−/− subjects is indicated in Figure 4A. All experiments were performed in accordance with protocols approved by the Rutgers University Institutional Animal Care and Use Committee.
Figure 2.
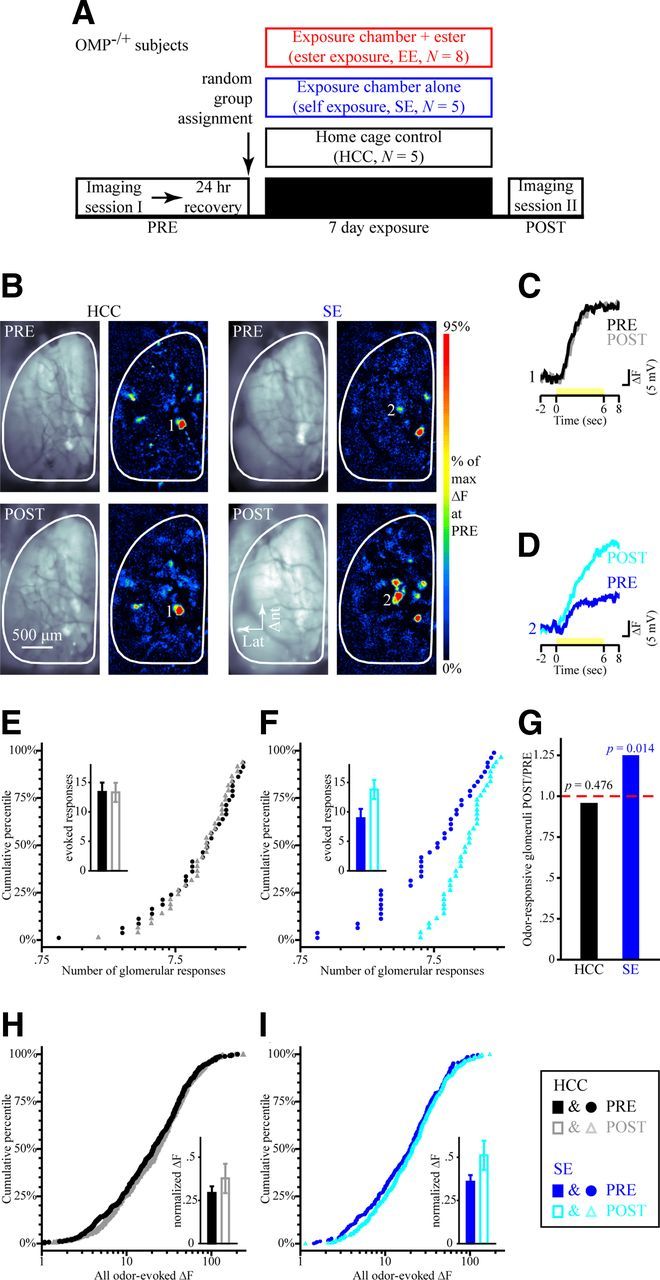
Physiological responses to test odorants in OMP-heterozygous mice are stable over time in HCCs but enhanced by 1 week of self-control exposure. A, Timeline of the optical imaging study showing HCC, SE, and EE group assignments of OMP−/+ mice. B, Example resting fluorescence images and 2M2B-evoked pseudocolored difference maps from an HCC mouse (left) and an SE mouse (right) during PRE (top) and POST (bottom) imaging sessions. C, D, Sets of traces (scaled relative to each max) evoked by 2M2B (yellow stimulus bar) from HCC (C) and SE (D) subjects corresponding to the numbered callouts in B. E, F, Cumulative probability plots showing the distributions of odorant-evoked responses in olfactory bulbs from HCC (E) and SE (F) groups both before (filled circles) and after (open triangles) the 1-week-long exposure period. The mean ± SEM number of odorant-evoked glomerular responses during PRE (filled bars) and POST (open bars) imaging sessions is shown in the inset for HCC (E) and SE (F) groups. G, Ratios for the total frequency of odorant-responsive glomeruli during POST imaging relative to that of PRE per group. p values indicate PRE versus POST comparisons within each group. H, I, Cumulative probability plots showing distributions of ΔF values from PRE versus POST imaging sessions in HCC (H) and SE (I) groups. Individual ΔF values were normalized relative to the maximum ΔF evoked at PRE and are shown in the insets as the mean ± SEM normalized ΔF. The legend displayed in the bottom right corresponds to E, F, H, and I.
Figure 3.

EE selectively alters OSN physiology in OMP-heterozygous mice. A, Pseudocolored difference maps evoked by the exposed ester (MV, first set), unexposed ester (BA, second set), unexposed ketone (2HEX, third set), and unexposed aldehyde (2M2B, fourth set) during PRE and POST imaging in the same ester-exposed OMP−/+ subject. B, C, Mean ± SEM number of odorant-evoked glomerular responses (B) and normalized odorant-evoked ΔF (C) from PRE (filled bars) and POST (open bars) imaging sessions plotted as a function of imaging odorant stimulus. D–G, Cumulative probability plots showing the distributions of ΔF values evoked by the exposed ester (D) and the unexposed ester (E), ketone (2HEX, F), and aldehyde (2M2B, G) during PRE (filled, red circles) and POST (open, orange triangles) imaging sessions. Data from the exposed and unexposed esters are counterbalanced across subjects in the EE group.
Figure 6.

Odorant selectivity of responsive glomeruli is altered by olfactory experience. A–C, Example selectivity patterns during PRE and POST imaging sessions in six individual glomeruli (numbered 1–6) from HCC (A), SE (B), and EE (C) subjects that were OMP−/+. Each numbered set of four traces corresponds to the responsivity of that glomerulus to presentations (shown as yellow stimulus bars) of four test odorants (BA, MV, 2HEX, and 2M2B) before and after the exposure manipulation. Traces are color coded by odorant, as shown in the legend below A–C. Each set of PRE and POST traces is scaled relative to the maximum evoked response across the four odorants. Glomeruli 1, 3, and 5 exhibited higher response selectivity at baseline, whereas glomeruli 2, 4, and 6 exhibited lower response selectivity at baseline. D, E, Percentage of OMP-heterozygous (D) and OMP-null (E) glomerular populations within each exposure group that were categorized as having higher odorant response selectivity both before (PRE, solid bars) and after (POST, open bars) the 1 week exposure period.
Figure 4.
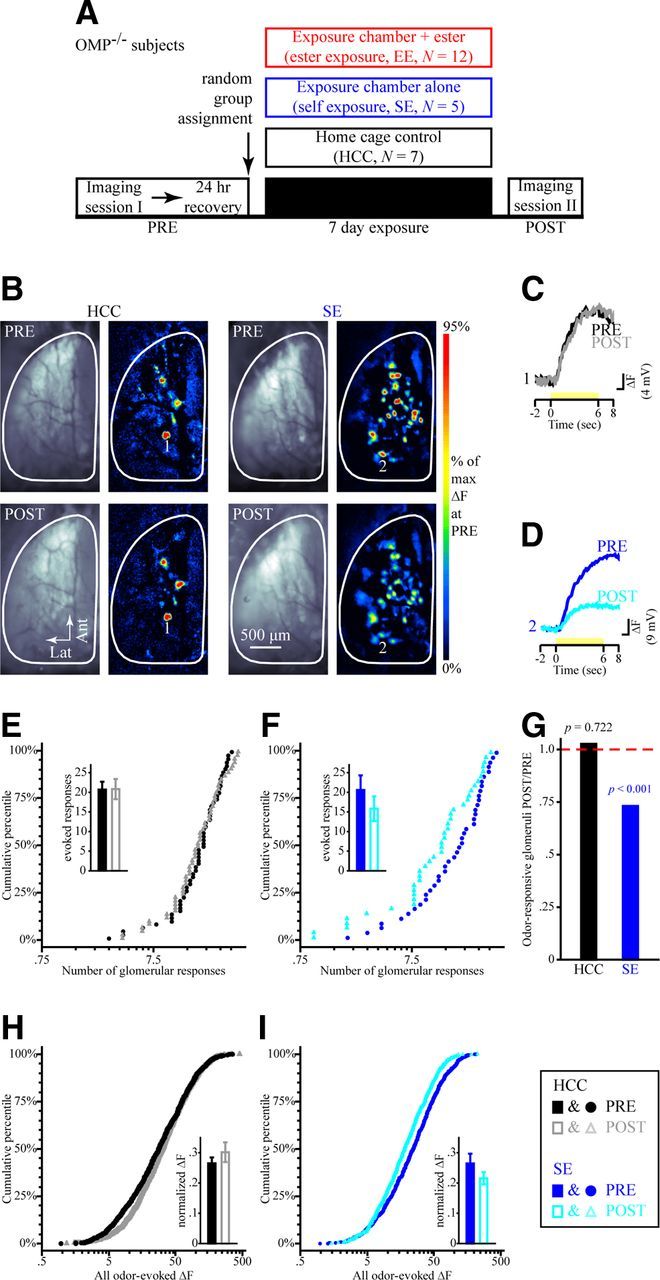
Physiological responses to test odorants in OMP-null mice are stable over time in HCCs but attenuated by 1 week of self-control exposure. A, Timeline of the optical imaging study showing HCC, SE, and EE group assignments of OMP−/− mice. B, Example resting fluorescence images and 2M2B-evoked pseudocolored difference maps from HCC (left) and SE (right) subjects during PRE (top) and POST (bottom) imaging sessions. C, D, Sets of traces (scaled relative to each maximum) evoked by 2M2B (yellow stimulus bar) from HCC (C) and SE (D) subjects corresponding to the numbered callouts in B. E, F, Cumulative probability plots showing the distributions of odorant-evoked responses in olfactory bulbs from HCC (E) and SE (F) groups both before (filled circles) and after (open triangles) the 1-week-long exposure period. The mean ± SEM number of odorant-evoked glomerular responses during PRE (filled bars) and POST (open bars) imaging sessions is shown in the inset for HCC (E) and SE (F) groups. G, Ratios for the total frequency of odor-responsive glomeruli during POST imaging relative to that of PRE per group. p values indicate PRE versus POST comparisons within each group. H, I, Cumulative probability plots showing distributions of ΔF values from PRE versus POST imaging sessions in HCC (H) and SE (I) groups. Individual ΔF values were normalized relative to the maximum ΔF evoked at PRE and are shown in the insets as the mean ± SEM normalized ΔF. The legend displayed in the bottom right corresponds to E, F, H, and I.
Figure 5.

The effects of EE on OSN physiology in OMP-null mice do not exhibit stimulus specificity. A, Pseudocolored difference maps evoked by the exposed ester (BA, first set), unexposed ester (MV, second set), unexposed ketone (2HEX, third set), and unexposed aldehyde (2M2B, fourth set) during PRE and POST imaging in the same ester-exposed OMP−/− subject. B, C, Mean ± SEM number of odorant-evoked glomerular responses (B) and normalized odorant-evoked ΔF (C) from PRE (filled bars) and POST (open bars) imaging sessions plotted as a function of imaging odor stimulus. D–G, Cumulative probability plots showing the distributions of ΔF values evoked by the exposed ester (D) and the unexposed ester (E), ketone (2HEX, F), and aldehyde (2M2B, G) during PRE (filled, red circles) and POST (open, orange triangles) imaging sessions. Data from the exposed and unexposed esters are counterbalanced across subjects in the EE group.
In vivo visualization of odorant-evoked neurotransmitter release from OSN terminals.
Chronic cranial windows were implanted bilaterally as reported previously (Bozza et al., 2004). Briefly, mice were anesthetized with pentobarbital and dosed with atropine to reduce intranasal mucous secretion. The skull was exposed and fitted with a dental acrylic head cap designed to permit replicable positioning across imaging sessions. The bone overlying the dorsal surface of both olfactory bulbs was thinned until transparent and coated with a thin layer of clear-drying cyanoacrylate adhesive. During imaging sessions, cranial windows were topped with Ringer's solution and a glass coverslip (for examples of chronic windows, see Figs. 2B, 4B). Between imaging sessions, the cranial window was protected by a metal cover.
In vivo optical imaging was performed as described previously (Moberly et al., 2012; Kass et al., 2013a). Briefly, odorant-evoked fluorescence signals from the olfactory bulbs were recorded in vivo with a custom-built imaging apparatus with a 4× (0.28 numerical aperture) objective. Epi-illumination was provided by a 150 W xenon arc lamp (Cairn Research or Opti-Quip) with appropriate filters or a 470 nm wavelength bright light-emitting diode (Thorlabs). Optical signals were acquired using a 256 × 256 monochrome CCD camera (RedShirtImaging) at 7 Hz. Odorants known to drive synaptic input to glomeruli on the dorsal surface of the olfactory bulb (Soucy et al., 2009) were presented using a custom vapor dilution olfactometer using nitrogen as the carrier. All odorants were obtained at 95–99.5% purity from Sigma-Aldrich. Odorant concentrations [expressed in arbitrary units (a.u.)] were standardized across all imaging sessions using a photoionization detector (ppbRae; Rae Systems): n-butyl acetate (BA), methyl valerate (MV), 2-hexanone (2HEX), and trans-2-methyl-2-butenal (2M2B) were presented at a concentration of 15 a.u. Odorants were presented in blocks of four to eight trials at 60 s intertrial intervals.
Chronic odorant exposure.
A perennial challenge in olfactory research is the difference in air exchange between a typical open shoebox home cage and any kind of odorant exposure system, which must be enclosed to contain the odorant. In the present study, we used both a home cage control (HCC) group and what we call a “self-exposure” (SE) control group, which lived in the same exposure chamber as the “ester exposure” (EE) group and breathed air that was sham-odorized on the same schedule with mineral oil vehicle. We refer to this group as self-exposure because over the course of 1 week the chamber inevitably became substantially odorized with the odor of the mouse itself and its waste products, regardless of the sham-odor (i.e., mineral oil only) cycle (Fig. 1B). This experience by itself induced a form of olfactory plasticity (see Results) and thus provides a useful comparison for both the HCC and EE groups.
Figure 1.

Ester odorants are reliably added and removed from the chambers on a 4 h duty cycle, whereas self odors accumulate evenly during ON and OFF cycles throughout the 1-week-long exposure period. A, Timeline of the exposure period showing the full 7 d duration (bottom) with a trace (middle) indicating the 4 h duty cycling in the exposure chambers. The outlined portion of the duty cycle is expanded immediately above the timeline (top) and shows photoionization detection measurements that were sampled once per minute from a BA EE chamber during the last 30 min of an ON cycle and the first 30 min of an OFF cycle. B, Mean self odor concentration from 12 occupied (circles, solid lines) and six vacant (triangles, dashed lines) SE chambers. Photoionization detection measurements were recorded during ON and OFF cycles across 7 consecutive days.
Imaging experiments were performed both before and after each mouse spent 7 d in one of three randomly assigned exposure environments (as shown in Figs. 2A, 4A). In two of the environments, EE and SE, mice were housed in a Plexiglas exposure chamber (10 × 20 × 15 cm, width × height × length) containing bedding, rodent chow, and a water bottle. The third environment was the mouse's wire-topped shoebox-style home cage, which served as a standard laboratory environment control group (HCC). To minimize perturbations in the airflow throughout the odorant exposure system, as well as disturbances to the actual odorant exposure (see below), the chambers were only opened for animal entry and exit. Thus, even before explicitly adding a monomolecular odorant to an exposure chamber, there were differences between housing in a standard mouse cage and housing in an exposure chamber, including differences in the air exchange, the size of the housing environment, the size-appropriate amount of bedding filling each environment (a larger cage necessitates a larger quantity of bedding), the bedding changing schedule, etc. Such differences may produce distinct olfactory environments (Oliva et al., 2010), necessitating the use of a sham control group (the SE group) and a standard laboratory housing control group (the HCC group). All subjects were single housed during the 1 week exposure period.
In the EE and SE environments, room air was constantly pulled through the chambers by a vacuum (13 L/min). With a continuous 4 h duty cycle (Fig. 1A), a solenoid valve shunted the airflow source between clean room air and the headspace of a bottle containing an ester odorant (BA or MV) diluted in mineral oil, or mineral oil alone for the SE group. In the EE group, the ester odorant that was added to the chamber was evenly counterbalanced across mice. Specifically, 10 of the subjects in the EE group (OMP−/+, n = 4; OMP−/−, n = 6) spent the week individually housed in chambers that were odorized with BA during the 4 h ON cycles, whereas the other 10 ester-exposed subjects (OMP−/+, n = 4; OMP−/−, n = 6) spent the week individually housed in chambers odorized with MV during ON cycles. This design permitted a comparison of the effects of EE on primary sensory representations evoked by the exposed ester, the unexposed ester, and two other classes of odorants (a ketone, 2HEX, and an aldehyde, 2M2B). A photoionization detector was used to standardize the ester odorant concentrations inside the chambers daily (as well as between the two counterbalanced esters). Additionally, ester odorant concentrations were measured to confirm that, during the ON cycles, the esters were delivered at a relatively constant concentration and were then successfully cleared from the chambers during the OFF cycles, as shown in Figure 1A. Peak ester odorant concentrations in the exposure chambers during ON cycles varied somewhat across days, ranging from ∼30 a.u. (immediately after the odorant vial was replaced) to ∼15 a.u. (at which point the odorant vial was replaced). Because the mouse's own endogenously produced odorants gradually permeate the chamber (Fig. 1B), ester odorant concentrations (and solution preparations) were calibrated based on measurements taken from vacant EE chambers arranged in parallel with occupied chambers.
Mice had a ∼24 h recovery period between baseline imaging (imaging session I in Figs. 2A, 4A) and the onset of the 1-week-long exposure period. To reduce short-term adaptation effects before undergoing the post-exposure imaging session (shown as imaging session II in Figs. 2A, 4A), all mice were removed from the exposure chamber (or home cage) during non-odor periods and individually transferred to temporary holding cages in the imaging facility a minimum of ∼1 h before experimentation.
Imaging datasets and analyses.
Imaging data were analyzed as described previously (McGann et al., 2005; Kass et al., 2013a). All data were high-pass spatial filtered in MATLAB and exported to SPSS 17.0 for statistical analysis. A glomerulus was considered to receive odorant-evoked OSN synaptic input if it exhibited an average spH signal at least 3 SEs above 0 across multiple presentations of the same odorant. The raw dataset for the experiments in Figures 2, 3, and 6D (data collected from OMP−/+ subjects) included 293 responsive glomeruli at baseline and 276 after exposure (from 10 bulbs in five mice) for the HCC group, 217 responsive glomeruli at baseline and 270 after exposure (from 10 bulbs in five mice) for the SE group, and 459 responsive glomeruli at baseline and 345 after exposure (from 16 bulbs in eight mice) for the EE group. The raw dataset for the experiments in Figures 4, 5, and 6E (data collected from OMP−/− subjects) included 473 responsive glomeruli at baseline and 485 responsive glomeruli after exposure (from 14 bulbs in seven mice) for the HCC group, 356 responsive glomeruli at baseline and 260 after exposure (from 10 bulbs in five mice) for the SE group, and 849 responsive glomeruli at baseline and 475 after exposure (from 24 bulbs in 12 mice) for the EE group.
To determine whether there were exposure-dependent changes in the overall average number of responses contributing to each odor representation, we quantified the number of glomerular responses evoked by each of four imaging test odorants per olfactory bulb during both imaging sessions. These data were analyzed via three-way ANOVAs that were calculated separately for each group of subjects, as well as with planned post hoc ANOVAs and t tests to make pairwise comparisons and assess interactions of main interest. The omnibus ANOVAs that were calculated for HCC and SE groups each included three within-subjects variables: imaging session (pre-exposure, post-exposure), imaging test odorant (BA, MV, 2HEX, 2M2B), and side (left olfactory bulb, right olfactory bulb). A similar ANOVA was calculated to analyze the differential effects of the exposure odorant in the EE group, except that imaging test odorants were classified as exposed (for the odorant that was added to the exposure chamber) or unexposed. There was no main effect of side in any of these three-way factorials, demonstrating that for each mouse the average number of odorant-evoked responses in the left and right olfactory bulbs was approximately symmetric. Because bulbar maps were symmetrical, the results reported here (unless otherwise noted) consist of the main effects and interaction effects of imaging session and imaging test odorant that average across bulbs. Additionally, to evaluate potential changes in individual odorant-evoked glomerular response maps, we analyzed the distributions of the number of glomerular responses per odor map. Note that all four odorants were unexposed in the HCC and SE groups. Accordingly, distributions of the number of odorant-evoked glomerular responses were pooled across odorants for the HCC and SE groups. All response distributions were analyzed with nonparametric Mann–Whitney (M–W) and Kolmogorov–Smirnov (K–S) tests.
The total number of observed responses in an olfactory bulb does not equate to the total number of responsive glomeruli in that bulb because some glomeruli responded to two or more odors in the panel. To evaluate how the mouse's odor environment affected glomerular responsivity, we thus also quantified the total number of individual glomeruli that responded to any number of odorants during pre-exposure and post-exposure imaging preparations and analyzed these frequency data via Pearson's χ2 tests.
To investigate any changes in the magnitude of odorant-evoked OSN synaptic output, we analyzed both the central tendencies and full distributions of response amplitudes (odorant-evoked change in fluorescence, ΔF). Odorant-evoked ΔF values were normalized to permit averaging across mice. This normalization was performed within each test odorant and used to generate an average (test odor-specific) ΔF value per olfactory bulb per mouse; that is, all ΔF values evoked by a given odorant (during both imaging sessions) were normalized relative to the maximum ΔF value evoked by that odorant across both olfactory bulbs during baseline imaging. The normalized ΔF values (representing the average ΔF of an olfactory bulb in response to each test odorant) were then analyzed via ANOVAs and t tests, like the analyses described above for the number of odorant-evoked responses. The distributions of individual odorant-evoked response amplitudes were pooled across glomeruli and odorants for the HCC and SE groups and are displayed as cumulative frequency histograms. For the EE groups, distributions of odorant-evoked ΔF values were pooled across glomeruli per odor category (i.e., exposed ester, unexposed ester, or unexposed ketone and aldehyde). These data were analyzed with M–W and K–S tests to investigate potential changes in the full distributions of response magnitudes.
We also assessed odorant selectivity in populations of responding glomeruli. Contingency tables were first generated by characterizing individual responding glomeruli according to three parameters: exposure group, imaging session, and the number of test odorants that evoked a measurable response (ranging from one to four) using the criterion described above. This three-way contingency table was analyzed using backward elimination log-linear regression. Based on this preliminary analysis (which yielded the same results as those reported here), we then collapsed the selectivity category down from four levels (i.e., responded to one, two, three, or four of the test odorants) into two levels to simplify the summary of results, as in the study by Kass et al. (2013b). Thus, each individual responsive glomerulus was categorized as having either “higher” selectivity (if it responded to one or two odorants, as in the pre-exposure traces shown for glomeruli 1, 3, and 5 in Fig. 6A–C) or “lower” selectivity (if it responded to three or four odorants, as in the pre-exposure traces shown for glomeruli 2, 4, and 6 in Fig. 6A–C). The categorical frequency data were analyzed via log-linear regression to evaluate the three-way association (as in our preliminary analysis) and followed with post hoc χ2 tests.
Results
Experience-dependent changes in the number and size of OSN inputs to olfactory bulb glomeruli in heterozygous OMP–spH mice
To longitudinally evaluate experience-dependent plasticity, the neurotransmitter release from OSNs into olfactory bulb glomeruli evoked by a panel of four odorants (composed of two esters, a ketone and an aldehyde) was visualized in two optical imaging sessions 1 week apart in each of 18 OMP−/+–spH mice that were randomly assigned to one of three exposure groups (Fig. 2A). Mice were anesthetized throughout both imaging preparations (see Materials and Methods). Figure 2B shows resting fluorescence images of the dorsal olfactory bulb through the cranial window and pseudocolored difference maps showing the pattern of OSN synaptic input to olfactory bulb glomeruli evoked by the odorant 2M2B before and after 1 week in the HCC and SE exposure conditions.
For the HCC group, both the average number of glomeruli receiving measurable synaptic input during an odorant presentation (Fig. 2E, inset; F(1,4) = 0.001, p = 0.976) and the mean normalized amplitude of those responses (Fig. 2H, inset; F(1,4) = 1.817, p = 0.249) were comparable before and after the exposure period across the four imaging test odorants and both olfactory bulbs (glomerular responses, nonsignificant three-way interaction, F(3,12) = 1.137, p = 0.374, ηp2 = 0.221; normalized response magnitudes, nonsignificant three-way interaction, F(3,12) = 1.683, p = 0.223, ηp2 = 0.296). Because there were no test odorant-specific changes in OSN activity or bulbar symmetry, we pooled across imaging test odorants and olfactory bulbs (and thus also across mice). We then evaluated the entire population of glomerular responses (Fig. 2E) and ΔF values (Fig. 2H) during pre- and post-HCC exposure and observed no changes in these distributions. Additionally, the total number of glomeruli that responded to any odorant pooled across olfactory bulbs and mice was the same during both imaging sessions (Fig. 2G, black bar; χ2(1) = 0.508, p = 0.576). Together, the results in HCC heterozygous OMP–spH mice demonstrate the stability of these measurements across 1 week in normal laboratory conditions, as illustrated in Figure 2, B (left) and C.
SE and EE altered the pattern of odorant-evoked glomerular input but in opposite directions. As depicted by the pre-exposure (top) and post-exposure (bottom) pseudocolored difference maps in Figure 2B (right), mice in the SE group (which were not explicitly exposed to any of the odorants in the panel but were exposed to rising concentrations of their own endogenously produced odors; Fig. 1B) exhibited an increase in the average number of glomeruli receiving measurable odorant-evoked OSN synaptic input during an odorant presentation compared with their own pre-exposure baseline (Fig. 2F, inset). On average, this increase was equal across the four odorants tested and both sides of individual mice (nonsignificant imaging session × test odorant × side interaction; F(3,12) = 1.852, p = 0.192). Accordingly, we pooled across test odorants and olfactory bulbs in subsequent analyses considering the entire distribution of glomerular responses. As shown in Figure 2F, the number of glomerular responses that represented a given odorant after 1 week of SE tended to be ranked higher than at baseline (M–W test, Z = −3.673, p < 0.001), and the distribution of these augmented odor representations also differed from baseline (K–S test, Z = 1.789, p = 0.003). Moreover, the total number of glomeruli that responded to any odorant pooled across mice increased after SE compared with the pre-exposure baseline (Fig. 2G, blue bar; χ2(1) = 6.0, p = 0.014).
In contrast to the SE group of OMP−/+ subjects, OMP−/+ mice in the EE group exhibited an ester-selective decrease in the number of glomeruli receiving odorant-evoked OSN input (Fig. 3A,B; imaging session × test odorant interaction, F(3,21) = 14.753, p < 0.001, ηp2 = 0.678), as well as a reduction in the total number of odorant-responsive glomeruli pooled across mice (nPRE = 459, nPOST = 345; χ2(1) = 16.164, p < 0.001). Although the number of glomerular responses evoked by both the exposed and unexposed esters decreased after 1 week of EE, the reduction in responses evoked by the exposed ester (Fig. 3B, first pair of bars; F(1,7) = 45.0, p < 0.001, ηp2 = 0.865) was greater than the reduction in unexposed ester-evoked responses (Fig. 3B, second pair of bars; F(1,7) = 9.590, p = 0.017, ηp2 = 0.578). Unlike the increase in responses to all four odors that occurred in the SE group, the EE group exhibited no change in the average number of (unexposed) 2HEX-evoked responses (F(1,7) = 0.101, p = 0.760, ηp2 = 0.014) or in the average number of (unexposed) 2M2B-evoked responses (F(15) = 0.063, p = 0.809, ηp2 = 0.009), as shown in Figure 3B (third and fourth pairs of bars).
The magnitude of the spH signals evoked in olfactory bulb glomeruli was also differentially affected by SE (Fig. 2D,I) and EE (Fig. 3C–G). SE significantly increased the size of these signals (Fig. 2I, main; M–W test, Z = −2.061, p = 0.039; Fig. 2I, inset; main effect of imaging session, F(1,4) = 10.159, p = 0.033, ηp2 = 0.717). In contrast, EE selectively and greatly reduced the amplitude of spH signals evoked by only the exposed ester [Fig. 3C (F(1,7) = 9.195, p = 0.019, ηp2 = 0.568), D (K–S test, Z = 2.823, p < 0.001)] but not by the unexposed ester [Fig. 3C (F(1,7) = 0.298, p = 0.602, ηp2 = 0.041), E (K–S test, Z = 0.8, p = 0.544)]. A careful examination revealed that, although the mean response amplitudes remained unchanged for the non-exposed ketone (2HEX) and aldehyde (2M2B) odorants (Fig. 3C), the distribution of their response amplitudes (Fig. 3F,G) became slightly but significantly narrower (less variance) after 1 week of EE (K–S test, Z = 1.533, p = 0.018).
A different pattern of experience-dependent changes in OSN inputs to olfactory bulb glomeruli in OMP knock-out mice
OMP is an olfactory transduction protein that has been shown to confer odorant selectivity in individual OSNs during development (Lee et al., 2011) and in adult OMP–spH mice (Kass et al., 2013b). Because the decreased number of olfactory bulb glomeruli after odorant exposure could reflect an increase in odorant selectivity (see below), we hypothesized that OMP could play a role in this exposure-induced plasticity. To test the role of OMP in exposure-induced OSN plasticity, we replicated the above experiment in 24 mice (Fig. 4A) that were homozygous for spH at the OMP locus and were thus OMP null following the manner of Lee et al. (2011) and Kass et al. (2013b). For the HCC group, the average number of glomeruli receiving measurable synaptic input during an odorant presentation (Fig. 4E, inset; F(1,6) = 0.006, p = 0.943, ηp2 = 0.001) and the amplitude of those inputs (Fig. 4H, inset; F(1,6) = 2.361, p = 0.175, ηp2 = 0.282) were again comparable before and after the exposure period (examples shown in Fig. 4B,C), and this was true across all four test odorants and both sides of the window (glomerular responses, nonsignificant session × odor × side interaction, F(3,18) = 0.777, p = 0.522, ηp2 = 0.115; normalized response magnitudes, nonsignificant session × odor × side interaction, F(3,18) = 0.761, p = 0.531, ηp2 = 0.112). Furthermore, there was no change in the total number of odor-responsive glomeruli (Fig. 4G, black bar; χ2(1) = 0.126, p = 0.722). These results demonstrate that odorant-evoked responses are stable under normal laboratory conditions in adult OMP−/−–spH mice, similar to the stability of odorant-evoked OSN responses in OMP−/+ subjects (Fig. 2).
Unlike the self-exposed OMP−/+ mice that exhibited an enhancement in odorant-evoked glomerular responses after 1 week of SE (Fig. 2), OMP−/− mice in the SE group exhibited a nonsignificant reduction in the average number of glomeruli receiving measurable synaptic input during an odorant presentation (Fig. 4F, inset; main effect of imaging session, F(1,4) = 1.397, p = 0.303, ηp2 = 0.259) compared with their own pre-exposure baseline. Interestingly, there was a significant reduction in the total number of OMP−/− glomeruli that responded to any odorant in the panel, pooled across mice (Fig. 4G, blue bar; χ2(1) = 14.961, p < 0.001). The decrease in the total number of responding glomeruli without a change in the average number of responses evoked by an odorant suggested that each odorant-responsive glomerulus may respond to more odorants after 1 week of SE in OMP−/− mice (see selectivity analysis below).
Like the ester-exposed OMP−/+ mice above (Fig. 3), OMP−/− mice in the EE group exhibited a large decrease in the number of glomeruli receiving evoked OSN input (Fig. 5A,B; main effect of imaging session, F(1,11) = 62.108, p < 0.001, ηp2 = 0.850), but unlike OMP−/+ mice, this decrease occurred equally for all four odorants in the test panel (Fig. 5B; nonsignificant imaging session × odorant interaction, F(3,33) = 0.951, p = 0.427, ηp2 = 0.080). Furthermore, the total number of odor-responsive glomeruli was greatly reduced after EE (nPRE = 849, nPOST = 475; χ2(1) = 105.647, p < 0.001), more so than in ester-exposed OMP−/+ mice; after 1 week of EE, the frequency of odorant-responsive glomeruli was 75 and 56% of baseline in OMP−/+ mice and OMP−/− mice, respectively.
The pattern of exposure-induced changes in the magnitude of spH signals evoked in olfactory bulb glomeruli were also different in OMP−/− mice compared with that in OMP−/+ mice. Whereas 1 week of SE scaled the distribution of response magnitudes up in the heterozygous mice (Fig. 2I), individual odorant-evoked ΔF values in OMP−/− mice were smaller (M–W test, Z = −4.37, p < 0.001) and distributed differently (K–S test, Z = 2.812, p < 0.001) after 1 week of SE, as shown in Figure 4I. Moreover, EE greatly reduced the amplitude of spH signals evoked by the exposed ester (Fig. 5C,D), but this reduction was not odorant specific (Fig. 5C; nonsignificant imaging session × odorant interaction, F(3,33) = 1.489, p = 0.236, ηp2 = 0.119), with significant reductions also observed in the magnitudes of responses to the unexposed ester (Fig. 5E; M–W test, Z = −6.372, p < 0.001; K–S test, Z = 2.85, p < 0.001) and the other unexposed odors (Fig. 5F,G; M–W test, Z = −11.025, p < 0.001; K–S test, Z = 5.125, p < 0.001).
Exposure-induced changes in glomerular inputs reflect changes in odorant selectivity
Based on the pattern of results observed above, it was possible that odorant exposure caused changes in the selectivity of odor-responsive glomeruli (Fig. 6). To assess this, we categorized odorant-responsive glomeruli in each exposure group as having high odorant selectivity or low selectivity (see Materials and Methods; a more complex analysis with four categories of selectivity produced similar results) and then tested whether there were changes in the relative frequency of glomeruli within each category between imaging sessions. This analysis demonstrated that the distributions of odor-responsive glomeruli within each selectivity category were best accounted for in both OMP−/+ glomerular populations (Fig. 6D; three-way association, χ2(2) = 23.171, p < 0.001) and OMP−/− glomerular populations (Fig. 6E; three-way association, χ2(2) = 22.678, p < 0.001) when all three variables (exposure group, imaging session, and odorant selectivity) were included in the models. In the HCC group, there was no change in the selectivity of odor-responsive glomeruli (Fig. 6A,D,E, black bars) for mice of either genotype. Interestingly, there was a differential effect of SE and EE on glomerular response selectivity. In OMP−/+ mice, selectivity significantly decreased in odorant-responsive glomeruli in the SE group (Fig. 6B,D, blue bars; χ2 = 19.605, p < 0.001), whereas it significantly increased in odorant-responsive glomeruli in the EE group (Fig. 6C,D, red bars; χ2 = 4.224, p = 0.04). In OMP−/− mice, the SE group showed no significant change in selectivity (Fig. 6E; blue bars; χ2 = 2.576, p = 0.109), whereas the EE group showed a significant increase in selectivity (Fig. 6E, red bars; χ2 = 30.73, p < 0.001).
Discussion
These results indicate that the primary sensory inputs to the olfactory system of the brain exhibit robust experience-dependent plasticity in adult mice and that this plasticity can be specific to the environmental stimuli experienced. Such plasticity in primary sensory afferents is of broad importance for models of downstream sensory processing, which must interpret changing neural signals in response to the same physical stimulus. OSNs in OMP-null mice showed similar plasticity to OMP-heterozygous mice but seemingly without stimulus specificity, suggesting a potential role for this protein in adaptively reshaping OSN responses to different circumstances.
Interestingly, odorant exposure both sparsened the spatial representations of odorants (by reducing the number of glomeruli receiving synaptic input from OSNs) and reduced the magnitude of those inputs. The sparsening of representations is potentially valuable for increasing the number of separate representations that can be encoded and thus the ability of the system to recognize and discriminate among odorants (Willmore and Tolhurst, 2001; Perez-Orive et al., 2002). Such changes in coding may contribute to the improvement in odor discrimination observed after olfactory enrichment (Mandairon et al., 2006a,b). The selective sparsening of representations for the frequently encountered EE odorant and, to a lesser extent, the non-encountered ester odorant but not for the other unexposed odorants suggests an adaptive coding strategy, in which the codes representing common odorants in the local environment are somehow specialized or optimized. The smaller spH signals after odorant exposure indicates a reduction in total neurotransmitter release but does not provide enough temporal resolution to readily discriminate between a reduction in the overall rate of odorant-evoked exocytosis throughout the odorant presentation (smaller responses) and a more rapid adaptation of odorant-evoked responses during the odorant (briefer responses). If briefer, this result would be consistent with a refinement of the temporal aspects of the odorant representation, which has been observed previously in the olfactory system (Blumhagen et al., 2011) but never in primary sensory afferents or selectively in response to sensory experience.
In OMP-heterozygous mice, the effects of EE seemed confined to ester-responsive OSNs, with the largest effect on the population directly activated by the exposed ester. In contrast, in OMP-null mice, EE produced comparable plasticity in all the OSN populations tested. One might expect this pattern of results if the plasticity were a direct consequence of OSN stimulation because OSNs lacking OMP exhibit decreased odorant selectivity at baseline (Lee et al., 2011; Kass et al., 2013b; compare with pre-exposure data in Fig. 6D,E). Despite the reduced odorant selectivity in OMP-null mice, the populations of glomeruli stimulated by the ketone and aldehyde were very different from the population stimulated by the exposure ester (Fig. 5A). Therefore, the nonselective plasticity exhibited by OMP-null mice could not have been caused by nonselective stimulation with the exposure ester. Instead, we conclude that OMP somehow restricts the process of adaptive plasticity to the OSN populations that are stimulated by the exposure odorant.
The differential effects in OMP-null and OMP-heterozygous mice enable us to rule out certain technical explanations for these results. The reduction in evoked OSN activity cannot be a consequence of some global change in intranasal airflow induced by the EE (e.g., irritation or inflammation) because it was specific to ester-responsive glomeruli in OMP-heterozygous subjects. Similarly, the EE-induced plasticity does not result from fast adaptation of the olfactory transduction pathway (Boccaccio et al., 2006; Lecoq et al., 2009), which would be expected to yield effects only in ester-responsive OSN populations, because OSNs in OMP-null mice exhibited nonselective plasticity across three odor classes.
The reduction in the number of glomeruli receiving OSN synaptic input after EE reflects an increase in odorant selectivity, whereby the OSNs innervating some glomeruli ceased responding to one or more odorants in the panel. This is surprising because odorant selectivity is thought to be conferred by the selective expression of a single odorant receptor (Bozza et al., 2004) in all OSNs innervating a given glomerulus (Mombaerts, 2006). One possibility is that, at baseline, each glomerulus contained some mistargeted OSN projections expressing other receptors and that the exposure paradigm induced a pruning of these mistargeted projections, as observed during development (Zou et al., 2004; Kerr and Belluscio, 2006). It is also possible that the observed plasticity results from a refinement in receptor expression within individual OSNs (Tian and Ma, 2008) or from changes in pre-receptor enzymatic events (Nagashima and Touhara, 2010). Notably, the expression of OMP has also been shown to increase the odorant selectivity of OSNs (Lee et al., 2011; Kass et al., 2013b) through some unknown action seemingly downstream of the odor receptor but upstream of the cAMP signaling cascade (Reisert et al., 2007). However, the increase in odorant selectivity reported here was more pronounced in OMP-null mice than in OMP-heterozygous mice, suggesting that, although OMP clearly plays a role in determining which OSNs undergo plasticity, it is not itself conferring the increased odorant selectivity.
Although odorant exposure can alter the number and lifespan of OSNs, its effects are variable, sometimes increasing the likelihood of OSN survival (Watt et al., 2004) and other times causing a decrease (Cavallin et al., 2010) or even no change (Kerr and Belluscio, 2006) in the number of OSNs expressing the cognate receptor for the exposed odorant in the epithelium. In the present experiment, we cannot discriminate between changes in the response per OSN and a change in the number of OSNs targeting each glomerulus because we imaged odorant-evoked neurotransmitter release from the entire population of OSNs innervating each glomerulus. Nonetheless, these results demonstrate that the net effect of our chronic, intermittent odorant exposure paradigm across OSNs is a selective reduction in the overall input to the olfactory bulb from the subpopulations of OSNs that normally respond to the exposure odorant and related odorants.
Neurotransmitter release from OSN presynaptic terminals is strongly modulated by presynaptic inhibition arising from GABAergic and dopaminergic periglomerular circuitry (Nickell et al., 1994; Ennis et al., 2001; McGann et al., 2005; Murphy et al., 2005; McGann, 2013). This circuit includes both a population of uniglomerular, GABAergic interneurons that express glutamic acid decarboxylase-65 (GAD65) and a separate population of multiglomerular GABAergic and dopaminergic interneurons that jointly express the transmitter synthesis enzymes GAD67 and tyrosine hydroxylase (Kiyokage et al., 2010). In the latter population, the expression of both tyrosine hydroxylase and GAD67 is activity dependent and can be strongly downregulated when the activity of OSN afferents is suppressed in adult animals (Cho et al., 1996; Parrish-Aungst et al., 2011; Kass et al., 2013a). These GABAergic/dopaminergic interneurons also exhibit substantial activity-dependent turnover via adult neurogenesis (Sawada et al., 2011), which can play a role in olfactory perceptual learning (Bovetti et al., 2009; Moreno et al., 2009, 2012). However, the plasticity that we observed was odorant specific in ester-exposed OMP-expressing mice, which seems incompatible with a broad change in presynaptic inhibition across the many glomeruli innervated by joint GABAergic/dopaminergic interneurons (Kiyokage et al., 2010). Although we cannot rule out the possibility that the observed plasticity reflected changes in inhibition, the observation that the effects of exposure on OSN physiology is both odorant specific and dependent on OMP (which is selectively expressed in OSNs) suggests that the locus of the change is most likely within the OSNs themselves.
One unexpected result of this study was that SE, in which mice lived in a sham-odorized exposure chamber, produced an increase in the total number of odorant-responsive glomeruli and the size of their synaptic inputs from OSNs in OMP-heterozygous mice, which is in the opposite direction from the effect of EE (and also olfactory deprivation; Kass et al., 2013a) in these mice. It is perhaps surprising that simply exposing the mouse to more of its own odors would induce plasticity. However, previous studies have shown that simply changing a mouse's home cage can cause robust neuroanatomical changes (Oliva et al., 2010) to olfactory bulb glomeruli that are affected by exposure to naturally produced rodent cage odors (Oliva et al., 2008). Other laboratories have also reported notable changes in olfactory discrimination by simply enriching the olfactory environment with scent-containing mesh spheres (Mandairon et al., 2006a,b), suggesting that the sensory experience of a laboratory rodent may be so impoverished that modest environmental changes are sufficient to cause substantial alterations in neural function (Krech et al., 1962; Baroncelli et al., 2010). OMP-null mice did not show this enhancement in the SE group and in fact showed a decrease in odorant-responsive glomeruli and the size of their OSN synaptic inputs. However, naive OMP-null subjects exhibit a much larger number of odorant-evoked glomerular responses than naive mice heterozygous for OMP (Kass et al., 2013b), which suggests that a ceiling effect may have occurred in these mice.
Efficient coding models suggest that neural representations of the sensory world can be optimized by adapting their coding scheme to reflect the changing natural statistics of the animals' sensory world (Brenner et al., 2000; Simoncelli and Olshausen, 2001; Schwarzkopf et al., 2009). The present results indicate that such plasticity can occur as early as the primary sensory afferents in the olfactory system.
Footnotes
This work was supported by National Institute on Deafness and Other Communication Disorders Grant R00 DC009442 (J.P.M.) at the National Institutes of Health. We thank David Vicario, Lindsey Czarnecki, and the anonymous reviewers for their comments on this manuscript.
The authors declare no competing financial interests.
References
- Baroncelli L, Sale A, Viegi A, Maya Vetencourt JF, De Pasquale R, Baldini S, Maffei L. Experience-dependent reactivation of ocular dominance plasticity in the adult visual cortex. Exp Neurol. 2010;226:100–109. doi: 10.1016/j.expneurol.2010.08.009. [DOI] [PubMed] [Google Scholar]
- Blumhagen F, Zhu P, Shum J, Schärer YP, Yaksi E, Deisseroth K, Friedrich RW. Neuronal filtering of multiplexed odour representations. Nature. 2011;479:493–498. doi: 10.1038/nature10633. [DOI] [PubMed] [Google Scholar]
- Boccaccio A, Lagostena L, Hagen V, Menini A. Fast adaptation in mouse sensory neurons does not require the activity of phosphodiesterase. J Gen Physiol. 2006;128:171–184. doi: 10.1085/jgp.200609555. [DOI] [PMC free article] [PubMed] [Google Scholar]
- Bovetti S, Veyrac A, Peretto P, Fasolo A, De Marchis S. Olfactory enrichment influences adult neurogenesis modulating GAD67 and plasticity-related molecules expression in newborn cells of the olfactory bulb. PLoS One. 2009;4:e6359. doi: 10.1371/journal.pone.0006359. [DOI] [PMC free article] [PubMed] [Google Scholar]
- Bozza T, McGann JP, Mombaerts P, Wachowiak M. In vivo imaging of neuronal activity by targeted expression of a genetically encoded probe in the mouse. Neuron. 2004;42:9–21. doi: 10.1016/S0896-6273(04)00144-8. [DOI] [PubMed] [Google Scholar]
- Brenner N, Bialek W, de Ruyter van Steveninck R. Adaptive rescaling maximizes information transmission. Neuron. 2000;26:695–702. doi: 10.1016/S0896-6273(00)81205-2. [DOI] [PubMed] [Google Scholar]
- Cavallin MA, Powell K, Biju KC, Fadool DA. State-dependent sculpting of olfactory sensory neurons is attributed to sensory enrichment, odor deprivation, and aging. Neurosci Lett. 2010;483:90–95. doi: 10.1016/j.neulet.2010.07.059. [DOI] [PMC free article] [PubMed] [Google Scholar]
- Cho JY, Min N, Franzen L, Baker H. Rapid down-regulation of tyrosine hydroylase expression in the olfactory bulb of naris-occluded adult rats. J Comp Neurol. 1996;369:264–276. doi: 10.1002/(SICI)1096-9861(19960527)369:2<264::AID-CNE7>3.0.CO%3B2-1. [DOI] [PubMed] [Google Scholar]
- Cohen-Cory S. The developing synapse: construction and modulation of synaptic structures and circuits. Science. 2002;298:770–776. doi: 10.1126/science.1075510. [DOI] [PubMed] [Google Scholar]
- Czarnecki LA, Moberly AH, Rubinstein T, Turkel DJ, Pottackal J, McGann JP. In vivo visualization of olfactory pathophysiology induced by intranasal cadmium instillation in mice. Neurotoxicology. 2011;32:441–449. doi: 10.1016/j.neuro.2011.03.007. [DOI] [PMC free article] [PubMed] [Google Scholar]
- Czarnecki LA, Moberly AH, Turkel DJ, Rubinstein T, Pottackal J, Rosenthal MC, McCandlish EF, Buckley B, McGann JP. Functional rehabilitation of cadmium-induced neurotoxicity despite persistne peripheral pathophysiology in the olfactory system. Toxicol Sci. 2012;126:534–544. doi: 10.1093/toxsci/kfs030. [DOI] [PMC free article] [PubMed] [Google Scholar]
- Dahmen JC, King AJ. Learning to hear: plasticity of auditory cortical processing. Curr Opin Neurobiol. 2007;17:456–464. doi: 10.1016/j.conb.2007.07.004. [DOI] [PubMed] [Google Scholar]
- de Villers-Sidani E, Merzenich MM. Lifelong plasticity in the rat auditory cortex: basic mechanisms and role of sensory experience. Prog Brain Res. 2011;191:119–131. doi: 10.1016/B978-0-444-53752-2.00009-6. [DOI] [PubMed] [Google Scholar]
- Ennis M, Zhou FM, Ciombor KJ, Aroniadou-Anderjaska V, Hayar A, Borrelli E, Zimmer LA, Margolis F, Shipley MT. Dopamine D2 receptor-mediated presynaptic inhibition of olfactory nerve terminals. J Neurophysiol. 2001;86:2986–2997. doi: 10.1152/jn.2001.86.6.2986. [DOI] [PubMed] [Google Scholar]
- Gilbert CD, Li W, Piech V. Perceptual learning and adult cortical plasticity. J Physiol. 2009;587:2743–2751. doi: 10.1113/jphysiol.2009.171488. [DOI] [PMC free article] [PubMed] [Google Scholar]
- Goel A, Lee HK. Persistence of experience-induced homeostatic synaptic plasticity through adulthood in superficial layers of mouse visual cortex. J Neurosci. 2007;27:6692–6700. doi: 10.1523/JNEUROSCI.5038-06.2007. [DOI] [PMC free article] [PubMed] [Google Scholar]
- Hubel DH, Wiesel TN. The period of susceptibility to the physiological effects of unilateral eye closure in kittens. J Physiol. 1970;206:419–436. doi: 10.1113/jphysiol.1970.sp009022. [DOI] [PMC free article] [PubMed] [Google Scholar]
- Kaas JH. Plasticity of sensory and motor maps in adult mammals. Annu Rev Neurosci. 1991;14:137–167. doi: 10.1146/annurev.ne.14.030191.001033. [DOI] [PubMed] [Google Scholar]
- Karmarkar UR, Dan Y. Experience-dependent plasticity in adult visual cortex. Neuron. 2006;52:577–585. doi: 10.1016/j.neuron.2006.11.001. [DOI] [PubMed] [Google Scholar]
- Kass MD, Pottackal J, Turkel DJ, McGann JP. Changes in the neural representation of odorants after olfactory deprivation in the adult mouse olfactory bulb. Chem Senses. 2013a;38:77–89. doi: 10.1093/chemse/bjs081. [DOI] [PMC free article] [PubMed] [Google Scholar]
- Kass MD, Moberly AH, McGann JP. Spatiotemporal alterations in primary odorant representations in olfactory marker protein knockout mice. PLoS One. 2013b doi: 10.1371/journal.pone.0061431. in press. [DOI] [PMC free article] [PubMed] [Google Scholar]
- Katz LC, Shatz CJ. Synaptic activity and the construction of cortical circuits. Science. 1996;274:1133–1138. doi: 10.1126/science.274.5290.1133. [DOI] [PubMed] [Google Scholar]
- Kerr MA, Belluscio L. Olfactory experience accelerates glomerular refinement in the mammalian olfactory bulb. Nat Neurosci. 2006;9:484–486. doi: 10.1038/nn1673. [DOI] [PubMed] [Google Scholar]
- Kiyokage E, Pan YZ, Shao Z, Kobayashi K, Szabo G, Yanagawa Y, Obata K, Okano H, Toida K, Puche AC, Shipley MT. Molecular identity of periglomerular and short axon cells. J Neurosci. 2010;30:1185–1196. doi: 10.1523/JNEUROSCI.3497-09.2010. [DOI] [PMC free article] [PubMed] [Google Scholar]
- Krech D, Rosenzweig MR, Benett EL. Relations between chemistry and problem-solving among rats raised in enriched and impoverished environments. J Comp Physiol Psychol. 1962;55:801–807. doi: 10.1037/h0044220. [DOI] [PubMed] [Google Scholar]
- Lecoq J, Tiret P, Charpak S. Peripheral adaptation codes for high odor concentration in glomeruli. J Neurosci. 2009;29:3067–3072. doi: 10.1523/JNEUROSCI.6187-08.2009. [DOI] [PMC free article] [PubMed] [Google Scholar]
- Lee AC, He J, Ma M. Olfactory marker protein is critical for functional maturation of olfactory sensory neurons and development of mother preference. J Neurosci. 2011;31:2974–2982. doi: 10.1523/JNEUROSCI.5067-10.2011. [DOI] [PMC free article] [PubMed] [Google Scholar]
- Li W, Howard JD, Parrish TB, Gottfried JA. Aversive learning enhances perceptual and cortical discrimination of indiscriminable odor cues. Science. 2008;319:1842–1845. doi: 10.1126/science.1152837. [DOI] [PMC free article] [PubMed] [Google Scholar]
- Mandairon N, Stack C, Kiselycznyk C, Linster C. Enrichment to odors improves olfactory discrimination in adult rats. Behav Neurosci. 2006a;120:173–179. doi: 10.1037/0735-7044.120.1.173. [DOI] [PubMed] [Google Scholar]
- Mandairon N, Stack C, Linster C. Olfactory enrichment improves the recognition of individual components in mixtures. Physiol Behav. 2006b;89:379–384. doi: 10.1016/j.physbeh.2006.07.013. [DOI] [PubMed] [Google Scholar]
- McGann JP. Presynaptic inhibition of olfactory sensory neurons: new mechanisms and potential functions. Chem Senses. 2013 doi: 10.1093/chemse/bjt018. in press. [DOI] [PMC free article] [PubMed] [Google Scholar]
- McGann JP, Pírez N, Gainey MA, Muratore C, Elias AS, Wachowiak M. Odorant representations are modulated by intra- but not interglomerular presynaptic inhibition of olfactory sensory neurons. Neuron. 2005;48:1039–1053. doi: 10.1016/j.neuron.2005.10.031. [DOI] [PubMed] [Google Scholar]
- Mendez P, Bacci A. Assortment of GABAergic plasticity in the cortical interneuron melting pot. Neural Plast. 2011;2011:976856. doi: 10.1155/2011/976856. [DOI] [PMC free article] [PubMed] [Google Scholar]
- Moberly AH, Czarnecki LA, Pottackal J, Rubinstein T, Turkel DJ, Kass MD, McGann JP. Intranasal exposure to manganese disrupts neurotransmitter release from glutamatergic synapses in the central nervous system. Neurotoxicology. 2012;33:996–1004. doi: 10.1016/j.neuro.2012.04.014. [DOI] [PMC free article] [PubMed] [Google Scholar]
- Mombaerts P. Axonal wiring in the mouse olfactory system. Annu Rev Cell Dev Biol. 2006;22:713–737. doi: 10.1146/annurev.cellbio.21.012804.093915. [DOI] [PubMed] [Google Scholar]
- Moreno MM, Linster C, Escanilla O, Sacquet J, Didier A, Mandairon N. Olfactory perceptual learning requires adult neurogenesis. Proc Natl Acad Sci USA. 2009;106:17980–17985. doi: 10.1073/pnas.0907063106. [DOI] [PMC free article] [PubMed] [Google Scholar]
- Moreno MM, Bath K, Kuczewski N, Sacquet J, Didier A, Mandairon N. Action of the noradrenergic system on adult-born cells is required for olfactory perceptual learning. J Neurosci. 2012;32:3748–3758. doi: 10.1523/JNEUROSCI.6335-11.2012. [DOI] [PMC free article] [PubMed] [Google Scholar]
- Murphy GJ, Darcy DP, Isaacson JS. Intraglomerular inhibition: signaling mechanisms of an olfactory microcircuit. Nat Neurosci. 2005;8:354–364. doi: 10.1038/nn1403. [DOI] [PubMed] [Google Scholar]
- Nagashima A, Touhara K. Enzymatic conversion of odorants in nasal mucus affects olfactory glomerular activation patterns and odor perception. J Neurosci. 2010;30:16391–16398. doi: 10.1523/JNEUROSCI.2527-10.2010. [DOI] [PMC free article] [PubMed] [Google Scholar]
- Nickell WT, Behbehani MM, Shipley MT. Evidence for GABAB-mediated inhibition of transmission from the olfactory nerve to mitral cells in the rat olfactory bulb. Brain Res Bull. 1994;35:119–123. doi: 10.1016/0361-9230(94)90091-4. [DOI] [PubMed] [Google Scholar]
- Oliva AM, Jones KR, Restrepo D. Sensory-dependent asymmetry for a urine-responsive olfactory bulb glomerulus. J Comp Neurol. 2008;510:475–483. doi: 10.1002/cne.21800. [DOI] [PMC free article] [PubMed] [Google Scholar]
- Oliva AM, Salcedo E, Hellier JL, Ly X, Koka K, Tollin DJ, Restrepo D. Toward a mouse neuroethology in the laboratory environment. PLoS One. 2010;5:e11359. doi: 10.1371/journal.pone.0011359. [DOI] [PMC free article] [PubMed] [Google Scholar]
- Parrish-Aungst S, Kiyokage E, Szabo G, Yanagawa Y, Shipley MT, Puche AC. Sensory experience selectively regulates transmitter synthesis enzymes in interglomerular circuits. Brain Res. 2011;1382:70–76. doi: 10.1016/j.brainres.2011.01.068. [DOI] [PMC free article] [PubMed] [Google Scholar]
- Perez-Orive J, Mazor O, Turner GC, Cassenaer S, Wilson RI, Laurent G. Oscillations and sparsening of odor representations in the mushroom body. Science. 2002;297:359–365. doi: 10.1126/science.1070502. [DOI] [PubMed] [Google Scholar]
- Pienkowski M, Eggermont JJ. Cortical tonotopic map plasticity and behavior. Neurosci Biobehav Rev. 2011;35:2117–2128. doi: 10.1016/j.neubiorev.2011.02.002. [DOI] [PubMed] [Google Scholar]
- Reisert J, Yau KW, Margolis FL. Olfactory marker protein modulated the cAMP kinetics of the odour-induced response in cilia of mouse olfactory receptor neurons. J Physiol. 2007;585:731–740. doi: 10.1113/jphysiol.2007.142471. [DOI] [PMC free article] [PubMed] [Google Scholar]
- Sawada M, Kaneko N, Inada H, Wake H, Kato Y, Yanagawa Y, Kobayashi K, Nemoto T, Nabekura J, Sawamoto K. Sensory input regulates spatial and subtype-specific patterns of neuronal turnover in the adult olfactory system. J Neurosci. 2011;31:11587–11596. doi: 10.1523/JNEUROSCI.0614-11.2011. [DOI] [PMC free article] [PubMed] [Google Scholar]
- Schwarzkopf DS, Zhang J, Kourtzi Z. Flexible learning of natural statistics in the human brain. J Neurophysiol. 2009;102:1854–1867. doi: 10.1152/jn.00028.2009. [DOI] [PMC free article] [PubMed] [Google Scholar]
- Simoncelli EP, Olshausen BA. Natural image statistics and neural representation. Annu Rev Neurosci. 2001;24:1193–1216. doi: 10.1146/annurev.neuro.24.1.1193. [DOI] [PubMed] [Google Scholar]
- Soucy ER, Albeanu DF, Fantana AL, Murthy VN, Meister M. Precision and diversity in an odor map on the olfactory bulb. Nat Neurosci. 2009;12:210–220. doi: 10.1038/nn.2262. [DOI] [PubMed] [Google Scholar]
- Tian H, Ma M. Activity plays a role in eliminating olfactory sensory neurons expressing multiple odorant receptors in the mouse septal organ. Mol Cell Neurosci. 2008;38:484–488. doi: 10.1016/j.mcn.2008.04.006. [DOI] [PMC free article] [PubMed] [Google Scholar]
- Tian N, Copenhagen DR. Visual deprivation alters development of synaptic function in inner retina after eye opening. Neuron. 2001;32:439–449. doi: 10.1016/S0896-6273(01)00470-6. [DOI] [PubMed] [Google Scholar]
- Tyler WJ, Petzold GC, Pal SK, Murthy VN. Experience-dependent modification of primary sensory synapses in the mammalian olfactory bulb. J Neurosci. 2007;27:9427–9438. doi: 10.1523/JNEUROSCI.0664-07.2007. [DOI] [PMC free article] [PubMed] [Google Scholar]
- Watt WC, Sakano H, Lee ZY, Reusch JE, Trinh K, Storm DR. Odorant stimulation enhances survival of olfactory sensory neurons via MAPK and CREB. Neuron. 2004;41:955–967. doi: 10.1016/S0896-6273(04)00075-3. [DOI] [PubMed] [Google Scholar]
- Weinberger NM. Specific long-term memory traces in primary auditory cortex. Nat Rev Neurosci. 2004;5:279–290. doi: 10.1038/nrn1366. [DOI] [PMC free article] [PubMed] [Google Scholar]
- Wilbrecht L, Holtmaat A, Wright N, Fox K, Svoboda K. Structural plasticity underlies experience-dependent functional plasticity of cortical circuits. J Neurosci. 2010;30:4927–4932. doi: 10.1523/JNEUROSCI.6403-09.2010. [DOI] [PMC free article] [PubMed] [Google Scholar]
- Willmore B, Tolhurst DJ. Characterizing the sparseness of neural codes. Network. 2001;12:255–270. doi: 10.1080/713663277. [DOI] [PubMed] [Google Scholar]
- Zou DJ, Feinstein P, Rivers AL, Mathews GA, Kim A, Greer CA, Mombaerts P, Firestein S. Postnatal refinement of peripheral olfactory projections. Science. 2004;304:1976–1979. doi: 10.1126/science.1093468. [DOI] [PubMed] [Google Scholar]