

Abstract
Objective
Previous data indicate a rapidly increasing prevalence of obesity and overweight among English children and an emerging socioeconomic gradient in prevalence. The main aim of this study was to update prevalence trends among school-age children and assess the changing socioeconomic gradient.
Design
A series of nationally representative household-based health surveys conducted between 1997 and 2007 in England.
Subjects
15,271 white children (7880 boys) aged 5 to 10 years with measured height and weight.
Measurements
Height and weight were directly measured by trained fieldworkers. Overweight (including obesity) and obesity prevalence were calculated using the international body mass index cut-offs. Socioeconomic position (SEP) score was a composite score based on income and social class. Multiple linear regression assessed the prevalence odds with time point (1997/8, 2000/1, 2002/3, 2004/5, 2006/7) as the main exposure. Linear interaction terms of time by SEP were also tested for.
Results
There are signs that the overweight and obesity trend has levelled off from 2002/3 to 2006/7. The odds ratio (OR) for overweight in 2006/7 compared to 2002/3 was 0.99 (95% CI 0.88 to 1.11) and for obesity OR = 1.06 (0.86 to 1.29). The socioeconomic gradient has increased in recent years, particularly 2006/7. Compared to 1997/8, the 2006/7 age and sex-adjusted OR for overweight was 1.88 (1.52 to 2.33) in low SEP, 1.25 (1.04 to 1.50) in middle SEP, and 1.13 (0.86 to 1.48) in high SEP children.
Conclusion
Childhood obesity and overweight prevalence among school-age children in England has stabilised in recent years, but children from lower socio-economic strata have not benefited from this trend. There is an urgent need to reduce socio-economic disparities in childhood overweight and obesity.
Keywords: Obesity, overweight, children, trends, England, socioeconomic status, socioeconomic position, income
Introduction
Over the last few decades there has been a worldwide increase in paediatric obesity affecting both developed and developing countries.1,2 Excess adiposity at a young age is linked to immediate and long-term health risks, including increased risk for asthma3 and type II diabetes,4 and because of the persistence of the condition into adulthood,5,6 increased middle-age mortality and morbidity regardless of adult weight status.7,8,9 Socioeconomic position (SEP) is linked to adiposity but the relationship is complex and varies by age, population, sex, ethnicity,10,11 and the type of adiposity indicator.11 A recent review of cross-sectional studies published between 1990 and 200511 found that SEP was inversely associated with children’s overweight or obesity in 42% of the reviewed studies, with another 31% reporting a mixture of inverse and no associations. The choice of SEP indicator clearly influenced these relationships and parental education showed the most consistent inverse relationship with children’s obesity risk. The evidence using income or social class is less conclusive and studies using composite SEP indices are few and far between.11 This contrasts with public health and epidemiological research recommendations12,13 which have emphasised the value of using area-level SEP indicators in health research. The importance of taking into account multiple SEP indicators has also been emphasised14,15 because studies concentrating on a single SEP indicator fail to fully describe the relationships with excess adiposity or its proxies (e.g. BMI). This idea is supported by the aforementioned review11 which found that studies using multiple SEP indicators or composite indices were more likely to show inverse relationships.
We have previously documented16 a trend of expanding social disparities in children’s overweight and obesity prevalence in England between 1973 and 2003, with children from less advantaged socioeconomic backgrounds (lower income and manual occupation households) showing disproportionately higher increases in prevalence than children in households with higher income or non-manual backgrounds. We do not know whether this trend, which covered a relatively short period of time (1997-2003) and was of borderline statistical importance,16 has continued in recent years. A better understanding of the relationship between SEP and children’s obesity and the dynamics of this relationship over time will inform public health policies to tackle paediatric obesity and social inequalities in health.
The main objectives of this work were: a) to update the most recent overweight and obesity prevalence trends among school-age children in England using identical methodology to previously published long-term trends,16 and b) to examine the changes over time in the relationship between obesity and multiple SEP indicators.
Subjects & Methods
The Health Survey for England (HSfE)17,18 consists of annual nationally representative random samples of the free-living general population, drawn using multi-stage stratified probability sampling, with postcode sectors as primary sampling units and the Postcode Address File as the household sampling frame. Up to two children aged 2-15 from each household were recruited. In this study we used data from the 1997 to 2007 surveys omitting 1999. Individual response rates for children ranged between 85% in 1997 to 66% in 2007. The samples had relatively few non-white children, so we included only white children in the analyses. Ethical approval had been granted by the London Medical Research Ethics Committee or local Research Ethics Committees prior to each annual data collection cycle.
Anthropometric measures
HSfE measuring methodologies and instrumentation were identical across time and have been described in detail previously. 16,18 In brief, height was measured using Harpenden stadiometers (Chasmors Ltd., London, UK) and weight was measured using electronic digital scales (Tanita Corporation, Japan). For comparability with the previous prevalence estimates, 16 weight was adjusted for children’s clothing using the same method as before.16,19 Exact age was used to calculate prevalence rates, but was grouped to 5-7 and 8-10 years for presentation of the results.
Socioeconomic measures
Household income was converted to equivalised annual household income adjusted for the number of persons in the household using the McClements scoring system.17,18 To examine whether socioeconomic position has a cumulative effect on obesity prevalence over time we developed an aggregate SEP score, based on the family’s position on income (quintiles) and social class scales (I, II, III-manual, III-nonmanual, IV, V). The Registrar-General’s social class is based on occupation of the head of the household.20 For each indicator, children were assigned between zero (lowest income quintile, social class V) and four (highest income quintile) or five (social class I) points. The resulting score ranged from zero (lowest SEP) to nine (highest SEP). We grouped SEP score to low (0-3), medium (4-6) and high (7-9) to give similar size groups. Similar composite scores of socioeconomic position score have been used previously by us21 and others.22
Data handing and statistical analyses
Overweight (including obesity) and obesity rates were computed using age-sex-specific international BMI cut-offs23 corresponding to adult BMI cutoffs of 25 and 30 kg/m2 at age 18. We computed the year-on-year prevalence of overweight and obesity between 1997 and 2007. HSfE years were also merged in pairs (1997/8; 2000/01; 2002/3; 2004/5; 2006/7) to increase statistical power. The baseline year was 1997 as household income data were not available before then. We compared rates for the surveys from 2004 to 2007 with the published16 2002/3 rates using likelihood ratio tests. The prevalence trends 1997-2007 were tested using multiple logistic regression with obesity or overweight the binary outcome, time point the exposure (reference: 2002/3), and social class, income, sex and age group as covariables.
We tested for, but failed to find, interactions of time point by sex and by age group (5-7 and 8-10 years) and second-order interactions between time point, sex and age group. Hence the remaining multivariable analyses were age group and sex-adjusted but not stratified by age and sex. The change over time in the relationship between prevalence and SEP was tested by: a) fitting linear interactions between socioeconomic indicators (income and SEP score) and time point, b) comparing the prevalence between SEP groups at each time point, and c) calculating the adjusted odds for overweight and obesity by SEP group at each time point using multiple logistic regression.
Results
Sample sizes and missing values
There were 19,203 children aged 5 to 10 years (9718 boys) in the included HSfE years. Following exclusions of 2582 non-White children and another 1350 with invalid BMI (missing height or weight information, or both the core dataset comprised 15,271 children (7880 boys). Due to 1622 missing values on income or parental social class, SEP analyses included 13,649 cases (6902 boys). Table 1 summarises the characteristics of the sample by two-year time point.
Table 1. Descriptive characteristics of school aged children (5-10 yrs) participating in the Health Survey for England between 1997 and 2007.
| Mean(SD)or % | |||||
|---|---|---|---|---|---|
| 1997/8 | 2000/1 | 2002/3 | 2004/5 | 2006/7 | |
| N (core) | 4147 | 1863 | 3579 | 1323 | 4359 |
| N (SEP analyses) | 3919 | 1640 | 3229 | 1164 | 3697 |
| Mean Age | |||||
| Boys | 7.5 (1.7) | 7.5 (1.7) | 7.5 (1.7) | 7.6 (1.7) | 7.6 (1.7) |
| Girls | 7.5 (1.7) | 7.5 (1.7) | 7.5 (1.7) | 7.5 (1.8) | 7.6 (1.7) |
| Age group (%) | |||||
| 5-7 years | 50 | 50 | 50 | 50 | 48 |
| 8-10 years | 50 | 50 | 50 | 50 | 52 |
| Mean BMI | |||||
| Boys | 16.7 (2.2) | 17.0 (2.4) | 17.0 (2.5) | 17.2 (2.7) | 17.1 (2.6) |
| Girls | 16.9 (2.4) | 17.1 (2.7) | 17.3 (2.8) | 17.3 (2.9) | 17.2 (2.7) |
| Household income (GB Pounds) | 16,010 (14,458) | 20,826 (18,048) | 22,546 (19,636) | 23,633 (20,007) | 25,560 (21,384) |
| Social class (% manual households) | 52 | 46 | 44 | 42 | 40 |
| Missing BMI data, % (N )* | 2.0 (85) | 10.5 (218) | 8.0 (311) | 13.9 (213) | 10.7 (523) |
| Missing social class data , % (N ) | 3.3 (138) | 4.3 (80) | 3.4 (122) | 3.8 (50) | 3.5 (153) |
| Missing household income data , % (N ) | 2.3 (92) | 8.4 (156) | 6.7 (241) | 8.6 (114) | 12.3 (538) |
Omitted from all analyses
Overall prevalence trend
Figure 1 shows the trends in overweight and obesity prevalence from 1997 to 2007, with both levelling off after 2002. Table 2 presents the overweight and obesity prevalence between 2002/3 and 2006/7 by age and sex. With the exception of obesity in boys aged 5-7, neither overweight nor obesity prevalence changed noticeably during the period.
Figure 1. Prevalence of overweight (incl. obesity) and obesity between 1997 and 2007 for boys and girls aged 5-10.

The Health Survey for England 1997-2007.
Table 2. Overweight and obesity prevalence (95% confidence intervals), for boys and girls aged 5-10 between 2002/3 and 2006/7.
| 2002/3 | 2004/5 | 2006/7 | Trend p | |
|---|---|---|---|---|
| Boys aged 5-7 yrs | ||||
| N | 839 | 325 | 1066 | |
| % Overweight | 13.7 (11.4,16.0) | 15.4 (11.5, 19.3) | 15.8 (13.7, 17.9) | 0.2 |
| % Obese | 4.1 (2.7, 5.4) | 5.8 (3.3, 8.4) | 5.8 (4.4, 7.2) | 0.08 |
| Boys aged 8-10 yrs | ||||
| N | 951 | 359 | 1144 | |
| % Overweight | 18.8 (16.3, 21.3) | 20.6 (16.4, 24.8) | 19.8 (17.5, 22.1) | 0.8 |
| % Obese | 5.2 (3.7, 6.6) | 4.5 (2.3, 6.6) | 5.6 (4.2, 6.9) | 0.9 |
| Boys total | ||||
| N | 1790 | 684 | 2210 | |
| % Overweight | 16.4 ( 14.7, 18.1) | 18.1 (15.2, 21.0) | 17.9 (16.2, 19.5) | 0.4 |
| % Obese | 4.6 ( 3.7, 5.6) | 5.1 (3.5, 6.8) | 5.7 (4.7, 6.7) | 0.3 |
| Girls aged 5-7 yrs | ||||
| N | 809 | 324 | 996 | |
| % Overweight | 20.5 ( 17.7, 23.3) | 21.9 (17.4, 26.4) | 19.4 (16.7, 21.9) | 0.7 |
| % Obese | 6.6 (4.8, 8.3) | 8.3 (5.3, 11.3) | 5.8 (4.3, 7.2) | 0.5 |
| Girls aged 8-10 yrs | ||||
| N | 893 | 315 | 1153 | |
| % Overweight | 25.8 (22.9, 28.6) | 24.1 (19.4, 28.85) | 23.9 (21.5, 26.4) | 0.5 |
| % Obese | 7.1 (5.4, 8.7) | 6.3 (3.7, 9.0) | 6.3 (4.9, 7.8) | 0.6 |
| Girls total | ||||
| N | 1702 | 639 | 2149 | |
| % Overweight | 23.3 ( 21.3, 25.3) | 23.0 (19.8, 26.3) | 21.8 (20.1, 23.6) | 0.2 |
| % Obese | 6.8 ( 5.6, 8.0) | 7.4 (5.3, 9.4) | 6.1 (5.1, 7.1) | 0.4 |
Table 3 confirms this: the multivariable-adjusted odds for being overweight (0.99, 95% CI 0.88 to 1.11) or obese (1.06, 0.86 to 1.29) in 2006/7 were not significantly different from 2002/03.
Table 3. Multivariable-adjustedJ odds ratios and 95% confidence intervals for overweight and obesity prevalence among White children aged 5 to 10 yrs living in England.
The Health Survey for England.
| O.R. | 95% C.I. | |
|---|---|---|
| Overweight (incl. obesity) | (p<0.001) | |
| 1997/8 | 0.69 | 0.61, 0.79 |
| 2000/1 | 0.92 | 0.79, 1.07 |
| 2002/3 | 1 | |
| 2004/5 | 1.09 | 0.92, 1.29 |
| 2006/7 | 0.99 | 0.88, 1.11 |
| Obesity | (p<0.001) | |
| 1997/8 | 0.63 | 0.50, 0.79 |
| 2000/1 | 0.85 | 0.65, 1.11 |
| 2002/3 | 1 | |
| 2004/5 | 1.19 | 0.90, 1.56 |
| 2006/7 | 1.06 | 0.86, 1.29 |
Adjusted for age, sex, social class, and income
Socioeconomic differences in the trends
Overweight and obesity prevalence by income and SEP score at each time point are shown in Figures 2 and 3 respectively, where disparities tended to increase over time. In Figure 2, the gradient in prevalence between high and low income groups was significant for overweight in boys (p=.04) and girls (p=.003) in 2006/7, and for obesity in girls in 2002/3 (p=.001), 2004/5 (p=.005) and 2006/7 (p=.04). The SEP score gradient in Figure 3 also increased over time, reaching significance in 2006/7 for boys’ overweight (p<.001) and obesity (p=.002), when obesity prevalence in the low SEP score group was twice that in the higher groups. Similar gradients in girls’ obesity prevalence were seen in 2002/3 (p<.001), 2004/5 (p=.03) and 2006/7 (p=.03).
Figure 2. Prevalence trends in income inequalities of overweight and obese children aged 5-10 in England 1997-2007.

A) & B) Boys, C) & D) Girls
Figure 3. Prevalence trends in socioeconomic position score (SEP score, a composite index taking into account income and social class) inequalities of overweight and obese children aged 5-10 in England 1997-2007.

A) & B) Boys, C) & D) Girls
There was a strong interaction between SEP score and time point for both overweight (p=0.002) and obesity (p=0.02). Figure 4 shows the sex and age-adjusted odds of overweight and obesity by SEP score group and time point relative to 1997/8, and only the low SEP score group showed rising trends over time.
Figure 4. Age and sex-adjusted odds for overweight and obesity between 2000/01 and 2006/07 (compared with the 1997/98 referent time point) by socioeconomic position score group.
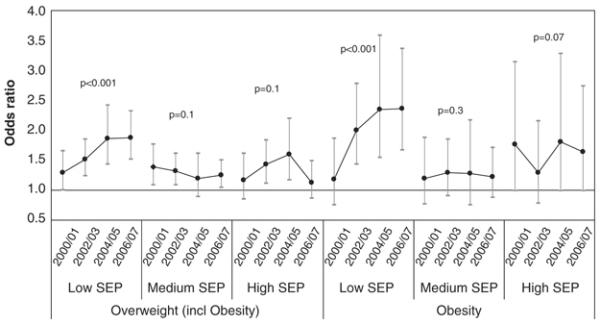
Children aged 5-10 participating in the Health Survey for England.
Discussion
Using nationally representative data we have examined the 10 year time trends of overweight and obesity prevalence in children by socioeconomic position. Our findings suggest that despite stabilization of the overall prevalence between 2004 and 2007, social disparities continue to grow at the expense of children in lower socioeconomic position groups.
The results are in agreement with studies from other counties showing that, at least in the developed world, the paediatric obesity epidemic has been slowing in recent years. Recent trends in overweight or obesity prevalence have stabilised or reversed in France (3-1424 and 7-925 years), Switzerland (6-13 years),26 and Sweden (girls 10-11 years).27 In the US the prevalence of high BMI for age among children or adolescents has not changed significantly between 2003-2004 and 2005-2006 or between 1999 and 2006.28 There are several possible explanations for this finding. At the individual and family level it may relate to the extensive media attention that issues around obesity have received in recent years29 and a subsequent rise in body weight awareness and health consciousness. At the policy level it could be due to anti-obesity policies and policy targets, such as the English government’s 2004 Public Service Agreement setting a target to halt the year-on-year increase of obesity in children under 1130 and the French National Nutrition and Health Programme.31 However, no formal evaluations of such interventions exist and we can only speculate as to the likely reasons.
Evidence on the time trends of the socioeconomic disparities in prevalence is less clear. A major US study10 concluded that income-based socioeconomic disparities in childhood overweight weakened between 1971-1975 and 1999-2002. We cannot directly compare these results with ours due to the differing time periods, but Wang and Zhang’s conclusion10 is not supported by their own data for boys age 2-9 where a strong income gradient was present only for the most recent time point 1999-2002 (low SEP: 17.4%, middle SEP: 15.0%, high SEP: 9.7%, p<0.05). In contrast, a French study24 concluded that social disparities in overweight for children aged 3-14 did not increase during 1999-2007, a time period similar to ours. Our own socioeconomic gradient became stronger in 2004/5 and 2006/7 for boys’ overweight and obesity and girls’ overweight, and this was more pronounced for SEP score (Figures 3 and 4) than for income (Figure 2), supporting previous suggestions that social disparities in health12,13,14 or specifically paediatric obesity15 are best described using multi-domain or composite SEP indicators.
Although previous HSfE data suggest that lower SEP children are less likely than middle and high SEP children to have a healthy diet18,32 or to exercise or take part in sports,18,32 our data do not discriminate between possible explanations for the growing social disparities over time that we document. If we assume that health policy interventions and family/individual health awareness are responsible for the stabilization of the prevalence trend in less deprived children, the expansion of socio-economic disparities may be partly due to difficulties to reach and communicate health messages to families from lower socioeconomic groups. Previous research shows higher socioeconomic groups tend to follow recommendations for health behaviours33 and respond more actively to health-related media messages34 than lower socioeconomic groups. It is possible that the recent exponential increase in obesity and obesity-related (diet and physical activity) media messages29 has been received more positively by non-manual than by manual families. Since lower socioeconomic groups tend to be wary of measures and messages aimed at changing their lifestyle because they see them as “nanny-statism” that erodes their autonomy,35 it is possible that policies targeting children’s eating and physical activity habits have been perceived less favourably by lower income and social class groups.
The main strengths of our study are the objective weight and height measuring methodology that remained the same across survey years, the consistent across time sampling methodology, the nationally representative and relatively large samples of children, and the availability of more than one SEP indicator. On the other hand, we acknowledge that our study also had several limitations. The US study by Wang and Zhang10 showed that there are important interactions between ethnicity and SEP, but our analyses did not include children from minority ethnic groups due to their small numbers. The decline in response rates in recent years may have introduced respondent bias as individuals (and presumably families) from lower SEP groups are more likely to be both non-responders in survey research36,37 and obese or overweight.38 Further response bias may have been introduced by the considerably higher percentages of BMI missing data in the 2000s (8-14%) compared with 1997/98 (2%). Refusal to co-operate with weight measurements, which was one of the main reasons for missing BMI data, increased from 1.0% in 1997/8 to 3.0% in 2002/3 and 3.7% in 2006/7. If families who rejected participation in the survey and children who refused to do the weight measurement were more likely to be obese, the obesity rates we reported may be an under-estimate of actual prevalence in the most recent years.
Conclusions
The previously documented rapid upward trends in obesity and overweight among primary school age children have levelled off between 2002 and 2007. Over the same time period socioeconomic disparities have widened. Our results support the need for urgent action to tackle socioeconomic inequalities in children’s health.
Acknowledgments
The Health Survey for England is funded by the English Department of Health and the Health and Social Care Information Centre. This work was not supported by any specific source of funding. We would like to thank the families and children who participated in the Health Survey for England.
References
- 1.Lobstein T. Obesity in children and young people: a crisis in public health. Obesity Reviews. 2004;5(s1):4–85. doi: 10.1111/j.1467-789X.2004.00133.x. [DOI] [PubMed] [Google Scholar]
- 2.Popkin BM, Conde W, Hou N, Monteiro C. Is There a Lag Globally in Overweight Trends for Children Compared with Adults? Obesity. 2006;14(10):1846–1853. doi: 10.1038/oby.2006.213. [DOI] [PubMed] [Google Scholar]
- 3.Von Mutius E, Schwartz J, Neas LM, et al. Relation of body mass index to asthma and atopy in children: the National Health and Nutrition Examination Study III. Thorax. 2001;56:835–838. doi: 10.1136/thorax.56.11.835. [DOI] [PMC free article] [PubMed] [Google Scholar]
- 4.Fagot-Campagna A, Pettitt DJ, Engelgau MM, et al. Type 2 diabetes among North American children and adolescents: An epidemiologic review and a public health perspective. J Pediatr. 2000;136:664–672. doi: 10.1067/mpd.2000.105141. [DOI] [PubMed] [Google Scholar]
- 5.Kvaavik E, Tell GS, Klepp KI. Predictors and tracking of body mass index from adolescence into adulthood. Follow-up of 18 to 20 years in the Oslo Youth Study. Arch Pediatr Adolesc Med. 2003;157:1212–1218. doi: 10.1001/archpedi.157.12.1212. [DOI] [PubMed] [Google Scholar]
- 6.Guo SS, Chumlea W. Tracking of Body Mass Index in Children in Relation to Overweight in Adulthood. Am J Clin Nutr. 1999;70(1):145S–148S. doi: 10.1093/ajcn/70.1.145s. [DOI] [PubMed] [Google Scholar]
- 7.Gunnell D, Frankel S, Nanchahal K, et al. Childhood obesity and adult cardiovascular mortality: a 57-y follow-up study based on the Boyd Orr cohort. Am J Clin Nutr. 1998;67:1111–1118. doi: 10.1093/ajcn/67.6.1111. [DOI] [PubMed] [Google Scholar]
- 8.Must A, Jacques PF, Dallal GE, et al. Long-term morbidity and mortality of overweight adolescents - a follow-up of the Harvard growth study of 1922 to 1935. N Engl J Med. 1992;327:1350–1355. doi: 10.1056/NEJM199211053271904. [DOI] [PubMed] [Google Scholar]
- 9.Engeland A, Bjorge T, Sogaard AJ, et al. Body mass index in adolescence in relation to total mortality: 32-year follow-up of 227,000 Norwegian boys and girls. Am J Epidemiol. 2003;157:517–523. doi: 10.1093/aje/kwf219. [DOI] [PubMed] [Google Scholar]
- 10.Wang Y, Zhang Q. Are American children and adolescents of low socioeconomic status at increased risk of obesity? Changes in the association between overweight and family income between 1971 and 2002. Am J Clin Nutr. 2006;84(4):707–716. doi: 10.1093/ajcn/84.4.707. [DOI] [PubMed] [Google Scholar]
- 11.Shrewsbury V, Wardle J. Socioeconomic status and adiposity in childhood: A systematic review of cross-sectional studies 1990-2005. Obesity. 2008;16(2):275–284. doi: 10.1038/oby.2007.35. [DOI] [PubMed] [Google Scholar]
- 12.Liberatos P, Link BG, Kelsey JL. The measurement of social class in epidemiology. Epidemiol Rev. 1988;10:87–121. doi: 10.1093/oxfordjournals.epirev.a036030. [DOI] [PubMed] [Google Scholar]
- 13.Krieger N, Williams DR, Moss NE. Measuring social class in US public health research: concepts, methodologies, and guidelines. Annu Rev Public Health. 1997;18:341–378. doi: 10.1146/annurev.publhealth.18.1.341. [DOI] [PubMed] [Google Scholar]
- 14.Braveman PA, Cubbin C, Egerter S, et al. Socioeconomic status in health research: one size does not fit all. JAMA. 2005;294:2879–2888. doi: 10.1001/jama.294.22.2879. [DOI] [PubMed] [Google Scholar]
- 15.Wardle J, Waller J, Jarvis MJ. Sex differences in the association of socioeconomic status with obesity. American Journal of Public Health. 2002;92(8):1299–1304. doi: 10.2105/ajph.92.8.1299. [DOI] [PMC free article] [PubMed] [Google Scholar]
- 16.Stamatakis E, Primatesta P, Chinn S, Rona R, Falascheti E. Overweight and obesity trends from 1974 to 2003 in English children: what is the role of socioeconomic factors? Arch Dis Child. 2005;90(10):999–1004. doi: 10.1136/adc.2004.068932. [DOI] [PMC free article] [PubMed] [Google Scholar]
- 17.Prescott-Clarke P, Primatesta P, editors. Health Survey for England 1995. HMSO; London: 1997. [Google Scholar]
- 18.Craig R, Mindell J, editors. The Health Survey for England 2006: CVD and risk factors adults, obesity and risk factors children. Information Centre; Leeds: [Accessed 18th February 2009]. 2008. http://www.ic.nhs.uk/pubs/HSE06CVDandriskfactors. [Google Scholar]
- 19.Cameron N. The growth of London schoolchildren 1904-1966: An analysis of secular trend and intra-county variation. Ann Hum Biol. 1979;6:505–525. doi: 10.1080/03014467900003921. [DOI] [PubMed] [Google Scholar]
- 20.Szreter SRS. The genesis of the Registrar-General’s Social Classification of Occupations. Br J Sociol. 1984;35:522–46. [Google Scholar]
- 21.Stamatakis E, Hillsdon M, Mishra G, Hamer M, Marmot M. Television viewing and other screen-based entertainment in relation to multiple socioeconomic status indicators and area deprivation: The Scottish Health Survey 2003. J Epidemiol Community Health. doi: 10.1136/jech.2008.085902. In Press. [DOI] [PubMed] [Google Scholar]
- 22.Hillsdon M, Lawlor DA, Ebrahim S, Morris JN. Physical activity in older women: associations with area deprivation and with socioeconomic position over the life course: observations in the British Women’s Heart and Health Study. J Epidemiol Community Health. 2008;62(4):344–350. doi: 10.1136/jech.2006.058610. [DOI] [PubMed] [Google Scholar]
- 23.Cole T, Bellizzi M, Flegal K, et al. Establishing a standard definition for child overweight and obesity worldwide: an international survey. BMJ. 2000;320:1–6. doi: 10.1136/bmj.320.7244.1240. [DOI] [PMC free article] [PubMed] [Google Scholar]
- 24.Lioret S, Touvier M, Dubuisson C, et al. Trends in Child Overweight Rates and Energy Intake in France From 1999 to 2007: Relationships With Socioeconomic Status. Obesity. 2009;17:1092–100. doi: 10.1038/oby.2008.619. [DOI] [PubMed] [Google Scholar]
- 25.Péneau S, Salanave B, Rolland-Cachera MF, Castetbon K, Hercberg S. The prevalence of overweight and obesity in 7-9 year old children in France is stable between 2000 and 2007. Int J Obes. 2008;32:S196. [Google Scholar]
- 26.Aeberli I, 1, Amman RS, Knabenhans M, Zimmermann MB. The national prevalence of overweight in school-age children in Switzerland has decreased between 2002 and 2007. Int J Obes. 2008;32:S214. [Google Scholar]
- 27.Sjöberg A, Albertsson-Wikland LLK, Mårild S. Recent anthropometric trends among Swedish school children: evidence for decreasing prevalence of overweight in girls. Acta Pædiatrica. 2008;97(1):118–123. doi: 10.1111/j.1651-2227.2007.00613.x. [DOI] [PubMed] [Google Scholar]
- 28.Ogden CL, Carroll MD, Flegal KM. High Body Mass Index for Age Among US Children and Adolescents, 2003-2006. JAMA. 2008;299(20):2401–2405. doi: 10.1001/jama.299.20.2401. [DOI] [PubMed] [Google Scholar]
- 29.International Food Information Council Foundation [Accessed 27th February 2009];Trends in Obesity-related media coverage. Available online: http://www.ific.org/research/obesitytrends.cfm.
- 30.Department of Health . Spending Review 2004 Public Service Agreement. Department of Health; London: [Accessed 27th February 2009]. 2007. http://www.dh.gov.uk/en/Aboutus/HowDHworks/Servicestandardsandcommitments/DHPublicServiceAgreement/DH_4106188. [Google Scholar]
- 31.Hercberg S, Chat-Yung S, Chauliac M. The French National Nutrition and Health Program: 2001-2006-2010. Int J Public Health. 2008;53:68–77. doi: 10.1007/s00038-008-7016-2. [DOI] [PubMed] [Google Scholar]
- 32.Prescott-Clarke P, Primatesta P, editors. Health Survey for England. The Health of Young People ‘95-‘97. HMSO; London: 1998. [Google Scholar]
- 33.Adler NE, Boyce T, Chesney MA, Cohen S, Folkman S, Kahn RL, Syme SL. Socioeconomic-status and health—the challenge of the gradient. Am Psychol. 1994;49:15–24. doi: 10.1037//0003-066x.49.1.15. [DOI] [PubMed] [Google Scholar]
- 34.Iversen AC, Kraft P. Does socio-economic status and health consciousness influence how women respond to health related messages in media? Health Educ Res. 2006;21(5):601–610. doi: 10.1093/her/cyl014. [DOI] [PubMed] [Google Scholar]
- 35.King’s Fund & Health Development Agency . Public attitudes to public health policy. King’s Fund; London: 2004. [Google Scholar]
- 36.Turrell G, Patterson C, Oldenburg B, Gould T, Roy M-A. The socio-economic patterning of survey participation and non-response error in a multi-level study of food purchasing behaviour: area- and individual-level characteristics. Public Health Nutr. 2003;6:181–189. doi: 10.1079/PHN2002415. [DOI] [PubMed] [Google Scholar]
- 37.Colhoun H, Clarke P, editors. The Health Survey for England 1994. Volume II: Survey Methodology and Documentation. The Stationery Office; London: 1996. [Google Scholar]
- 38.Sobal J, Stunkard AJ. Socioeconomic status and obesity - a review of the literature. Psychol Bull. 1989;105:260–275. doi: 10.1037/0033-2909.105.2.260. [DOI] [PubMed] [Google Scholar]