

Abstract
Elastin is an intriguing extracellular matrix protein present in all connective tissues of vertebrates, rendering essential elasticity to connective tissues subjected to repeated physiological stresses. Using piezoresponse force microscopy, we show that the polarity of aortic elastin is switchable by an electrical field, which may be associated with the recently discovered biological ferroelectricity in the aorta. More interestingly, it is discovered that the switching in aortic elastin is largely suppressed by glucose treatment, which appears to freeze the internal asymmetric polar structures of elastin, making it much harder to switch, or suppressing the switching completely. Such loss of ferroelectricity could have important physiological and pathological implications from aging to arteriosclerosis that are closely related to glycation of elastin.
Elastin is an intriguing extracellular matrix protein present in all connective tissues of vertebrates [1], rendering essential elasticity to the aorta, lung, ligament, and skin subjected to repeated physiological stresses [2]. Long thought to be purely structural, compelling evidence has also emerged on its physiological significance, for example, in vascular morphogenesis [3,4] and homeostasis [5]. Glycation of elastin naturally occurs during aging and is accelerated by elevated sugar level. It degrades the structure and function of elastin [6] and is connected to aging [7] and a number of diseases such as diabetic macro-angiopathy, arteriosclerosis, and hypertension [6,8,9]. Using piezoresponse force microscopy (PFM) [10,11], we show that elastin is switchable by an electrical field, which may be associated with the recently discovered biological ferroelectricity in the aorta [12] and points to possibly a much wider occurrence of ferroelectricity in biology. It is also discovered that switching in aortic elastin is largely suppressed by glucose treatment, and such loss of ferroelectricity could have important physiological and pathological implications.
Electromechanical coupling is ubiquitous in biology ranging from nerve controlled muscle contraction to voltage controlled ion channels [10,13], and piezoelectricity and spontaneous polarization have been observed in a wide variety of biological tissues [14,15]. Ferroelectricity, wherein the spontaneous polarization can be externally switched, however, has only recently been discovered in aortic walls and other biological systems [12,16,17], despite persistent speculation on its biological significance [18,19]. We hypothesize that elastin, one of the main extracellular matrix components of the aorta, is ferroelectric, since collagens have been previously reported to be nonswitchable [20,21]. The ferroelectricity of elastin, if confirmed, would connect a few interesting observations in biology. For example, elastins is only found in arteries of vertebrates [5], as well as in the later stage of the embryonic development [22], wherein blood pressure is notably higher, and ferroelectric switching may help damp out the increased pulsatile flow and blood pressure in order to limit distal shear stress [5]. Collagen, on the other hand, is found in both vertebrates and invertebrates, though they have been shown to be nonferroelectric [20,21]. In addition, pyroelectricity has long been thought to play a fundamental role in the processes of morphogenesis, and it was observed that the longitudinal growth of animal and plant structures often occur in the direction of positive polarization [23], which correlates well with recent observations that elastin is a molecular determinant of late arterial morphogenesis, stabilizing arterial structure by regulating proliferation and organization of vascular smooth muscle [3,4].
In the present study, a purified elastic fiber network was obtained from a porcine thoracic aorta [24]. Atomic force microscopy topography mappings in Fig. S1 in the Supplemental Material [25] show the fibrous network in the micron meter regime, with the hierarchical structure of individual fibers consisting of numerous fine microfibrils revealed by transmission electron microscopy images in Fig. S2 of Ref. [25]. PFM, a powerful tool to probe the biological electromechanics at nanoscale [20,21,26–31], was used to measure the piezoelectric effect of the elastin, by applying an ac voltage through the conductive atomic force microscopy tip to excite the piezoelectric vibration of the sample under both vertical and lateral modes [32]. The thickness of the PFM sample is approximately 0.62 mm, and a typical PFM scan is shown in Fig. 1. The two-dimensional (2D) topography mapping in Fig. 1(a) reveals three elastin fibers, and the corresponding vertical and lateral PFM amplitude mappings in Figs. 1(c) and 1(d), both overlaid on the three-dimensional (3D) topography, confirm the piezoelectricity of the fibers. The vertical PFM is related to out-of-plane polarization, while the lateral PFM is related to in-plane polarization. It is observed that one of the fibers shows a high vertical response up to 120 pm with a relatively small lateral response, while another one exhibits a high lateral response up to 360 pm with a relatively small vertical response. This suggests that their polar orientations are rotated with respect to each other. These responses were driven by a 5 V ac voltage near resonance, as shown in Fig. 1(b), which is fitted well by the damped harmonic oscillator model (DHOM) [12,33], yielding a quality factor of 32 and resonant frequency of 176.9 kHz. The corrected PFM amplitude is 6.25 pm, indicating that the piezoelectric coefficient of elastin is on the order of 1 pm/V, in good agreement with previous reports on other biological systems [10]. The resonant frequency is smaller than aortic walls that contain stiffer collagens, suggesting that elastin is softer as expected. Such analysis is also confirmed by detailed mappings of corrected PFM amplitude and resonant frequency derived from the dual frequency resonance tracking [34] technique using DHOM, as exhibited in Fig. S3 of the Supplemental Material [25].
FIG. 1.

(color online). Piezoelectricity of elastin probed by PFM over a 1 × 1 μm2 sample area. (a) 2D topography mapping obtained by a contact mode PFM scan, showing three elastin fibers; (b) PFM amplitude versus the driving frequency of ac voltage (blue dot), showing enhanced PFM amplitude at resonant frequency; the data are fitted well by the damped harmonic oscillator model (red solid line). (c) Vertical and (d) lateral PFM amplitude mappings overlaid on 3D topography; the area with relatively high vertical (lateral) piezoresponse usually exhibits relatively low lateral (vertical) piezoresponse, suggesting different polar orientations.
Switching spectroscopy piezoresponse force microscopy (SSPFM) [35] was then carried out on 32 × 32 grid points over a 10 μm × 10 μm area, as shown in Fig. 2, which exhibit consistent ferroelectric switching throughout the region, similar to what we observed in the aortic wall [12]. The 3D topography mapping in Fig. 2(a) shows the fibrous chain structure of elastin, and a sequence of dc voltages up to 80 V is applied to switch the polarization, with the corresponding PFM response measured by 10 V ac voltage simultaneously, as schematically shown in Fig. 2(a) on top of the topography mapping. In order to minimize the electrostatic interactions, the responses during the “OFF” state are used in the following analysis. Phase-voltage hysteresis and amplitude-voltage butterfly loops characteristic of ferroelectric switching are obtained throughout the probed area, with loops of three representative points shown in Figs. 2(b) and 2(c). In contrast, we have also probed collagen extracted from the aorta, which was found to be nonswitchable, consistent with previous observation in collagens [21,22]. This suggests that the ferroelectricity we observed in aortic walls may be associated with elastin, and it is reasonable to expect biological ferroelectricity in other connective tissues containing elastin as well, such as skin and lung tissues. Indeed, detailed SSPFM mappings of elastin exhibits similar characteristics as those of aortic walls. In general, the high piezoresponse is found in the range of 286–544 pm, and low response is in the range of 13–77 pm, as observed from remnant amplitude mapping in Fig. 2(d); it is noted that even points where the PFM amplitude is rather small can be consistently switched, in sharp contrast to what we observe in glucose-treated elastin, as will be discussed next. The coercive voltage is observed ranging from approximately 4–27 V in Fig. 2(e), exhibiting a larger variation than the aortic wall, though the probed area is also much larger. The nucleation bias, defined as the average of positive and negative coercive voltages, is consistently negative, ranging from −9.6–0 V, with most points around −2.2 V, as shown in Fig. 2(f). This suggests internal asymmetry of the polarization in elastin similar to the aortic wall [12], which can also be deducted from the small asymmetry seen in the hysteresis and butterfly loops. It has been verified that such switching behavior is repeatable throughout the sample and in different samples, and SSPFM mapping of the remnant amplitude for another elastin sample is shown in Fig. S4 of the Supplemental Material [25].
FIG. 2.
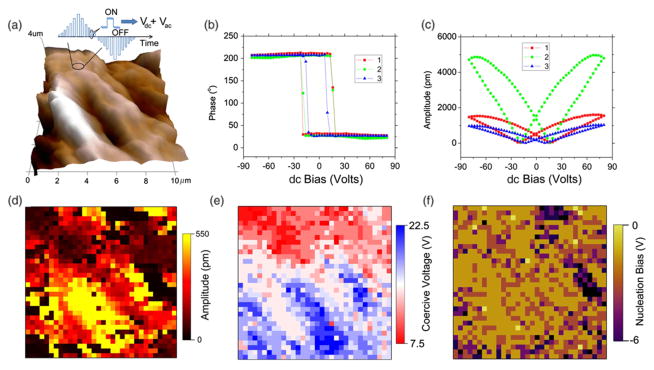
(color online). Ferroelectric switching of elastin probed by PFM on 32 × 32 grid of points over a 10 × 10 μm2 sample area. (a) 3D topography mapping, with schematics on the top showing a sequence of dc voltage in the triangular form applied to switch the polarization, and ac voltage simultaneously applied to measure the corresponding piezoresponse. (b) Phase-voltage hysteresis loops and (c) amplitude-voltage butterfly loops at three representative points, showing characteristics of ferroelectric switching, and switching spectroscopy PFM (SSPFM) mappings of (d) remnant PFM amplitude at zero dc voltage, (e) coercive voltage, and (f) nucleation bias calculated as the average of positive and negative coercive voltages, showing consistent switching throughout the probed area.
While SSPFM mappings convincingly established consistent ferroelectric switching in elastin, we also found that such switching is largely suppressed by in vitro glucose treatment, as seen in Fig. 3. The fibrous structure is again evident from 3D topography in Fig. 3(a) over a 5 × 5 um2 area for glucose-treated elastin. The SSPFM mapping of the remnant PFM amplitude on a grid of 32 × 32 points is shown in Fig. 3(b), with the experimental parameters identical to those of Fig. 2. While many points are switched with relatively large PFM amplitude, large areas marked in blue are also identified showing no switching characteristics, accounting for 30.7% of the total points probed. This is better illustrated in Figs. 3(d) and 3(e), where representative phase-voltage and amplitude-voltage loops are shown. While the point outside of the blue area shows clear hysteresis and butterfly loops, three selected points inside the blue area show a very small variation in phase and rather irregular amplitude loops, indicating no switching occurs at these points. Similar observations are made throughout the blue area, suggesting that the ferroelectricity is suppressed in these areas by the glucose treatment. Such observation is also consistent throughout the glucose-treated samples, and three additional SSPFM mappings of glucose-treated elastin are shown in Fig. S5 of Ref. [25], where switching is suppressed in the blue area as well. The percentage of points with switching suppressed derived from these SSPFM mappings are presented in Fig. S6 of the Supplemental Material [25], which illustrates that untreated elastin shows consistent switching throughout, while the glucose-treated elastin has switching suppressed to a different extent. In fact, even for points outside of the blue area where the switching is not completely suppressed, the switching characteristics are also substantially altered by glucose treatment. For example, the amplitude-voltage butterfly loops become highly asymmetric, with a much higher PFM amplitude at positive voltage, while the corresponding nucleation bias moves toward much more negative values. This is confirmed by SSPFM mapping of the nucleation bias shown in Fig. 3(c), which ranges from −20 to −38 V, much larger than those observed in untreated elastin in Fig. 2(f). This observation suggests that glucose treatment seem to freeze the internal asymmetric polar structures of elastin, making it much harder to switch, or suppress the switching completely. Since the 10 × 10 μm2 area only contains a few elastic fibers, we also probed 64 points over a 90 × 90 μm2 area in 5 glucose-treated samples and 5 controls without glucose treatment. Statistical analysis was performed using one-way analysis of variance to confirm the statistical significance of the difference between the control and glucose-treated elastin. The resulting percentages of points with switching characteristics suppressed are shown in Fig. 3(f), and it is again observed that untreated elastin shows 100% switching in all these samples, while glucose-treated elastin has switching suppressed at approximately 49.68% ± 5.54% points.
FIG. 3.

(color online). SSPFM mapping of 32 × 32 grid of points over a 5 × 5 μm2 sample area shows suppression of ferroelectricity in elastin by glucose treatment. (a) 3D topography mapping and SSPFM mappings of (b) remnant amplitude and (c) nucleation bias, where points with no switching characteristics are marked by blue; (d) phase-voltage loops and (e) amplitude-voltage loops at four representative points, showing that switching is suppressed in points 1, 2, and 3 within the blue area, but is observed in point 4 outside of it. (f) Comparison of percentages of points showing no switching characteristics in the control and glucose-treated elastin (n = 5) over a 90 × 90 μm2 sample area, with 64 points probed in each sample; the percentage of the no switching points (49.68% ± 5.54%) in the glucose-treated elastin is significantly higher than the untreated elastin (0%) (p < 0.05).
To understand the suppression of ferroelectricity in elastin by glucose treatment, and to correlate the changes of ferroelectricity to its piezoelectric response, we also carried out detailed PFM mapping for glucose-treated elastin using dual frequency resonance tracking with 15 V ac voltage, as shown in Fig. 4. Two-dimensional topography mapping is presented in Fig. 4(a), which shows two elastin fibers. PFM amplitude mapping overlaid on 3D topography is shown in Fig. 4(b), with both high and low PFM amplitudes observed. Interestingly, it is noted that points within the high response areas exhibit clear yet notably asymmetric switching characteristics, while those within low response areas are largely nonswitchable, as seen in Figs. 4(d) and 4(e). Further analysis reveals that for non-switched points, the piezoelectric response is rather small, and it cannot be fitted by DHOM. This is evident from the corrected PFM amplitude mapping in Fig. 4(c), which shows large amounts of blue points, for which DHOM yields no solution. While it is difficult to compare the piezoelectric response of elastin with and without the glucose treatment quantitatively, since the PFM experiment is sensitive to a number of parameters, the statistical distributions of the PFM amplitude over four 1 μm × 1 μm areas in respective samples reveal valuable information, as shown in Fig. S7 in the Supplemental Material [25]. In particular, glucose treatment leads to large spikes at very weak PFM amplitude, as small as 0.2 pm, with the intensity close to (Fig. S7(c) of Ref. [25]) or even higher than (Fig. S7(d) of Ref. [25]) intensity at typical PFM amplitude around 3~4 pm. Such spike is clearly absent in untreated elastin samples as seen in Fig. S7(a) and Fig. S7(b) [25]. To better quantify this, we also evaluated the percentage of points with piezoresponse less than 1 pm from PFM mappings of both pure and treated elastin, as shown in Fig. S8 of Supplemental Material [25], which confirms that the glucose-treated elastin has a much higher percentage of points with an extremely small piezoresponse. These observations suggest that glucose also alters the piezoelectric response of elastin substantially in addition to suppressing its ferroelectric switching. While the detailed mechanism of loss of ferroelectricity remains to be uncovered, these data indicate that it may be related to cross-linking, which stiffens the elastin fibers and reduces their piezoelectricity, resulting in hardening of the arteries. Indeed, an increase of the tangent modulus was observed in glucose treated elastin [36], as detailed in Fig. S9 in the Supplemental Material [25].
FIG. 4.

(color online). Correlation between reduced piezoresponse and suppressed ferroelectricity in glucose-treated elastin, as probed by PFM over a 1 × 1 μm2 area. (a) 2D topography mapping; (b) PFM amplitude mapping; (c) PFM amplitude mapping corrected by a quality factor obtained from DHOM, wherein points with no solution from DHOM are marked by blue. (d) Phase-voltage loops and (e) amplitude-voltage loops of four representative points, showing that switching is suppressed in points 3 and 4 within the blue areas, but is observed in points 1 and 2 outside of it.
While ferroelectricity has long been speculated in biology, and a variety of potential biological functions have been proposed, convincing evidence of biological ferroelectricity has only recently emerged. By confirming ferroelectric switching in elastin, this study uncovers the possible origin of ferroelectricity in the aortic wall, and points to a potentially much wider occurrence of ferroelectricity in biology. Indeed, one of the main components of elastin, glycine [2], has recently been reported to be ferroelectric [17]. While a clear understanding on the biological significance of ferroelectricity remains to be established, the switching in elastin appears to coincide with rising blood pressure in vertebrates as well as in the later stage of embryonic development, and it may provide energy dissipation to damp the increased pulsatile flow and blood pressure in arteries, as well as higher pressure and/or stress in lungs, ligaments, and skin. Interestingly, collagen, a more ancient and ubiquitous protein than elastin, has been found to be nonswitchable [5,22]. The polarization in elastin may also help in regulating proliferation and organization of vascular smooth muscle and contribute to arterial morphogenesis, as the longitudinal growth of animal and plant structures in the direction of positive polarization is often observed [23]. Finally, while it is well known that glycation degrades the structure and functionalities of elastin, we present the first evidence that it also alters the electromechanical response of elastin and suppress its ferroelectricity. Such loss of ferroelectric switching could contribute to a wide range of phenomena associated with glycation from aging to arteriosclerosis. For example, accumulation of ions is often observed in cross-linked elastin [1], particularly calcium ions [8]. Furthermore, the electromechanical response of elastin and its correlation with the degree of glycation can be applied for high resolution imaging and for testing tissues of extremely small quantity. This study thus shed considerable new insight into biological ferroelectricity, though much more remains to be learned about its mechanisms and significance.
Supplementary Material
Acknowledgments
J. Y. L. acknowledges support from the National Science Foundation (Grants No. DMR 1006194 and No. CMMI 1100339). Y. M. L. acknowledges partial support of a UIF Fellowship from the Center for Nanotechnology, University of Washington, and Royalty Research Fund. N. Q. C. acknowledges the support of a NASA Space Technology Research Fellowship (No. 11-NSTRF11-0323). Y. H. Z. acknowledges the support of the National Science Foundation (Grants No. CAREER CMMI 0954825 and No. CMMI 1100791) and the National Institutes of Health (Grant No. HL098028).
References
- 1.Pasquali-Ronchetti I, Baccarani-Contri M, Fornieri C, Mori G, Quaglino D. Micron. 1993;24:75. doi: 10.1016/s0945-053x(98)90126-3. [DOI] [PubMed] [Google Scholar]
- 2.Daamen WF, Veerkamp JH, van Hest JCM, van Kuppevelt TH. Biomaterials. 2007;28:4378. doi: 10.1016/j.biomaterials.2007.06.025. [DOI] [PubMed] [Google Scholar]
- 3.Li DY, Brooke B, Davis EC, Mecham RP, Sorensen LK, Boak BB, Eichwald E, Keating MT. Nature (London) 1998;393:276. doi: 10.1038/30522. [DOI] [PubMed] [Google Scholar]
- 4.Brooke BS, Bayes-Genis A, Li DY. Trends Cardiovasc Med. 2003;13:176. doi: 10.1016/s1050-1738(03)00065-3. [DOI] [PubMed] [Google Scholar]
- 5.Faury G. Pathol Biol. 2001;49:310. doi: 10.1016/s0369-8114(01)00147-x. [DOI] [PubMed] [Google Scholar]
- 6.Bailey AJ. Mech Ageing Dev. 2001;122:735. doi: 10.1016/s0047-6374(01)00225-1. [DOI] [PubMed] [Google Scholar]
- 7.Danby FW. Clin Dermatol. 2010;28:409. doi: 10.1016/j.clindermatol.2010.03.018. [DOI] [PubMed] [Google Scholar]
- 8.Tomizawa H, Yamazaki M, Kunika K, Itakura M, Yamashita K. Diabetes Res Clin Pract. 1993;19:1. doi: 10.1016/0168-8227(93)90138-u. [DOI] [PubMed] [Google Scholar]
- 9.Konova E, Baydanoff S, Atanasova M, Velkova A. Exp Gerontol. 2004;39:249. doi: 10.1016/j.exger.2003.10.003. [DOI] [PubMed] [Google Scholar]
- 10.Kalinin SV, Rodriguez BJ, Jesse S, Karapetian E, Mirman B, Eliseev EA, Morozovska AN. Annu Rev Mater Res. 2007;37:189. [Google Scholar]
- 11.Bonnell DA, Kalinin SV, Kholkin AL, Gruverman A. MRS Bull. 2009;34:648. [Google Scholar]
- 12.Liu YM, Zhang Y, Chow MJ, Chen QN, Li J. Phys Rev Lett. 2012;108:078103. doi: 10.1103/PhysRevLett.108.078103. [DOI] [PMC free article] [PubMed] [Google Scholar]
- 13.Sachs F, Brownell WE, Petrov AG. MRS Bull. 2009;34:665. doi: 10.1557/mrs2009.178. [DOI] [PMC free article] [PubMed] [Google Scholar]
- 14.Fukada E, Yasuda I. J Phys Soc Jpn. 1957;12:1158. [Google Scholar]
- 15.Lang SB. Nature (London) 1966;212:704. [Google Scholar]
- 16.Li T, Zeng K. Acta Mater. 2011;59:3667. [Google Scholar]
- 17.Heredia A, et al. Adv Funct Mater. 2012;22:2996. [Google Scholar]
- 18.Lang SB. IEEE Trans Dielectr Electr Insul. 2000;7:466. doi: 10.1109/TDEI.2009.5293935. [DOI] [PMC free article] [PubMed] [Google Scholar]
- 19.Tuszynski JA, Craddock TJA, Travis JA, Carpenter EJ. J Comput Theor Nanosci. 2008;5:2022. [Google Scholar]
- 20.Kalinin SV, Rodriguez BJ, Jesse S, Thundat T, Gruverman A. Appl Phys Lett. 2005;87:053901. [Google Scholar]
- 21.Rodriguez BJ, Kalinin SV, Shin J, Jesse S, Grichko V, Thundat T, Baddorf AP, Gruverman A. J Struct Biol. 2006;153:151. doi: 10.1016/j.jsb.2005.10.008. [DOI] [PubMed] [Google Scholar]
- 22.Wagenseil JE, Ciliberto CH, Knutsen RH, Levy MA, Kovacs A, Mecham RP. Am J Physiol: Heart Circ Physiol. 2010;299:H257. doi: 10.1152/ajpheart.00194.2010. [DOI] [PMC free article] [PubMed] [Google Scholar]
- 23.Athenstaedt H. Ann N Y Acad Sci. 1974;238:68. doi: 10.1111/j.1749-6632.1974.tb26780.x. [DOI] [PubMed] [Google Scholar]
- 24.Lu Q, Ganesan K, Simionescu DT, Vyavahare NR. Biomaterials. 2004;25:5227. doi: 10.1016/j.biomaterials.2003.12.019. [DOI] [PubMed] [Google Scholar]
- 25.See Supplemental Material at http://link.aps.org/supplemental/10.1103/PhysRevLett.110.168101 for more details.
- 26.Halperin C, Mutchnik S, Agronin A, Molotskii M, Urenski P, Salai M, Rosenman G. Nano Lett. 2004;4:1253. [Google Scholar]
- 27.Gruverman A, Wu D, Rodriguez BJ, Kalinin SV, Habelitz S. Biochem Biophys Res Commun. 2007;352:142. doi: 10.1016/j.bbrc.2006.10.182. [DOI] [PubMed] [Google Scholar]
- 28.Minary-Jolandan M, Yu MF. ACS Nano. 2009;3:1859. doi: 10.1021/nn900472n. [DOI] [PubMed] [Google Scholar]
- 29.Harnagea C, Vallières M, Pfeffer CP, Wu D, Olsen BR, Pignolet A, Légaré F, Gruverman A. Biophys J. 2010;98:3070. doi: 10.1016/j.bpj.2010.02.047. [DOI] [PMC free article] [PubMed] [Google Scholar]
- 30.Minary-Jolandan M, Yu MF. Nanotechnology. 2009;20:085706. doi: 10.1088/0957-4484/20/8/085706. [DOI] [PubMed] [Google Scholar]
- 31.Kalinin SV, Rodriguez BJ, Jesse S, Seal K, Proksch R, Hohlbauch S, Revenko I, Thompson GL, Vertegel AA. Nanotechnology. 2007;18:424020. doi: 10.1088/0957-4484/18/42/424020. [DOI] [PubMed] [Google Scholar]
- 32.Eng LM, Guntherodt HJ, Rosenman G, Skliar A, Oron M, Katz M, Eger D. J Appl Phys. 1998;83:5973. [Google Scholar]
- 33.Albrecht TR, Grütter P, Horne D, Rugar D. J Appl Phys. 1991;69:668. [Google Scholar]
- 34.Rodriguez BJ, Callahan C, Kalinin SV, Proksch R. Nanotechnology. 2007;18:475504. [Google Scholar]
- 35.Jesse S, Baddorf AP, Kalinin SV. Appl Phys Lett. 2006;88:062908. [Google Scholar]
- 36.Zou Y, Zhang Y. J Biomech Eng. 2012;134:071002. doi: 10.1115/1.4006593. [DOI] [PubMed] [Google Scholar]
Associated Data
This section collects any data citations, data availability statements, or supplementary materials included in this article.