

Abstract
Purpose. The pathogenesis of diabetic retinopathy (DR) is insufficiently understood but may possibly involve chronic, low-grade inflammation. The aim of this cross-sectional study was to investigate the relationship between inflammatory and haemostatic markers, other markers of endothelial dysfunction and anthropometric parameters, and their association with DR in patients with type 2 diabetes. Methods. According to the DR status patients were divided into three groups: no retinopathy, mild/moderate nonproliferative (NPDR), and severe NPDR/proliferative retinopathy (PDR). Results. The groups did not differ in the levels of inflammatory and haemostatic markers, other markers of endothelial dysfunction, and anthropometric parameters. After dividing the patients according to the level of obesity (defined by BMI, WC, and WHR) into three groups ANOVA showed the differences in C-reactive protein according to the WC (P = 0.0265) and in fibrinogen according to the WHR (P = 0.0102) as well as in total cholesterol (P = 0.0109) and triglycerides (P = 0.0133) according to the BMI. Logistic regression analyses showed that diabetes duration and prolonged poor glycemic control are the main predictors of retinopathy in patients with type 2 diabetes. Conclusion. Interrelations between obesity, inflammation, haemostatic disturbance, and other risk factors may possibly play an important additional role in endothelial dysfunction involved in the pathogenesis of diabetic retinopathy.
1. Introduction
Diabetes is the most frequent endocrine disease in developed countries and one of the most common noncommunicable diseases (NCDs) globally, estimated to have affected more than 371 million people in 2012 and projected to affect 552 million by 2030 [1]. It is the fourth or fifth leading cause of death worldwide with 4.8 million deaths in 2012, and its complications account for a significant portion of morbidity, mortality, and healthcare system cost burdens [1–3]. It is undoubtedly one of the most challenging health problems in the 21st century.
Diabetes has many manifestations in the eye, of which cataract and diabetic retinopathy are the most significant cause of visual impairment and blindness, and people with diabetes are 25 times more likely than the general population to become blind. Diabetic retinopathy (DR), a long-term microvascular and visually devastating diabetic complication, is estimated to be the leading cause of new blindness in working-aged adults in developed countries [4, 5]. Many epidemiological and clinical trials have proven the impact of diabetes duration, poor glycemic control, and hypertension on the prevalence, incidence, and progression of diabetic retinopathy [6, 7]. Although these factors explain a significant portion of the presence and progression of retinopathy and of the incidence of proliferative retinopathy [8], the exact pathogenesis of diabetic retinopathy is still insufficiently understood. Dysfunction of retinal endothelium is thought to be a possible mechanism as it plays a crucial role in all stages of diabetic retinopathy [9, 10]. Strategically located between blood and tissue, healthy endothelium actively regulates vascular tone and permeability, the balance between coagulation and fibrinolysis, the composition of the subendothelial matrix, the extravasation of leukocytes, and the proliferation of vascular smooth muscle. To perform these functions, endothelium produces components of the extracellular matrix and a variety of regulatory mediators. Functional impairment of endothelial activity precedes the development of morphological alterations during the progression of diabetes and its vascular complications. This endothelial dysfunction results from reduced bioavailability of the vascular nitric oxide (NO), mainly due to accelerated NO degradation by reactive oxygen species (ROS). Although hyperglycemia, insulin resistance, hyperinsulinemia, and hyperlipidemia independently and/or simultaneously contribute to endothelial dysfunction via several different mechanisms [11], systemic inflammation and hemorheological alterations found in obese diabetic patients may possibly play an important role in the endothelial dysfunction and in the etiopathogenesis of diabetic retinopathy [12, 13].
Many studies have documented the association of inflammation, haemostatic disturbance, and endothelial dysfunction with macroangiopathy in obese nondiabetic individuals and type 2 diabetic patients [14, 15], but only some of them have investigated the association of inflammation and endothelial dysfunction with the prevalence and progression of diabetic microangiopathy [16, 17].
The aim of the present study was to investigate the relationship between inflammatory and haemostatic markers, other markers of endothelial dysfunction and anthropometric parameters, and their association with diabetic retinopathy in patients with type 2 diabetes.
2. Patients and Methods
This cross-sectional study was performed in collaboration between the Department of Endocrinology and Metabolic Diseases and the Department of Ophthalmology of the University Clinic Vuk Vrhovac Clinical Hospital Merkur in Zagreb in accordance with the Declaration of Helsinki and approved by the Hospital's Ethics Committee. The patients included in the study received both written and oral information about the study and signed a written informed consent.
2.1. Patients
A total of 107 patients with type 2 diabetes consecutively attending both departments over a six-month period were included in the study. They were on either oral hypoglycemic agent (OHA) therapy or insulin therapy. Type 2 diabetes was defined according to the American Diabetes Association classification [18]. Patients with malignancies, immunologic, infectious inflammatory diseases, patients receiving corticosteroids or cytostatics, pregnant women, and patients with other eye diseases (mature cataract, uveitis, and age-related macular degeneration) were not included in the study.
2.2. Methods
Patients who met all inclusion criteria were invited to participate in the study. At the inclusion visit, the informed consent form was signed, blood samples for laboratory analyses were collected between 08:00 and 10:00 h after 12 h overnight fast, and complete clinical and ophthalmic examination was performed.
2.2.1. Marker of Inflammation
C-reactive protein (CRP) was determined by an automated immunoturbidimetric assay on an Olympus AU600 analyzer (Olympus Optical Co., Tokyo, Japan) (reference value < 5.0 mg/L) [19].
2.2.2. Marker of Haemostatic Disturbance
Fibrinogen was measured by the Clauss method (reference values 1.8–4.1 g/L) [20].
2.2.3. Other Markers of Endothelial Dysfunction
Glycated hemoglobin value (HbA1c), total cholesterol, HDL cholesterol, LDL cholesterol, and triglycerides were measured. HbA1c was determined at the beginning of the study from a single venous blood sample, and HbA1cmedian was obtained by statistical analysis of data from the National Registry for Diabetes (CroDiabNet). The statistical analysis included HbA1c values from venous blood samples taken from each individual patient at 3-4-month intervals over the past three years. HbA1c was determined by an automated immunoturbidimetric assay (reference values 3.5–5.7%) [21]. Total cholesterol and triglycerides were measured by the enzymatic colorimetric tests (reference values: total cholesterol < 5.00 mmol/L; triglycerides < 1.70 mmol/L) [22, 23].
2.2.4. Anthropometric Parameters
Body mass index (BMI) as a common index of obesity was calculated by dividing weight and height squared (kg/m2). Weight was measured using a balance-beam scale and height was measured using a wall-mounted stadiometer with patients in their underwear and without shoes. Recommended value among men was considered <23 and among women < 22 kg/m2 with a normal range between 18.5 and 24.9 kg/m2 [24]. Waist circumference (WC), a direct indicator of abdominal obesity, was measured in the middle distance between the last floating rib and the iliac crest (cm). Recommended values were considered <94 cm (men) and <80 cm (women) [25]. The waist-to-hip ratio (WHR) as an index of body fat distribution was determined by dividing waist and hip circumference. The hip circumference was measured with a measuring tape passing on femoral trochanters (cm). Suggested values of WHR were considered as <1.0 (men) and <0.8 (women) [25].
2.2.5. Clinical Parameters
Blood pressure was measured with an ambulatory sphygmomanometric device after a 5 min rest, and a mean of three measurements was used. Hypertension was defined as blood pressure >130/80 mmHg.
2.2.6. Ophthalmologic Examination
Complete eye examination included best corrected visual acuity (BCVA), Goldmann applanation tonometry, slit lamp biomicroscopy of the anterior eye segment, binocular indirect slit lamp fundoscopy, and fundus photography after mydriasis with eye drops containing 0.5% tropicamide and 5% phenylephrine. Color fundus photographs of two fields (macular field, disc/nasal field) of both eyes were taken with a suitable 45° fundus camera (VISUCAM, Zeiss) according to the EURODIAB retinal photography methodology [26]: macular field: positioned in such a way that the exact center of the optic disc is laid at the nasal end of the horizontal meridian of the field view; disc/nasal field: such that the optic disc was positioned one disc-diameter in from the temporal edge of the field, on the horizontal meridian. EURODIAB classification scheme was used because it uses two-field 45° fundus photography and standard photographs to grade retinal lesions [26]. In each patient the eye more affected was graded for diabetic retinopathy using fundus photographs. Modified Scheie classification of hypertension retinopathy and classification of hypertension retinopathy by Wong and Mitchell were used to categorize the retinal vascular changes caused by hypertension [27, 28].
2.3. Statistical Analyses
For all analyzed variables descriptive statistics (n, mean ± standard deviation, percentages) were used. In all analyses P value of less than 0.05 was considered statistically significant. Differences in distributions of continuous data were determined by ANOVA or Kruskal-Wallis test. Differences in distributions of categorical data were evaluated by Chi-square test. The normality of distribution was tested by Shapiro-Wilks W test and homogeneity of variance by Leven test. To compare analyzed variables (C-reactive protein, fibrinogen, HbA1cmedian, total cholesterol, and triglycerides) according to the diabetic retinopathy status and the level of obesity (defined by BMI, WC, and WHR), ANOVA with two main factors and their interaction was used [29]. Univariate and multiple logistic regression analyses were used to assess the strength and independence of associations. All analyses and graphics were performed using STATISTICA 12.0. [30].
3. Results
This study included 107 patients with type 2 diabetes (67 male, 40 female) with a mean age 66.74 ± 8.01 years and a mean diabetes duration of 15.05 ± 5.69 years. Forty (37%) patients were on oral hypoglycemic agents (OHA) and 67 (63%) on insulin therapy.
The average best corrected visual acuity (BCVA) of our patients was 0.91 ± 0.22, and the average intraocular pressure (IOP) was 13.55 ± 1.33 mmHg. Nine (8%) patients were suffering from primary open angle glaucoma (POAG) and were treated with topical antiglaucomatous therapy. 16 (15%) patients had clear crystalline lenses, 74 (69%) an initial cataract, and 17 (16%) patients had the condition after cataract surgery (an artificial IOL implanted). Hypertensive retinopathy was detected in 40 (37%) patients.
According to the two-field 45° color fundus photography (EURODIAB standards) [26] patients were divided into three groups: DR group 1—patients with no retinopathy (n = 65), DR group 2—patients with mild/moderate nonproliferative diabetic retinopathy (NPDR; n = 19), and DR group 3—patients with severe/very severe NPDR or proliferative diabetic retinopathy (PDR; n = 23).
Ophthalmologic parameters of type 2 diabetic patients divided according to the diabetic retinopathy status are presented in Table 1. DR group 3 was found to have significantly lower best corrected visual acuity (BCVA) than DR group 1 (0.72 ± 0.37 versus 0.97 ± 0.08; P = 0.001). The presence of cataract as well as the condition after cataract surgery (an artificial IOL implanted) was observed significantly more often in DR groups 2 and 3 than in DR group 1 (P = 0.023). Hypertensive retinopathy was observed as marginally significant more often in DR groups 2 and 3 than in DR group 1 (P = 0.079).
Table 1.
Ophthalmologic parameters of type 2 diabetic patients (n = 107) divided into three groups according to the diabetic retinopathy status.
| DR group 1 (n = 65) |
DR group 2 (n = 19) |
DR group 3 (n = 23) |
H b Chi-squarec | P | |
|---|---|---|---|---|---|
| BCVA (decimal)* | 0.97 ± 0.08 | 0.92 ± 0.15 | 0.72 ± 0.37 | 13.86b | 0.001b |
| Glaucoma** | 11 | 5 | 4 | 0.54c | 0.461c |
| IOP (mmHg)* | 13.66 ± 1.50 | 13.58 ± 1.07 | 13.22 ± 0.95 | 0.49b | 0.487b |
| Lens** | 20/71/9 | 5/69/26 | 9/65/26 | 7.5c | 0.023c |
| Hypertensive retinopathy** | 31 | 47 | 48 | 3.09c | 0.079c |
*mean ± SD, **percentage, bKruskal-Wallis df = 1, cChi-square test df = 2.
BCVA: best corrected visual acuity; IOP: intraocular pressure; Lens: clear crystalline lens/initial cataract/condition after cataract surgery (an artificial IOL implanted).
Table 2 presents descriptive statistics of basic characteristics, inflammatory and haemostatic markers, other markers of endothelial dysfunction, and anthropometric and clinical parameters of type 2 diabetic patients divided according to the diabetic retinopathy status. DR group 3 had significantly longer duration of diabetes (19.35 ± 4.60 years versus 13.22 ± 5.08 years; P < 0.001) and more often insulin than OHA therapy (87/13% versus 52/48%; P = 0.009) in comparison with DR group 1. The three groups did not significantly differ in the levels of inflammatory and haemostatic markers, other markers of endothelial dysfunction, and anthropometric and clinical parameters, with the exception of marginally significant difference in HbA1cmedian between the DR group 3 and DR group 1 (7.31 ± 0.85 versus 6.77 ± 0.76; P = 0.055).
Table 2.
Basic characteristics, inflammatory and haemostatic markers, other markers of endothelial dysfunction, and anthropometric and clinical parameters of type 2 diabetic patients (n = 107) divided into three groups according to the diabetic retinopathy status.
| DR group 1 (n = 65) |
DR group 2 (n = 19) |
DR group 3 (n = 23) |
F a Chi-squarec | P | |
|---|---|---|---|---|---|
| Age (years)* | 66.31 ± 8.31 | 68.47 ± 7.11 | 66.52 ± 7.98 | 0.543a | 0.583a |
| Sex (m/f)** | 65/35 | 42/58 | 74/26 | 0.28c | 0.595c |
| Diabetes duration (years)* | 13.22 ± 5.08 | 16.11 ± 6.01 | 19.35 ± 4.60 | 12.498a | 0.001a |
| Therapy (OHA/insulin)** | 48/52 | 32/68 | 13/87 | 7.52c | 0.009c |
| C-reactive protein (CRP) (mg/L)* | 3.37 ± 4.14 | 4.05 ± 3.34 | 5.36 ± 5.77 | 1.721a | 0.184a |
| Fibrinogen (g/L)* | 4.73 ± 1.23 | 4.75 ± 1.48 | 4.75 ± 1.09 | 0.002a | 0.998a |
| HbA1c (%)* | 6.42 ± 1.06 | 6.53 ± 1.06 | 6.70 ± 1.29 | 0.551a | 0.578a |
| HbA1cmedian (%)* | 6.77 ± 0.76 | 7.18 ± 0.81 | 7.31 ± 0.85 | 2.976a | 0.055a |
| Total cholesterol (mmol/L)* | 4.96 ± 0.85 | 4.87 ± 1.27 | 5.05 ± 1.05 | 0.178a | 0.838a |
| Triglycerides (mmol/L)* | 2.14 ± 1.19 | 2.48 ± 2.41 | 1.50 ± 0.61 | 1.230a | 0.066a |
| Body mass index (BMI) (kg/m²)* | 30.77 ± 6.06 | 30.91 ± 5.28 | 30.12 ± 5.33 | 0.129a | 0.879a |
| Waist circumference (WC) (cm)* | 107.52 ± 14.96 | 108.21 ± 12.09 | 107.91 ± 12.28 | 0.020a | 0.980a |
| Waist-to-hip ratio (WHR)* | 0.96 ± 0.08 | 0.96 ± 0.07 | 0.97 ± 0.07 | 0.162a | 0.851a |
| Systolic blood pressure (mmHg)* | 139.00 ± 22.97 | 151.32 ± 23.85 | 144.35 ± 21.18 | 2.267a | 0.109a |
| Diastolic blood pressure (mmHg)* | 82.15 ± 12.90 | 80.26 ± 15.50 | 78.70 ± 8.15 | 0.691a | 0.503a |
*mean ± SD, **percentage, aANOVA df = 2, cChi-square test df = 1.
OHA: oral hypoglycemic agent; HbA1c: glycated hemoglobin value determined at the beginning of the study from a single venous blood sample; HbA1cmedian: glycated hemoglobin value obtained by statistical analysis of data from the National Registry for Diabetes (CroDiabNet).
To investigate the specific relationship between the inflammatory and haemostatic markers, other markers of endothelial dysfunction, diabetic retinopathy, and obesity, patients were additionally divided according to the anthropometric parameters (BMI; body mass index, WC; waist circumference, WHR waist-to-hip ratio,) [24, 25] into three groups. BMI groups are BMI group 1—patients with BMI ≤ 25 kg/m² (n = 10), BMI group 2—patients with BMI 26–29.9 kg/m² (n = 48), and BMI group 3—patients with BMI ≥ 30 kg/m² (n = 49). WC groups are WC group 1—patients with WC ≤ 94 (m) or ≤80 (w) cm (n = 11), WC group 2—patients with WC 95–110 (m) or 81–95 (w) cm (n = 37), and WC group 3—patients with WC ≥111 (m) or ≥96 (w) cm (n = 59). WHR groups are WHR group 1—patients with WHR ≤ 1.0 (m) or ≤0.8 (w) (n = 16), WHR group 2—patients with WHR 1.01–1.1 (m) or 0.81–0.9 (w) (n = 47), and WHR group 3—patients with WHR ≥1.11 (m) or ≥0.91 (w) (n = 44).
Table 3 presents the differences in C-reactive protein, fibrinogen, HbA1cmedian, total cholesterol, and triglycerides in type 2 diabetic patients divided into three groups according to the diabetic retinopathy status and the level of obesity (defined by BMI, WC, and WHR). The statistically significant difference in CRP was observed according to the level of WC (P = 0.0265), while no significant differences in CRP were observed according to the DR status, level of BMI and WHR, or the interaction between the DR status and the level of obesity. The statistically significant difference in fibrinogen was found according to the level of WHR (P = 0.0102), while no significant differences in fibrinogen were found according to the DR status, level of BMI and WC, or the interaction between the DR status and the level of obesity. The significant difference in HbA1cmedian was observed according to the DR status (P = 0.0312), while there were no significant differences according to the level of obesity or interaction of DR status and the level of obesity. The significant differences in total cholesterol and triglycerides were observed only according to the level of BMI (total cholesterol P = 0.0109; triglycerides P = 0.0133), while there were no significant differences according to the DR status, level of WC and WHR, or interaction between DR status and the level of obesity. Statistically significant differences observed by ANOVA with two main factors and their interaction are presented in Figure 1.
Table 3.
Differences in C-reactive protein, fibrinogen, HbA1cmedian, total cholesterol, and triglycerides in type 2 diabetic patients divided into three groups according to the diabetic retinopathy status and the level of obesity defined by BMI, WC, and WHR.
| CRP | Fibrinogen | HbA1cmedian | Total cholest. | Triglycerides | |||||||
|---|---|---|---|---|---|---|---|---|---|---|---|
| df | F | P | F | P | F | P | F | P | F | P | |
| BMI 3 groups | 1 | 0.660 | 0.4184 | 0.003 | 0.9588 | 2.877 | 0.0930 | 6.734 | 0.0109 | 6.353 | 0.0133 |
| DR | 1 | 1.711 | 0.1939 | 0.157 | 0.6927 | 4.776 | 0.0312 | 1.132 | 0.2899 | 0.986 | 0.3231 |
| BMI 3 gr. ∗ DR | 3 | 0.335 | 0.7997 | 0.878 | 0.4552 | 1.231 | 0.3025 | 0.938 | 0.4254 | 2.197 | 0.0932 |
|
| |||||||||||
| WC 3 groups | 1 | 5.077 | 0.0265 | 1.287 | 0.2593 | 0.763 | 0.3846 | 0.010 | 0.9217 | 0.676 | 0.4130 |
| DR | 1 | 2.395 | 0.1249 | 0.662 | 0.4180 | 3.479 | 0.0651 | 0.268 | 0.6057 | 0.891 | 0.3476 |
| WC 3 gr. ∗ DR | 3 | 0.320 | 0.8108 | 1.971 | 0.1233 | 0.142 | 0.9345 | 0.533 | 0.6604 | 1.063 | 0.3686 |
|
| |||||||||||
| WHR 3 groups | 2 | 2.536 | 0.0844 | 4.809 | 0.0102 | 0.790 | 0.4566 | 1.666 | 0.1943 | 1.697 | 0.1885 |
| DR | 2 | 2.163 | 0.1204 | 1.198 | 0.3063 | 2.875 | 0.0612 | 0.658 | 0.5200 | 1.795 | 0.1716 |
| WHR 3 gr. ∗ DR | 4 | 1.639 | 0.1704 | 1.061 | 0.3799 | 1.769 | 0.1411 | 0.341 | 0.8499 | 1.009 | 0.4065 |
DR: diabetic retinopathy; BMI: body mass index (kg/m²); WC: waist circumference (cm); WHR: waist-to-hip ratio; CRP: C-reactive protein; HbA1cmedian: glycated hemoglobin value obtained by statistical analysis of data from the National Registry for Diabetes (CroDiabNet).
Figure 1.
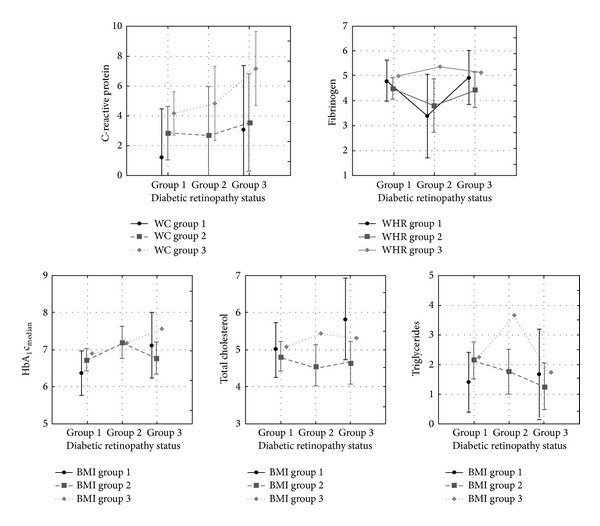
Vertical bars denote 0.95 confidence intervals. BMI: body mass index (kg/m²); WC: waist circumference (cm); WHR: waist-to-hip ratio. Statistically significant differences in C-reactive protein, fibrinogen, HbA1cmedian, total cholesterol, and triglycerides in type 2 diabetic patients divided into three groups according to the diabetic retinopathy status and the level of obesity defined by BMI, WC, and WHR.
Univariate and multiple logistic regression analyses showed that diabetes duration, insulin therapy, and prolonged poor glycemic control (HbA1cmedian) were the main predictors of retinopathy in patients with type 2 diabetes (Table 4). The increasing prevalence of retinopathy was significantly associated with longer duration of diabetes (OR = 1.17, 95% CI 1.08–1.27), even after adjustment for age and sex (AOR = 1.2, 95% CI 1.1–1.32). Insulin therapy, not obligatory in type 2 diabetes but often used in patients with prolonged diabetes duration and poor glycemic control, increased the prevalence of retinopathy to a significant extent (OR = 3.34, 95% CI 1.38–8.09), even after adjustment for age and sex (AOR = 3.28, 95% CI 1.34–8.02). The increasing prevalence of retinopathy was significantly related to prolonged poor glycemic control (HbA1cmedian) (OR = 1.76, 95% CI 1.08–2.86), being equal after adjustment for age and sex (AOR = 1.84, 95% CI 1.10–3.06).
Table 4.
Odds ratios (95% CIs) for diabetic retinopathy associated with basic characteristics, inflammatory and haemostatic markers, other markers of endothelial dysfunction, and anthropometric and clinical parameters in type 2 diabetic patients (n = 107).
| OR | 95% CI (OR) | AOR* | 95% CI (AOR) | |
|---|---|---|---|---|
| Diabetes duration (years) | 1.17 | 1.08–1.27 | 1.2 | 1.1–1.32 |
| Therapy (insulin) | 3.34 | 1.38–8.09 | 3.28 | 1.34–8.02 |
| C-reactive protein (CRP) | 1.07 | 0.98–1.18 | 1.08 | 0.99–1.18 |
| Fibrinogen | 1.01 | 0.74–1.38 | 0.99 | 0.71–1.37 |
| HbA1c | 1.18 | 0.83–1.68 | 1.23 | 0.85–1.77 |
| HbA1cmedian | 1.76 | 1.08–2.86 | 1.84 | 1.10–3.06 |
| Total cholesterol | 1.01 | 0.68–1.51 | 1.03 | 0.68–1.57 |
| Triglycerides | 0.89 | 0.69–1.13 | 0.90 | 0.70–1.15 |
| Body mass index (BMI) | 0.99 | 0.93–1.06 | 0.99 | 0.92–1.07 |
| Waist circumference (WC) | 1.00 | 0.97–1.03 | 1.01 | 0.98–1.04 |
| Waist-to-hip ratio (WHR) | 1.34 | 0.01–185.05 | 7.42 | 0.14–3806.64 |
| Systolic blood pressure | 1.02 | 1.00–1.03 | 1.02 | 1.00–1.04 |
| Diastolic blood pressure | 0.98 | 0.95–1.01 | 0.98 | 0.95–1.02 |
Bold: statistically significant α = 0.05, *OR adjusted for age and sex.
HbA1c: glycated hemoglobin value determined at the beginning of the study from a single venous blood sample; HbA1cmedian: glycated hemoglobin value obtained by statistical analysis of data from the National Registry for Diabetes (CroDiabNet).
4. Discussion
Due to its high prevalence, incidence, and risk of macrovascular and microvascular diabetic complications, type 2 diabetes is one of the potentially most damaging diseases and biggest public health problems at the present time. Diabetic eye disease with its complications, especially diabetic retinopathy which leads to macular edema and retinal neovascularization, is the leading cause of visual dysfunction and blindness among working-aged adults in economically developed societies worldwide.
As expected, we found a significantly lower visual function, defined by best corrected visual acuity (BCVA), in the group of patients with severe NPDR and PDR compared to the group of patients with no retinopathy. Also, a significantly more frequent cataract and the condition after cataract surgery (an artificial IOL implanted) were observed in the groups of patients with diabetic retinopathy (NPDR and PDR) as compared to the group of patients with no retinopathy. Some previous studies have found similar results [31, 32]. Pollreisz and Schmidt-Erfurth in their review attribute this to the activation of the polyol pathway by intracellular hyperglycemia, which leads to the sorbitol-induced osmotic stress and occurrence of a typical snowflake diabetic cataract or earlier senile cataract [32].
The results of logistic regression analyses in our study are supported by many previous epidemiological and clinical studies, suggesting that diabetes duration and prolonged poor glycemic control are the main predictors of the prevalence and progression of retinopathy in patients with type 2 diabetes [5, 33, 34]. We also found insulin therapy to be among the main predictors of retinopathy in this type of diabetes. It is common knowledge that insulin therapy is not obligatory for patients with type 2 diabetes, but in these patients it is often necessary in progressive insulinopenia, prolonged duration of diabetes, and very poor glycemic control. Our results are similar to those of the Wisconsin Epidemiologic Study of Diabetic Retinopathy, which reported an increased 4- and 10-year cumulative incidence and significantly increased prevalence of diabetic retinopathy in older patients on insulin therapy than those on OHA therapy (70% versus 39%) [6].
Hypertension is another risk factor for development and progression of diabetic retinopathy documented in many epidemiological and clinical studies. Two large clinical studies, the United Kingdom prospective diabetes study (UKPDS) and the appropriate blood pressure control in diabetes (ABCD) study, demonstrated benefit in retinopathy risk reduction in diabetic patients who received intensive blood pressure control therapy [35, 36]. On the basis of data from these studies, clinical guidelines now recommend optimization of blood pressure control in type 2 diabetic patients as part of preventive measures for visual loss due to diabetic retinopathy. In our study there was no significant difference in the level of systolic and diastolic blood pressure between the groups according to their diabetic retinopathy status. It is worth noting that the average systolic blood pressure among our patients was 142.34 ± 23.03 mmHg and the average diastolic blood pressure was 81.07 ± 12.53 mmHg, these values being very near to those recommended by the American and European Societies of Cardiology [37, 38]. Numerous studies reported that early diabetic and hypertensive retinopathy signs share a number of similar morphological features representing small vessel damage [39, 40]. One challenge that often confronts clinicians is to understand the contribution of diabetes or hypertension in the development of retinopathy. An acute increase in blood pressure may cause retinal vascular changes that are very similar to the retinal vascular lesions seen in mild and/or moderate nonproliferative diabetic retinopathy. Although similar, some clinical signs are more specific showing distinct morphological differences. For example, retinal arteriolar abnormalities, such as generalized or focal arteriolar narrowing and arteriovenous nicking, are commonly seen in patients with hypertension, whereas these arteriolar changes are not usually present in diabetic patients without hypertension [41, 42]. Clustering of microaneurysms may be a feature pointing more towards diabetes and has been shown to predict diabetic retinopathy progression. Isolated retinal microaneurysms, on the contrary, may indicate hypertensive retinopathy in association with focal retinal arteriolar signs [42]. In clinical practice hypertension and diabetes frequently coexist and are known to result in more severe diabetic retinopathy [43]. This could partially explain some of our results. In spite of the near-normal average values of systolic and diastolic blood pressure among our patients, in the groups of patients with diabetic retinopathy (NPDR and PDR) we found marginally significant more often clinical sings of hypertensive retinopathy than in the group of patients with no retinopathy.
In addition to these well-known risk factors, new data suggest that adipose tissue is an important determinant of a low-level, chronic inflammatory state reflected by the production of various proinflammatory cytokines. These cytokines induce insulin resistance and endothelial dysfunction, consequently linking the later phenomenon with obesity and diabetic angiopathy [44–46]. Some studies have shown the correlation between obesity and diabetic retinopathy in patients with type 2 diabetes [34, 47, 48]. Moreover, growing data suggest that inflammation and hypercoagulable state are strongly related to the prevalence and progression of diabetic retinopathy [49–52]. van Hecke et al. in the Hoorn Study have found a positive association between the levels of C-reactive protein and soluble intracellular adhesion molecule-1 (sICAM-1) in the prevalence of diabetic retinopathy [16]. Nguyen et al. in the multiethnic study of atherosclerosis have observed the association of fibrinogen and plasmin-α2-antiplasmin complex (PAP) with any stage of diabetic retinopathy and PAP and homocysteine with vision-threatening diabetic retinopathy [51]. In our study there was no significant difference in the levels of inflammatory and haemostatic markers, other markers of endothelial dysfunction, and anthropometric parameters between the groups according to the diabetic retinopathy status, with the exception of marginally significant difference in HbA1cmedian between the group of patients with severe NPDR and PDR and the group of patients with no retinopathy. The lack of significant difference in the levels of analyzed markers and parameters in our study may be a result of a relatively small sample size and due to the fact that the majority of our patients had near-normal values of these markers and parameters. However, we observed the significant difference in C-reactive protein according to the waist circumference and significant difference in fibrinogen according to the waist-to-hip ratio. Our results are similar to those of Nakamura et al., who reported that patients with metabolic syndrome had higher levels of C-reactive protein, and the main determinant of the CRP elevation was waist circumference [53]. García-Lorda et al. in their Mediterranean population study found C-reactive protein independently and positively associated to waist circumference and triglycerides and negatively associated to HDL-cholesterol [54]. C-reactive protein > 3 mg/L was found to be an independent risk factor for development of diabetic nephropathy and diabetic retinopathy [55], which confirmed the results of previously mentioned Hoorn study [16]. The multivariate analysis of the PRIME Study showed that waist-to-hip ratio, but not body mass index, was an independent predictor of fibrinogen [56]. These results were consistent with ours and results of two other cross-sectional studies suggesting that central body fat distribution is more relevant than general obesity to population correlates of fibrinogen [57, 58]. Cederholm-Williams et al. found higher plasma fibrinogen in diabetics than in controls and the highest fibrinogen in patients with more severe cases of retinopathy. As a direct consequence of the elevation of plasma fibrinogen they observed higher catabolic rate in diabetics than in controls and higher catabolic rate in patients with nonproliferative and proliferative retinopathy than in diabetics without retinopathy [59]. Fujisawa et al. suggested that an increased blood viscosity in type 2 diabetes patients due to high fibrinogen level and elevated intravessel pressure may play a role in the development of diabetic retinopathy [60]. In our study we also found the significant differences in total cholesterol and triglycerides according to the level of body mass index. Many previous epidemiologic studies have shown the association of body mass index and lipid profiles, especially higher total cholesterol and low-density lipoprotein cholesterol. Shamai et al. recently reported negative association of BMI with high-density lipoprotein cholesterol and positive association with triglycerides [61]. Investigating the potential risk factors for retinopathy in diabetic and nondiabetic individuals, the Hoorn study found positively associated prevalence of retinopathy with elevated blood pressure, BMI, total cholesterol, and triglyceride serum levels in all glucose categories [62]. Jew et al. suggested that HbA1c and total cholesterol are the two most important risk factors associated with clinically significant macular edema (CSME) in patients with nonproliferative diabetic retinopathy [63] whereas Zoppini et al. proposed that triglyceride/high-density lipoprotein cholesterol (TG/HDL-C) ratio is associated with an increased incidence of retinopathy and chronic kidney disease in patients with type 2 diabetes [64].
5. Conclusion
Diabetes duration, prolonged poor glycemic control, and the resulting need for insulin therapy are the main predictors of retinopathy in patients with type 2 diabetes. The significant differences in C-reactive protein, fibrinogen, total cholesterol, and triglycerides according to the level of obesity defined by different anthropometric parameters suggest that interrelations between obesity, inflammation, haemostatic disturbance, and other risk factors may possibly play an important additional role in endothelial dysfunction involved in the pathogenesis of diabetic retinopathy. Further studies that include larger number of patients and parameters such as inflammatory, haemostatic, and other markers of endothelial dysfunction are necessary to investigate whether our observations might contribute to the better understanding of the diabetic retinopathy causes and open new approaches for its prevention and treatment.
References
- 1.International Diabetes Federation. IDF Diabetes Atlas Update 2012. 5th edition. Brussels, Belgium: International Diabetes Federation; 2011. [Google Scholar]
- 2.Roglic G, Unwin N. Mortality attributable to diabetes: estimates for the year 2010. Diabetes Research and Clinical Practice. 2010;87(1):15–19. doi: 10.1016/j.diabres.2009.10.006. [DOI] [PubMed] [Google Scholar]
- 3.Roglic G, Unwin N, Bennett PH, et al. The burden of mortality attributable to diabetes: realistic estimates for the year 2000. Diabetes Care. 2005;28(9):2130–2135. doi: 10.2337/diacare.28.9.2130. [DOI] [PubMed] [Google Scholar]
- 4.Moss SE, Klein R, Klein BEK. The 14-year incidence of visual loss in a diabetic population. Ophthalmology. 1998;105(6):998–1003. doi: 10.1016/S0161-6420(98)96025-0. [DOI] [PubMed] [Google Scholar]
- 5.Williams R, Airey M, Baxter H, Forrester J, Kennedy-Martin T, Girach A. Epidemiology of diabetic retinopathy and macular oedema: a systematic review. Eye. 2004;18(10):963–983. doi: 10.1038/sj.eye.6701476. [DOI] [PubMed] [Google Scholar]
- 6.Klein R, Klein BEK, Moss SE, Davis MD, DeMets DL. The Wisconsin epidemiologic study of diabetic retinopathy. III. prevalence and risk of diabetic retinopathy when age at diagnosis is 30 or more years. Archives of Ophthalmology. 1984;102(4):527–532. doi: 10.1001/archopht.1984.01040030405011. [DOI] [PubMed] [Google Scholar]
- 7.Stratton IM, Kohner EM, Aldington SJ, et al. UKPDS 50: risk factors for incidence and progression of retinopathy in type 2 diabetes over 6 years from diagnosis. Diabetologia. 2001;44(2):156–163. doi: 10.1007/s001250051594. [DOI] [PubMed] [Google Scholar]
- 8.Klein R, Klein BEK, Moss SE, Cruickshanks KJ. The Wisconsin epidemiologic study of diabetic retinopathy: XVII. The 14- year incidence and progression of diabetic retinopathy and associated risk factors in type 1 diabetes. Ophthalmology. 1998;105(10):1801–1815. doi: 10.1016/S0161-6420(98)91020-X. [DOI] [PubMed] [Google Scholar]
- 9.Porta M. Endothelium: the main actor in the remodelling of the retinal microvasculature in diabetes. Diabetologia. 1996;39(6):739–744. doi: 10.1007/BF00418548. [DOI] [PubMed] [Google Scholar]
- 10.Stehouwer CDA, Lambert J, Donker AJM, van Hinsbergh VWM. Endothelial dysfunction and pathogenesis of diabetic angiopathy. Cardiovascular Research. 1997;34(1):55–68. doi: 10.1016/s0008-6363(96)00272-6. [DOI] [PubMed] [Google Scholar]
- 11.Potenza MA, Gagliardi S, Nacci C, Carratu MR, Montagnani M. Endothelial dysfunction in diabetes: from mechanisms to therapeutic targets. Current Medicinal Chemistry. 2009;16(1):94–112. doi: 10.2174/092986709787002853. [DOI] [PubMed] [Google Scholar]
- 12.Vekasi J, Marton Z, Kesmarky G, Cser A, Russai R, Horvath B. Hemorheological alterations in patients with diabetic retinopathy. Clinical Hemorheology and Microcirculation. 2001;24(1):59–64. [PubMed] [Google Scholar]
- 13.Williams MD, Nadler JL. Inflammatory mechanisms of diabetic complications. Current Diabetes Reports. 2007;7(3):242–248. doi: 10.1007/s11892-007-0038-y. [DOI] [PubMed] [Google Scholar]
- 14.Danesh J, Collins R, Appleby P, Peto R. Association of fibrinogen, C-reactive protein, albumin, or leukocyte count with coronary heart disease: meta-analyses of prospective studies. Journal of the American Medical Association. 1998;279(18):1477–1482. doi: 10.1001/jama.279.18.1477. [DOI] [PubMed] [Google Scholar]
- 15.Ridker PM, Stampfer MJ, Rifai N. Novel risk factors for systemic atherosclerosis: a comparison of C-reactive protein, fibrinogen, homocysteine, lipoprotein(a), and standard cholesterol screening as predictors of peripheral arterial disease. Journal of the American Medical Association. 2001;285(19):2481–2485. doi: 10.1001/jama.285.19.2481. [DOI] [PubMed] [Google Scholar]
- 16.van Hecke MV, Dekker JM, Nijpels G, et al. Inflammation and endothelial dysfunction are associated with retinopathy: the Hoorn study. Diabetologia. 2005;48(7):1300–1306. doi: 10.1007/s00125-005-1799-y. [DOI] [PubMed] [Google Scholar]
- 17.Gustavsson C, Agardh E, Bengtsson B, Agardh C-D. TNF-α is an independent serum marker for proliferative retinopathy in type 1 diabetic patients. Journal of Diabetes and Its Complications. 2008;22(5):309–316. doi: 10.1016/j.jdiacomp.2007.03.001. [DOI] [PubMed] [Google Scholar]
- 18.American Diabetes Association. Diagnosis and classification of diabetes mellitus. Diabetes Care. 2007;30(1):S42–S47. doi: 10.2337/dc07-S042. [DOI] [PubMed] [Google Scholar]
- 19.Ajani UA, Ford ES, Mokdad AH. Prevalence of high C-reactive protein in persons with serum lipid concentrations within recommended values. Clinical Chemistry. 2004;50(9):1618–1622. doi: 10.1373/clinchem.2004.036004. [DOI] [PubMed] [Google Scholar]
- 20.Clauss A. Gerinnungsphysiologische schnellmethode zur bestimmung des fibrinogens. Acta Hematologica. 1957;17(4):237–246. doi: 10.1159/000205234. [DOI] [PubMed] [Google Scholar]
- 21.Vučić Lovrenčić M, Topić E. Hemoglobin A1c: standardizacija, zlatnog standarda. Biochemia Medica. 2006;16(1):25–36. [Google Scholar]
- 22.Demacker PNM, Boerma GJM, Baadenhuijsen H. Evaluation of accuracy of 20 different test kits for the enzymic determination of cholesterol. Clinical Chemistry. 1983;29(11):1916–1922. [PubMed] [Google Scholar]
- 23.McGowan MW, Artiss JD, Strandbergh DR, Zak B. A peroxidase-coupled method for the colorimetric determination of serum triglycerides. Clinical Chemistry. 1983;29(3):538–542. [PubMed] [Google Scholar]
- 24.Kumanyika SK, Obarzanek E, Stettler N, et al. Population-based prevention of obesity: the need for comprehensive promotion of healthful eating, physical activity, and energy balance: a scientific statement from American Heart Association Council on Epidemiology and Prevention, Interdisciplinary Committee for prevention (Formerly the Expert Panel on Population and Prevention Science) Circulation. 2008;118(4):428–464. doi: 10.1161/CIRCULATIONAHA.108.189702. [DOI] [PubMed] [Google Scholar]
- 25.de Koning L, Merchant AT, Pogue J, Anand SS. Waist circumference and waist-to-hip ratio as predictors of cardiovascular events: meta-regression analysis of prospective studies. European Heart Journal. 2007;28(7):850–856. doi: 10.1093/eurheartj/ehm026. [DOI] [PubMed] [Google Scholar]
- 26.Aldington SJ, Kohner EM, Meuer S, Klein R, Sjolie AK. Methodology for retinal photography and assessment of diabetic retinography: the EURODIAB IDDM complications study. Diabetologia. 1995;38(4):437–444. doi: 10.1007/BF00410281. [DOI] [PubMed] [Google Scholar]
- 27.Mandava N, Yannuzzi LA. Hypertensive retinopathy. In: Regillo CD, Brown GC, Flynn HW Jr., editors. Vitreoretinal Disease: The Essentials. New York, NY, USA: Thieme; 1999. pp. 193–196. [Google Scholar]
- 28.Wong TY, Mitchell P. Hypertensive retinopathy. The New England Journal of Medicine. 2004;351(22):2310–2317. doi: 10.1056/NEJMra032865. [DOI] [PubMed] [Google Scholar]
- 29.Sokal RR, Rohlf FJ. Biometry: The Principles and Practice of Statistics in Biological Research. 3rd edition. New York, NY, USA: W. H. Freeman; 1995. [Google Scholar]
- 30.StatSoft. Electronic statistics textbook. 2011, http://www.statsoft.com/textbook/
- 31.Rotimi C, Daniel H, Zhou J, et al. Prevalence and determinants of diabetic retinopathy and cataracts in West African type 2 diabetes patients. Ethnicity and Disease. 2003;13(2):S110–S117. [PubMed] [Google Scholar]
- 32.Pollreisz A, Schmidt-Erfurth U. Diabetic cataract—pathogenesis, epidemiology and treatment. Journal of Ophthalmology. 2010;2010:8 pages. doi: 10.1155/2010/608751.608751 [DOI] [PMC free article] [PubMed] [Google Scholar]
- 33.Moss SE, Klein R, Klein BEK. Ten-year incidence of visual loss in a diabetic population. Ophthalmology. 1994;101(6):1061–1070. doi: 10.1016/s0161-6420(94)31217-6. [DOI] [PubMed] [Google Scholar]
- 34.van Leiden HA, Dekker JM, Moll AC, et al. Risk factors for incident retinopathy in a diabetic and nondiabetic population: the Hoorn study. Archives of Ophthalmology. 2003;121(2):245–251. doi: 10.1001/archopht.121.2.245. [DOI] [PubMed] [Google Scholar]
- 35.Matthews DR, Stratton IM, Aldington SJ, Holman RR, Kohner EM. Risks of progression of retinopathy and vision loss related to tight blood pressure control in type 2 diabetes mellitus: UKPDS 69. Archives of Ophthalmology. 2004;122(11):1631–1640. doi: 10.1001/archopht.122.11.1631. [DOI] [PubMed] [Google Scholar]
- 36.Schrier RW, Estacio RO, Mehler PS, Hiatt WR. Appropriate blood pressure control in hypertensive and normotensive type 2 diabetes mellitus: a summary of the ABCD trial. Nature Clinical Practice Nephrology. 2007;3(8):428–438. doi: 10.1038/ncpneph0559. [DOI] [PubMed] [Google Scholar]
- 37.Chobanian AV, Bakris GL, Black HR, et al. The seventh report of the joint national committee on prevention, detection, evaluation, and treatment of high blood pressure: the JNC 7 report. Journal of the American Medical Association. 2003;289(19):2560–2572. doi: 10.1001/jama.289.19.2560. [DOI] [PubMed] [Google Scholar]
- 38.Zanchetti A. 2003 European society of hypertension-European society of cardiology guidelines for the management of arterial hypertension. Journal of Hypertension. 2003;21(6):1011–1053. doi: 10.1097/00004872-200306000-00001. [DOI] [PubMed] [Google Scholar]
- 39.Venkatramani J, Mitchell P. Ocular and systemic causes of retinopathy in patients without diabetes mellitus. British Medical Journal. 2004;328(7440):625–629. doi: 10.1136/bmj.328.7440.625. [DOI] [PMC free article] [PubMed] [Google Scholar]
- 40.Grosso A, Cheung N, Veglio F, Wong TY. Similarities and differences in early retinal phenotypes in hypertension and diabetes. Journal of Hypertension. 2011;29(9):1667–1675. doi: 10.1097/HJH.0b013e3283496655. [DOI] [PubMed] [Google Scholar]
- 41.Ikram MK, Witteman JCM, Vingerling JR, Breteler MMB, Hofman A, de Jong PTVM. Retinal vessel diameters and risk of hypertension: the Rotterdam study. Hypertension. 2006;47(2):189–194. doi: 10.1161/01.HYP.0000199104.61945.33. [DOI] [PubMed] [Google Scholar]
- 42.Wong T, Mitchell P. The eye in hypertension. The Lancet. 2007;369(9559):425–435. doi: 10.1016/S0140-6736(07)60198-6. [DOI] [PubMed] [Google Scholar]
- 43.Klein R, Klein BEK, Moss SE, et al. Blood pressure, hypertension and retinopathy in a population. Transactions of the American Ophthalmological Society. 1993;91:207–226. [PMC free article] [PubMed] [Google Scholar]
- 44.van Greevenbroek MMJ, Schalkwijk CG, Stehouwer CDA. Obesity-associated low-grade inflammation in type 2 diabetes mellitus: causes and consequences. The Netherlands Journal of Medicine. 2013;71(4):174–187. [PubMed] [Google Scholar]
- 45.Kwon H, Pessin JE. Adipokines mediate inflammation and insulin resistance. Frontiers in Endocrinology. 2013;4(71):1–13. doi: 10.3389/fendo.2013.00071. [DOI] [PMC free article] [PubMed] [Google Scholar]
- 46.Fuentes E, Fuentes F, Vilahur G, Badimon L, Palomo I. Mechanisms of chronic state of inflammation as mediators that link obese adipose tissue and metabolic syndrome. Mediators of Inflammation. 2013;2013:11 pages. doi: 10.1155/2013/136584.136584 [DOI] [PMC free article] [PubMed] [Google Scholar]
- 47.Katušić D, Tomić M, Jukić T, et al. Obesity—a risk factor for diabetic retinopathy in type 2 diabetes? Collegium Antropologicum. 2005;29(1):47–50. [PubMed] [Google Scholar]
- 48.Raman R, Rani PK, Gnanamoorthy P, Sudhir RR, Kumaramanikavel G, Sharma T. Association of obesity with diabetic retinopathy: Sankara Nethralaya diabetic retinopathy epidemiology and molecular genetics study (SN-DREAMS Report no. 8) Acta Diabetologica. 2010;47(3):209–215. doi: 10.1007/s00592-009-0113-8. [DOI] [PubMed] [Google Scholar]
- 49.Kern TS. Contributions of inflammatory processes to the development of the early stages of diabetic retinopathy. Experimental Diabetes Research. 2007;2007:14 pages. doi: 10.1155/2007/95103.95103 [DOI] [PMC free article] [PubMed] [Google Scholar]
- 50.Klein BEK, Knudtson MD, Tsai MY, Klein R. The relation of markers of inflammation and endothelial dysfunction to the prevalence and progression of diabetic retinopathy: Wisconsin epidemiologic study of diabetic retinopathy. Archives of Ophthalmology. 2009;127(9):1175–1182. doi: 10.1001/archophthalmol.2009.172. [DOI] [PMC free article] [PubMed] [Google Scholar]
- 51.Nguyen TT, Alibrahim E, Islam FMA, et al. Inflammatory, hemostatic, and other novel biomarkers for diabetic retinopathy: the multi-ethnic study of atherosclerosis. Diabetes Care. 2009;32(9):1704–1709. doi: 10.2337/dc09-0102. [DOI] [PMC free article] [PubMed] [Google Scholar]
- 52.Madan R, Gupta B, Saluja S, Kansra UC, Tripathi BK, Guliani BP. Coagulation profile in diabetes and its association with diabetic microvascular complications. Journal of Association of Physicians of India. 2010;58:481–484. [PubMed] [Google Scholar]
- 53.Nakamura H, Ito H, Egami Y, et al. Waist circumference is the main determinant of elevated C-reactive protein in metabolic syndrome. Diabetes Research and Clinical Practice. 2008;79(2):330–336. doi: 10.1016/j.diabres.2007.09.004. [DOI] [PubMed] [Google Scholar]
- 54.García-Lorda P, Bulló M, Balanzà R, Salas-Salvadó J. C-reactive protein, adiposity and cardiovascular risk factors in a Mediterranean population. International Journal of Obesity. 2006;30(3):468–474. doi: 10.1038/sj.ijo.0803182. [DOI] [PubMed] [Google Scholar]
- 55.del Cañizo Gómeza FJ, Fernández Pérezb C, Moreno Ruiza I, et al. Microvascular complications and risk factors in patients with type 2 diabetes. Endocrinología y Nutrición. 2011;58(4):163–168. doi: 10.1016/j.endonu.2011.01.006. [DOI] [PubMed] [Google Scholar]
- 56.Scarabin P-Y, Aillaud M-F, Amouyel P, et al. Associations of fibrinogen, factor VII and PAI-1 with baseline findings among 10,500 male participants in a prospective study of myocardial infarction. The Prime study. Thrombosis and Haemostasis. 1998;80(5):749–756. [PubMed] [Google Scholar]
- 57.Krobot K, Hense HW, Cremer P, Eberle E, Keil U. Determinants of plasma fibrinogen: relation to body weight, waist-to-hip ratio, smoking, alcohol, age, and sex: results from the second MONICA Augsburg survey, 1989–1990. Arteriosclerosis and Thrombosis. 1992;12(7):780–788. doi: 10.1161/01.atv.12.7.780. [DOI] [PubMed] [Google Scholar]
- 58.Eliasson M, Evrin P-E, Lundblad D. Fibrinogen and fibrinolytic variables in relation to anthropometry, lipids and blood pressure. The Northern Sweden MONICA Study. Journal of Clinical Epidemiology. 1994;47(5):513–524. doi: 10.1016/0895-4356(94)90298-4. [DOI] [PubMed] [Google Scholar]
- 59.Cederholm-Williams SA, Dornan TL, Turner RC. The metabolism of fibrinogen and plasminogen related to diabetic retinopathy in man. European Journal of Clinical Investigation. 1981;11(2, supplement 1):133–138. doi: 10.1111/j.1365-2362.1981.tb02050.x. [DOI] [PubMed] [Google Scholar]
- 60.Fujisawa T, Ikegami H, Yamato E, et al. Association of plasma fibrinogen level and blood pressure with diabetic retinopathy, and renal complications associated with proliferative diabetic retinopathy, in type 2 diabetes mellitus. Diabetic Medicine. 1999;16(6):522–526. doi: 10.1046/j.1464-5491.1999.00111.x. [DOI] [PubMed] [Google Scholar]
- 61.Shamai L, Lurix E, Shen M, et al. Association of body mass index and lipid profiles: evaluation of a broad spectrum of body mass index patients including the morbidly obese. Obesity Surgery. 2011;21(1):42–47. doi: 10.1007/s11695-010-0170-7. [DOI] [PubMed] [Google Scholar]
- 62.van Leiden HA, Dekker JM, Moll AC, et al. Blood pressure, lipids, and obesity are associated with retinopathy: the Hoorn study. Diabetes Care. 2002;25(8):1320–1325. doi: 10.2337/diacare.25.8.1320. [DOI] [PubMed] [Google Scholar]
- 63.Jew OM, Peyman M, Chen TC, Visvaraja S. Risk factors for clinically significant macular edema in a multi-ethnics population with type 2 diabetes. International Journal of Ophthalmology. 2012;5(4):499–504. doi: 10.3980/j.issn.2222-3959.2012.04.18. [DOI] [PMC free article] [PubMed] [Google Scholar]
- 64.Zoppini G, Negri C, Stoico V, Casati S, Pichiri I, Bonora E. Triglyceride-high-density lipoprotein cholesterol is associated with microvascular complications in type 2 diabetes mellitus. Metabolism. 2012;61(1):22–29. doi: 10.1016/j.metabol.2011.05.004. [DOI] [PubMed] [Google Scholar]