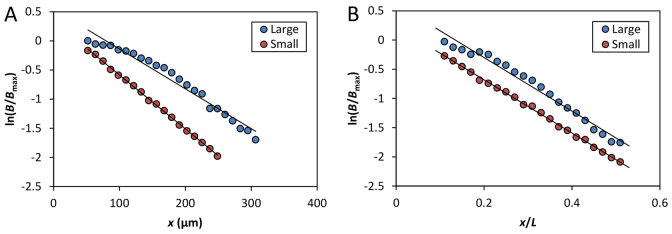
Fig. 3.

Evaluation of the relationship between Bcd profile’s length constant and embryo length. (A,B) Shown are semi-log scatter plots of mean B from the indicated embryos as a function of x (A) or x/L (B). B is normalized to their respective maximal mean intensity, Bmax. The x/L range of 0.1-0.5 was used to reduce effects of experimental errors in posterior and non-exponential shape in anterior. Linear fits (shown as solid black lines) in A are: y=-0.0071x + 0.60 (R2=0.97) and y=-0.0092x + 0.34 (R2=0.99) for the large and small embryos, respectively. In B, they are: y=-4.58x + 0.62 (R2=0.97) and y=-4.55x + 0.23 (R2=0.99), respectively.
