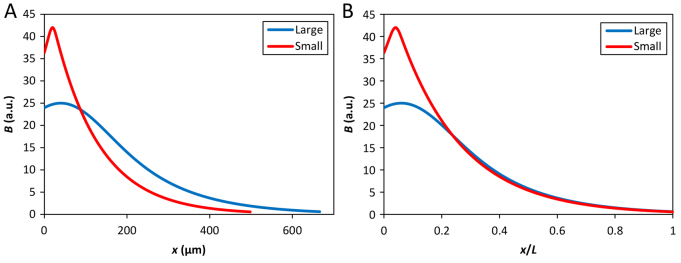
Fig. 5.

Evaluating the impact of bcd RNA distribution on Bcd gradient formation in a theoretical model. (A,B) Bcd profiles of the large (blue) and small (red) embryos as steady-state concentrations (a.u.) based on equation 14 in Dalessi et al. (Dalessi et al., 2012), plotted as a function of x (A) or x/L (B). In the Dalessi et al. model, the ‘spread’ of a normally distributed source is characterized by σ (in units of L). σ=0.12 and 0.01 was used for the large and small embryos, respectively. The respective ‘center’ locations of the source (in units of L) were assigned as 0.06 and 0.04, and experimental estimates of L=666 μm and 498 μm, and λ/L=0.22 (for both embryos) were used. The production rates for the large and small embryos (in units of their respective decay rates) were estimated according to the observed Bmax ratio (′25:42). The ratio of the detected bcd mRNA intensities in the large and small embryos (7.27:3.70) allowed the calculation of the ratios of both the diffusion constants (3.2) and decay rates (1.8). The results shown were based on an analysis by Sascha Dalessi and Sven Bergmann and the computer code that they had generated (personal communication).
