

Abstract
Background & Aims
With the increasing prevalence of liver disease worldwide, there is an urgent clinical need for reliable methods to diagnose and stage liver pathology. Liver biopsy, the current gold standard, is invasive and limited by sampling and observer dependent variability. In this study, we aimed to assess the diagnostic accuracy of a novel magnetic resonance protocol for liver tissue characterisation.
Methods
We conducted a prospective study comparing our magnetic resonance technique against liver biopsy. The individual components of the scanning protocol were T1 mapping, proton spectroscopy and T2⁎ mapping, which quantified liver fibrosis, steatosis and haemosiderosis, respectively. Unselected adult patients referred for liver biopsy as part of their routine care were recruited. Scans performed prior to liver biopsy were analysed by physicians blinded to the histology results. The associations between magnetic resonance and histology variables were assessed. Receiver-operating characteristic analyses were also carried out.
Results
Paired magnetic resonance and biopsy data were obtained in 79 patients. Magnetic resonance measures correlated strongly with histology (rs = 0.68 p <0.0001 for fibrosis; rs = 0.89 p <0.001 for steatosis; rs = −0.69 p <0.0001 for haemosiderosis). The area under the receiver operating characteristic curve was 0.94, 0.93, and 0.94 for the diagnosis of any degree of fibrosis, steatosis and haemosiderosis respectively.
Conclusion
The novel scanning method described here provides high diagnostic accuracy for the assessment of liver fibrosis, steatosis and haemosiderosis and could potentially replace liver biopsy for many indications. This is the first demonstration of a non-invasive test to differentiate early stages of fibrosis from normal liver.
Abbreviations: MR, Magnetic Resonance; BMI, Body Mass Index; NAFLD, Non-Alcoholic Fatty Liver Disease; CPA, Collagen Proportionate Area; CoV, Coefficient of Variance; 1H MRS, Proton Magnetic Resonance Spectroscopy; shMOLLI, shortened Modified Look Locker Inversion; HLC, Hepatic Lipid Content; ROI, Region of interest; ANOVA, Analysis of Variance; AUROC, Area Under the Receiver Operating Characteristic Curve
Keywords: Magnetic resonance T1 mapping, Proton magnetic resonance spectroscopy, Magnetic resonance T2⁎ mapping, Iron corrected T1, Liver fibrosis, Liver steatosis, Liver haemosiderosis
Introduction
Over 10% of adults in Western populations have some degree of liver disease [1], [2]. The increasing prevalence of obesity, alcohol-related liver disease, and viral hepatitis has led to an epidemic of progressive liver disease and cirrhosis.
There is a pressing need for a reliable diagnostic tool to identify early stages of liver disease and to target therapies to those patients who may benefit from these (e.g., antiviral therapy in progressive hepatitis C). Liver biopsy, the current ‘gold-standard’, carries a significant risk of serious bleeding complications and is costly. Furthermore, a biopsy allows examination of only 0.002% of the liver, and there is great intra- and inter-observer variability in histological interpretation, such that many argue liver biopsy is not a true gold-standard [3]. Consequently, there is a real clinical need for non-invasive tools to evaluate and monitor liver disease.
Transient elastography, which in Europe is increasingly used in clinical practice, can only accurately diagnose cirrhosis and has limited utility in obesity [4]. Tests based on serum markers have been mainly studied in preselected populations – when applied to mixed cohorts they were found to lack sensitivity, particularly in differentiating early stages of disease [5].
We present a proof-of-principle study, describing a novel magnetic resonance (MR) protocol that can be performed without intra-venous contrast on existing scanners. MR methods are ideally suited for tissue characterisation as they can sample the entire liver quickly, and are safe, reproducible, and widely available. Using multiparametric MR, we were able to objectively quantify hepatic fibrosis, steatosis and haemosiderosis, an important step towards a safer alternative to liver biopsy.
Patients and methods
Study design and population
This was a prospective, comparative, non-randomised, study of a new diagnostic MR method to evaluate liver disease. The designated reference standard was histological assessment of liver fibrosis, steatosis and haemosiderosis. From March 2011 to May 2013, we invited all patients referred for liver biopsy at two UK study centres (Oxford and Reading), to take part, except for those with contraindications to MR scanning. 90 patients consented to participate. Two were unable to undergo MR investigation due to claustrophobia, and nine did not have liver biopsy within six months of consent, leaving 79 patients for the final analysis (baseline characteristics in Table 1). The study protocol is shown in Fig. 1. Reference MR data were also collected from seven healthy volunteers with no known liver disease and BMI <25 kg/m2 (Supplementary Table 1).
Table 1.
Baseline characteristics of the 79 patients included in the final analysis.
 |
Values shown as median with IQR unless stated otherwise. Shapiro-Wilk test for normality used.
SH, steatohepatitis; A1AT, Alpha-1-Antitrypsin Deficiency; PSC, primary sclerosing cholangitis; PBC, primary biliary cirrhosis.
Fig. 1.

Study protocol with examples of normal and abnormal MR measurements. The images show MR T1 maps from patients with no liver fibrosis on biopsy (A) and cirrhosis (B) and MR T2⁎ maps from patients with negative Perls’ stain for iron (C) and grade 1 haemosiderosis (D). T1 and T2⁎ measured in milliseconds are translated into colours according to the shown pre-specified colour scales. Water-unsuppressed 1H MR spectra from a patient with steatosis grade 0 (E), and steatosis grade 3 (F) also shown. MRI, magnetic resonance imaging; cT1, iron-corrected T1; HIC, hepatic iron content; HLC, hepatic lipid content; 1H MRS, 1H magnetic resonance spectroscopy. ⁎Liver.
MR operators were blinded to the indication for liver biopsy and to the patients’ clinical details. MR data were analysed prior to histological reporting. The histopathologists were blinded to the MR data. Histological measures of steatosis, fibrosis and haemosiderosis were then compared to the non-invasive MR measures of the same parameters.
The study protocol conforms to the ethical guidelines of the 1975 Declaration of Helsinki, and was approved by the institutional research departments and the National Research Ethics Service (11/H0504/2). The study was registered with clinicaltrials.gov (NCT01543646). All patients and volunteers gave written informed consent.
Histological interpretation of liver biopsy samples
The median biopsy length after processing was 20 mm (IQR 16-30) and each biopsy contained a median of 10 (IQR 8-15) portal tracts. All biopsies were included in the final analysis. As there is considerable inter-observer variation in reporting of liver biopsy [6], [7], samples from 65 patients were assessed by three independent expert liver histopathologists (LMW, DWD, & KAF).
All samples were assessed for fibrosis by Ishak stage (F0–F6) [8]. For this study mild fibrosis was defined as Ishak F1–F2, moderate fibrosis as Ishak F3–F4, and severe fibrosis as Ishak ⩾F5. In cases where the biopsy showed steatohepatitis (n = 36), subgroup analysis was performed comparing MR data against the NAFLD Fibrosis Stage (F0–F4) [9]. In 54 biopsy samples available for this, collagen proportionate area (CPA) was also assessed by analysis of digital images using ImageJ (see Supplementary Methods for details).
Hepatic lipid content was measured by determining the percentage of hepatocytes with visible lipid vesicles. This was graded as 0 (<5%), 1 (5- <33%), 2 (33- <66%) and 3 (>66%), as described by Brunt [10].
Stainable iron was estimated using a Perls’ histochemical stain and semi-quantified using a five tier grading system (0: no haemosiderosis to 4: severe haemosiderosis) [11].
Inter-observer variability between the three histology measurements for steatosis, fibrosis and haemosiderosis was determined using weighted kappa statistics. The final histology scores for all 79 patients were determined by consensus agreement.
Magnetic resonance protocol
All MR scans were performed in Oxford with the patient lying supine in a 3 Tesla system (Tim Trio, Siemens Healthcare, Germany). Patients attended for their scans having fasted for at least 4 h. The average scan time for this protocol was 23 min. For the assessment of repeatability, T1 and T2⁎ maps were acquired in ten volunteers on two occasions within a week. The mean coefficients of variance (CoV) for T1, T2⁎, and cT1 (see below) were calculated. 1H MRS using this protocol has previously been determined to have a CoV of 4.8% [12]. A more detailed description of the MRI methods and MR acquisition parameters is included in the Supplementary Methods.
Fibrosis (extracellular water) imaging
A T1 relaxation time map was acquired using the shortened Modified Look Locker Inversion (shMOLLI) recovery sequence in a transverse plane of the liver [13]. This sequence samples the T1 recovery curve using single-shot balanced steady state free precession acquisitions. There is a quality assurance component – each acquisition generates an R2 map for the fit of signal intensity to the exponential recovery curve [14]. For this study, an image was only considered for interpretation if the R2 was ⩾99% which was the case in all patients.
Hepatic steatosis measurement with 1H MRS
Hepatic lipid content (HLC) can be quantified using localised cardiac-triggered proton spectroscopy [15]. HLC as a percentage of the liver water content using 1H MRS was measured with water suppression in an 8 cm3 voxel, avoiding vascular and biliary structures.
Iron content imaging
A multi-gradient-echo acquisition was used to calculate a T2⁎ map of the liver in a single plane with a slice thickness of 3 mm. Two patients had iron overload too severe to be accurately quantified using this protocol, with T2⁎ <2 ms in each case.
MR image analysis
MRI – Data were analysed by physicians blinded to the clinical information, using software tools available on the scanner console. For each patient, a single Region of Interest (ROI) was selected on the transverse T1 and T2⁎ maps, corresponding to segment 8 of the liver, from where most percutaneous biopsies are taken. The tissue volume assessed in each ROI is between 25–30 ml (compared to 0.05–0.08 ml in a liver biopsy). Each ROI contained between 100–200 pixels each, returning a T1 and T2⁎ value for the liver area corresponding to that pixel. Mean T1 and T2⁎ values were recorded for each ROI and used in the final analysis (see also Supplementary Fig. 1).
MRS data were analysed offline, using AMARES in the jMRUI package and customised software running within MATLAB 2010b, as previously described.15 HLC was expressed as % of water signal.
Correction for iron
The T1 measurements in this work aim to detect the presence of elevated extracellular water, reflected in an increased T1 value. However, the presence of excess iron competes with this effect, reducing T1. Further, the shMOLLI method is affected by T2 and T2⁎, which are reduced with elevated iron levels. In an interim analysis of the data, we found that a substantial proportion of patients had elevated liver iron levels, and we therefore developed a method to correct for this confounder. Elevated iron concentrations can be determined accurately from the T2⁎ maps. The T1 measurements provide an estimate of the extracellular water content, and thus it is necessary to remove the bias introduced by the elevated iron. To do this, the shMOLLI sequence was modelled using a Bloch simulation for varying extracellular fluid and iron concentrations, and a correction algorithm was generated [16]. This was then used to remove the effects of elevated iron from the T1 measurements, yielding an ‘iron-corrected T1’ (cT1; the T1 that would be measured using the shMOLLI sequence at a normal iron level; 1.3 mg/g) for the chosen ROI. Iron-corrected T1 could not be estimated in two patients with severe iron overload (T2⁎ <2ms), leaving 77 patients with paired MR and histology data for fibrosis assessment.
Statistical analysis
Descriptive statistics were used to summarise subject characteristics. Summary data were calculated for different stages of fibrosis, steatosis and the presence or absence of haemosiderosis. ANOVA with Bonferroni’s correction for multiple comparisons was used to determine significant differences between mean values for categories among normally-distributed continuous variables. Normality was determined by use of the Shapiro-Wilk test. Spearman (rs), and Pearson’s correlations (r) were calculated to test associations between categorical and continuous variables, respectively. To determine the diagnostic utility of MR for assessing liver fibrosis, receiver-operating characteristic analyses were carried out using GraphPad Prism 5 software.
Results
Hepatic fibrosis and T1 mapping
The mean corrected T1 for the 7 healthy volunteers was 717 ± 48 ms which was similar to the mean cT1 in patients with no fibrosis on liver biopsy (F0; n = 7; cT1 750 ± 42 ms; p = 0.20). For all subjects cT1 strongly correlated with increasing liver fibrosis [cT1 vs. Ishak (n = 84): rs = 0.68, p <0.0001; Fig. 2 and cT1 vs. CPA (n = 54): r = 0.54, p <0.0001]. Furthermore, there were significant differences in cT1 among all stages, except between mild and moderate fibrosis (Fig. 2 and Table 2).
Fig. 2.

cT1 values in 77 patients and 7 healthy volunteers (presumed with no fibrosis) plotted against their biopsy proven fibrosis stage. Iron-corrected T1 (cT1) correlates with the degree of fibrosis in all subjects (rs = 0.68, p <0.0001, 95% CI 0.54–0.78). Mean ± SD cT1 for each group was as follows: healthy volunteers 717 ± 48 ms, no fibrosis 750 ± 42 ms (those two are grouped as “normal liver”), mild fibrosis 870 ± 104 ms, moderate 873 ± 63 ms, and severe 1025 ± 102 ms. ANOVA with Bonferroni’s correction showed significant differences (⁎⁎⁎) between all groups apart from mild vs. moderate fibrosis (n.s., not significant; Table 2). Liver biopsy patients are shown as red dots, and healthy volunteers as blue squares.
Table 2.
One Way Analysis of Variance (ANOVA) with Bonferroni’s correction for comparison between disease severity groups, for all subjects with cT1 (n = 84) showing significant differences between all groups except mild fibrosis (F1–2) vs. moderate fibrosis (F3–4).
 |
n.s., not significant.
In discriminating healthy volunteers and patients with no fibrosis on liver biopsy from those with any degree of fibrosis (Ishak ⩾F1), cT1 had an Area Under the Receiver Operating Characteristic (AUROC) of 0.94 (p <0.0001, 95% CI 0.90–0.99), with a sensitivity of 86% and a specificity of 93% at a threshold of 800 ms (Supplementary Fig. 4).
When the two main aetiologies were assessed separately, i.e., viral hepatitis (n = 31; rs = 0.76, p <0.0001) and steatohepatitis (n = 36; rs = 0.62, p <0.0001), cT1 correlated closely with their respective disease-specific fibrosis scoring systems (Supplementary Fig. 5). There was also strong correlation with CPA [for viral hepatitis (n = 18): r = 0.86, p <0.0001 and for steatohepatitis (n = 22): r = 0.57, p = 0.0061]. Moreover, cT1 clearly identified patients with fibrosis (Viral hepatitis AUROC 0.92, p = 0.019, 95% CI 0.79–1.05; steatohepatitis AUROC 0.90, p = 0.0096, 95% CI 0.79–1.01). Fig. 3 shows transverse MR T1 maps of four patients with chronic viral hepatitis, and corresponding liver biopsies. Increasing fibrosis is reflected in a higher T1 graphically on the colour scale, and can also be estimated quantitatively in milliseconds as cT1.
Fig. 3.

Viral hepatitis fibrosis staging with MR T1 mapping and iron-corrected T1 measurements in the regions of interest. Examples of transverse liver MR T1 maps from 4 patients with viral hepatitis (left column). The white circles indicate typical areas of interest corresponding to tissue volume of 25–30 ml, where the T1 and T2⁎ would be measured in order to estimate cT1, which is included for each patient. The corresponding liver biopsy slides stained with Sirius Red for fibrosis (Ishak F0–F6; magnification 4×) for each patient are shown for comparison (right column). The appearance of the MR T1 map and the quantitative measure of fibrosis (cT1), clearly correlate with the degree of fibrosis as assessed by the Ishak score.
Hepatic steatosis and 1H MRS
Rapid spectroscopy measurement of HLC correlated strongly with semi-quantitative steatosis scores (Fig. 4; rs = 0.89, p <0.0001). In distinguishing patients with a Brunt steatosis score of 0 from those with scores ⩾1, MRS had an AUROC of 0.93 (95% CI 0.87–0.99, p <0.0001). MRS thresholds of 1.5% and 7.5% of the water signal identified histologically visible steatosis (Brunt ⩾1; sensitivity 85%, specificity 100%) and severe steatosis (Brunt >2; sensitivity 100%, specificity 97%), respectively. There was strong correlation with quantitative histology scores of steatosis and very little variance of HLC in the left and right lobes of the liver (Supplementary Fig. 6).
Fig. 4.
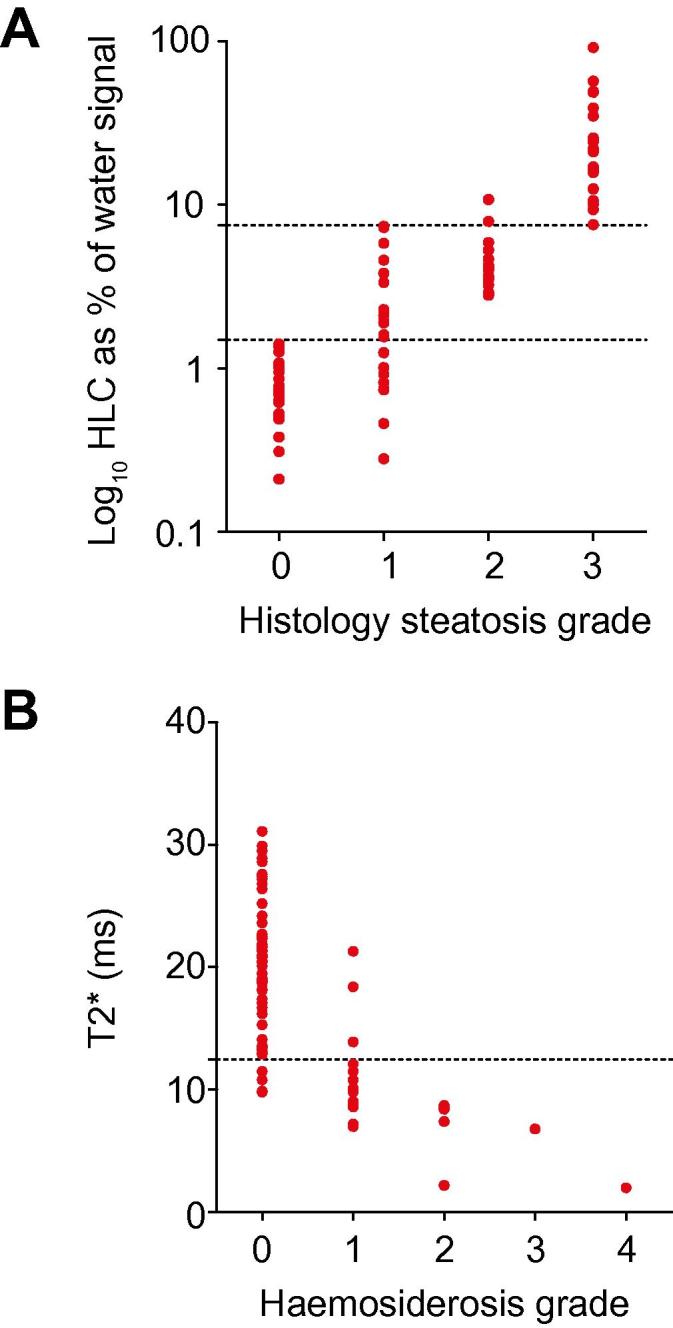
The assessment of hepatic steatosis with1H MRS and hepatic haemosiderosis with T2⁎ mapping. (A) There was a very strong correlation between steatosis grade hepatic lipid content measured by 1H MRS (rs = 0.89, p <0.0001). MRS thresholds of 1.5% and 7.5% steatosis respectively identified a steatosis grade of ⩾1 (sensitivity 80%, specificity 100%) and a steatosis grade of >2 (sensitivity 100%, specificity 97%). (B) There was a strong negative correlation between histological grading of iron deposition and T2⁎ (rs = −0.69, p <0.0001, 95% CI −0.79 to −0.55). A T2⁎ cut off at 12.5 ms identified any degree of haemosiderosis with a sensitivity of 86% and a specificity of 93%.
Hepatic iron content and T2⁎
Hepatic iron content showed a strong negative correlation with T2⁎ (rs = −0.69, p <0.0001; Fig. 4). In distinguishing patients with stainable iron from those without, T2⁎ had an AUROC of 0.94 (95% CI 0.87–1.00, p <0.0001). For the diagnosis of any degree of haemosiderosis, a T2⁎ threshold of 12.5 ms had a sensitivity of 86% and a specificity of 93%.
Inter-observer variance in histopathological assessment
Liver biopsies from 65 patients were independently reported by three pathologists, blinded to the clinical data and previous pathological reports. There was good agreement for the assessment of steatosis (kappa = 0.72), but only modest agreement in the assessment of fibrosis (kappa = 0.58) and haemosiderosis (kappa = 0.58), most notably in the classification of mild and moderate disease (Supplementary Table 2). The agreement achieved here is better than in previously reported studies [6], [7].
Repeatability of MR measures
The mean coefficient of variance (CoV) over 10 normal volunteers was 1.3% for T1 maps, 8.4% for T2⁎ maps and 1.8% for the combined cT1 metric, showing good repeatability. 1H MRS CoV was previously shown to be 4.8% [12].
Discussion
With the global epidemic of steatohepatitis (both alcoholic and non-alcoholic), and the reported 450 million worldwide with viral hepatitis, there is a pressing need for an accurate, quick and simple diagnostic test to determine the type and degree of liver disease. The new method of liver assessment by multiparametric MR imaging and spectroscopy described here provides detailed non-invasive tissue characterisation of a large sample of liver parenchyma, and can identify and quantify fibrosis, steatosis and iron content, quickly and safely, with a high degree of sensitivity and specificity.
Our MR protocol objectively quantifies biomarkers for fibrosis, steatosis and haemosiderosis, all of which are essential components of the characterisation of liver tissue on biopsy. The assessment of hepatic fibrosis with this technique is especially strong because it can differentiate those with any degree of fibrosis from those with normal livers and those with severe fibrosis from those with mild or moderate disease in an unselected patient population, something that has not been shown previously. Current alternative techniques for non-invasive fibrosis measurement have only been tested on pre-selected populations [5], [17], [18], [19], [20]. Elastography (based on either ultrasound or MRI) is limited in obese patients and subjects with ascites. Serum markers of hepatic fibrosis are sensitive, but not specific, and have not been tested in general populations with coexisting fibrosis in other organs. Our T1 mapping method is unaffected by the degree of adiposity or the presence of ascites, unlike acoustic-based techniques such as elastography, and also has the potential to demonstrate which parts of the liver are affected or spared.
The earliest work suggesting the concept that T1 relates to the degree of liver fibrosis was reported in 1981 [21] but subsequent studies failed to show any clear relationship [22], [23]. Recently, with the development of robust single breath-hold T1 mapping techniques, interest in the field has increased again [24], [25]. However, these previous studies have limited clinical applicability, as they did not assess iron and fibrosis in an unselected population. Crucially, the importance of iron-compensation in determining the true relationship between T1 and fibrosis has not been shown before. Our study, for the first time, suggests that MR T1 mapping may be a practical method for fibrosis assessment in nearly all-comers (77/79 in our study) for liver biopsy.
Measurement of hepatic lipid content by MR methods has been described before, based on 1H-MRS or Dixon-type MRI, the current consensus being that MRS is the most accurate method [26], [27]. We thus opted for an MRS approach in our multiparametric protocol, and have further refined existing MRS methods by using rapid breath-hold spectroscopy. We have also demonstrated that fat was fairly equally distributed in the liver (Supplementary Fig. 2), as previously described [28].
The assessment of iron content with T2⁎-sensitive MR has been used in clinical practice for the management of inherited and acquired iron storage disorders [29], but has not been utilised in a general population before. Our data confirm previous findings of T2⁎ correlation with stainable iron levels on biopsy [30].
The real innovation our study brings is that all the above information is generated from one 23 min MRI scan that can be applied to a general patient population referred for liver biopsy, and that the T1 fibrosis measurement is made generally applicable by an iron correction algorithm. In 51/77 (66%) of patients, a correction of ⩾20 ms in the measured T1 had to be made. Our patient group was heterogeneous, and no category was excluded from participation. It is clear from our analysis that this heterogeneity has impacted on the overall results as the correlations with CPA are higher when different aetiologies are considered separately (r = 0.54 for all patients, r = 0.57 for steatohepatitis and r = 0.86 for viral hepatitis). Despite this, our results are generalisable to an adult population with suspected liver disease, and our technique may prove of particular use in patients with coexisting pathology, such as viral hepatitis and non-alcoholic steatohepatitis. Currently, there are separate histological scoring systems for these pathologies. Consequently, interpretation and comparison are difficult, even before sampling and inter-observer variations are considered. In contrast, the method presented here correctly identified patients with both steatosis and fibrosis, regardless of aetiology, and is highly repeatable.
Future work
As a truly quantitative non-invasive technique for the characterisation of liver tissue, this methodology has the potential for the safe longitudinal assessment and prediction of disease progression and regression and/or response to therapy, without the need for repeat liver biopsy. This has not been feasible in the past, and opens up many possibilities for research and clinical use into new therapeutic strategies for hepatic and metabolic conditions. For example, the degree of liver damage caused by alcohol and dietary excess may be quantified over time providing a much safer means to monitor alcohol related liver disease and non-alcoholic steatohepatitis. The method will also enable studies to assess regional variations throughout the liver, which is of particular interest in conditions with patchy fibrosis, such as primary sclerosing cholangitis and primary biliary cirrhosis. Future studies will have to assess the value of this method in a multicentre format and also determine whether MRI assessment of liver fibrosis by cT1 measurements predicts patient outcome. The results of these studies will determine whether it is possible for multiparametric MR assessment of the liver to eventually replace liver biopsy for the staging of fibrosis and grading of steatosis and haemosiderosis.
Study limitations
This was a study of unselected patients attending for liver biopsy, which showed clear separation between all groups except between mild vs. moderate fibrosis. Given its small size, it only demonstrates initial proof-of-principle. Limitations include factors related to the MR technique and to the use of biopsy as a reference standard.
MR methodological limitations include the fact that two of our patients had massive haemosiderosis, with T2⁎ <2 ms, which did not allow for the estimation of cT1 to determine the degree of fibrosis. Our method worked correctly in 77/79 patients and, in practical terms, T2⁎ values of <2 ms immediately indicate the presence of marked haemosiderosis, but still requiring histological assessment of fibrosis. In addition cT1 is a marker of extracellular water content, which can rise with oedema in the acute setting or fibrosis in chronic illness, or both if there is acute insult to a fibrotic liver. However, interpretation based on the clinical picture, history, and routine serum biochemistry from the patient can guide the observer towards the correct choice between acute and/or chronic liver disease. Our MR maps for T1 and T2⁎ covered one large transverse slice, but may have missed patchy disease occurring in other planes. Further refinement to obtain whole-liver analysis may address this, but will have to be balanced against the cost-effectiveness of longer acquisition times. Finally applicability at other field strengths, in particular 1.5T, need to be demonstrated.
Percutaneous liver biopsy is not an ideal reference standard for fibrosis, steatosis or haemosiderosis. We have included all biopsies in the final analysis irrespective of their length or number of portal tracts and this may have affected the accuracy of histological assessment. We assessed inter-observer variance by comparing scores from three blinded pathologists. Although their agreement was in keeping with previous published studies [6], trivariate weighted kappa of 0.58 for fibrosis assessment suggests only moderate concordance. For uniformity, the Ishak score was used to evaluate fibrosis in all patients irrespective of their final diagnosis, including patients with coexistent disease. This may have underestimated the burden of disease due to pericellular fibrosis, particularly in patients with steatohepatitis. As we designed a study for all-comers for liver biopsy, patients with vascular liver pathology (e.g., hepatic venous outflow obstruction) or acute hepatitis in patients with chronic liver disease, who would be expected to have higher cT1 due to liver congestion or inflammation, were also included. In this situation, cT1 likely overestimates the degree of chronic fibrosis. Furthermore, the liver volume (0.05–0.08 ml) for histological analysis of fibrosis was nearly 3 orders of magnitude smaller than the volume for MR analysis (25–30 ml). Thus, even a perfect non-invasive technique would not necessarily be expected to achieve a higher correlation with histology than that observed here, and the correlation coefficient observed between MRI and biopsy estimates of fibrosis (rs = 0.68) is remarkably high in light of these limitations.
Larger studies will have to assess the value of this new method for distinguishing mild from moderate fibrosis for subtypes of chronic liver disease, and these may require more selected populations.
Conclusions
We describe a new, accurate and safe method to characterise the severity and type of liver disease, thus aiding diagnosis and staging. The non-invasive data generated closely correlate with liver biopsy measurements of steatosis, haemosiderosis and fibrosis, as demonstrated in this prospective, blinded study in an unselected liver biopsy population. MR is increasingly accessible, and this technique should now be validated in clinical multicentre studies to further define its clinical use for assessing chronic liver disease in adults and children.
Financial support
Supported by the British Heart Foundation (BHF Clinical Research Training Fellowship FS/08/074/26233) and by the Oxford NIHR Biomedical Research Centre. E.B. is funded by the Medical Research Council UK.
Conflict of interest
R.B., M.D.R., and S.N. are on the board of directors and shareholders of Perspectum Diagnostics, an Oxford University spin-out company. M.P., E.B., E.M.T., and J.E.S. are shareholders of Perspectum Diagnostics. R.B., M.D.R., S.K.P., S.N., E.M.T., E.B. have filed three patent applications related to the use of multiparametric M.R. for the diagnosis of chronic liver disease.
Acknowledgements
Supported by the British Heart Foundation (BHF Clinical Research Training Fellowship FS/08/074/26233) and by the Oxford NIHR Biomedical Research Centre. E.B. is funded by the Medical Research Council UK.
Footnotes
Supplementary data associated with this article can be found, in the online version, at http://dx.doi.org/10.1016/j.jhep.2013.09.002.
Supplementary data
References
- 1.Blachier M., Leleu H., Peck-Radosavljevic M., Valla D.-C., Roudot-Thoraval F. The burden of liver disease in Europe: a review of available epidemiological data. J Hepatol. 2013;58:593–608. doi: 10.1016/j.jhep.2012.12.005. [DOI] [PubMed] [Google Scholar]
- 2.Younossi Z.M., Stepanova M., Afendy M., Fang Y., Younossi Y., Mir H. Changes in the prevalence of the most common causes of chronic liver diseases in the United States from 1988 to 2008. Clin Gastroenterol Hepatol. 2011;9:524–530. doi: 10.1016/j.cgh.2011.03.020. [DOI] [PubMed] [Google Scholar]
- 3.Poynard T., Lenaour G., Vaillant J.C., Capron F., Munteanu M., Eyraud D. Liver biopsy analysis has a low level of performance for diagnosis of intermediate stages of fibrosis. Clin Gastroenterol Hepatol. 2012;10:657–663. doi: 10.1016/j.cgh.2012.01.023. [DOI] [PubMed] [Google Scholar]
- 4.Tsochatzis E.A., Gurusamy K.S., Ntaoula S., Cholongitas E., Davidson B.R., Burroughs A.K. Elastography for the diagnosis of severity of fibrosis in chronic liver disease: a meta-analysis of diagnostic accuracy. J Hepatol. 2011;54:650–659. doi: 10.1016/j.jhep.2010.07.033. [DOI] [PubMed] [Google Scholar]
- 5.Friedrich-Rust M., Rosenberg W., Parkes J., Herrmann E., Zeuzem S., Sarrazin C. Comparison of ELF, FibroTest, and FibroScan for the non-invasive assessment of liver fibrosis. BMC Gastroenterol. 2010;10:103. doi: 10.1186/1471-230X-10-103. [DOI] [PMC free article] [PubMed] [Google Scholar]
- 6.Grønbaek K., Christensen P.B., Hamilton-Dutoit S., Federspiel B.H., Hage E., Jensen O.J. Interobserver variation in interpretation of serial liver biopsies from patients with chronic hepatitis C. J Viral Hepat. 2002;9:443–449. doi: 10.1046/j.1365-2893.2002.00389.x. [DOI] [PubMed] [Google Scholar]
- 7.Regev A., Berho M., Jeffers L.J., Milikowski C., Molina E.G., Pyrsopoulos N.T. Sampling error and intraobserver variation in liver biopsy in patients with chronic HCV infection. Am J Gastroenterol. 2002;97:2614–2618. doi: 10.1111/j.1572-0241.2002.06038.x. [DOI] [PubMed] [Google Scholar]
- 8.Ishak K., Baptista A., Bianchi L., Callea F., De Groote J., Gudat F. Histological grading and staging of chronic hepatitis. J Hepatol. 1995;22:696–699. doi: 10.1016/0168-8278(95)80226-6. [DOI] [PubMed] [Google Scholar]
- 9.Kleiner D.E., Brunt E.M., Van Natta M., Behling C., Contos M.J., Cummings O.W. Design and validation of a histological scoring system for nonalcoholic fatty liver disease. Hepatology. 2005;41:1313–1321. doi: 10.1002/hep.20701. [DOI] [PubMed] [Google Scholar]
- 10.Brunt E.M., Janney C.G., Di Bisceglie A.M., Neuschwander-Tetri B.A., Bacon B.R. Nonalcoholic steatohepatitis: a proposal for grading and staging the histological lesions. Am J Gastroenterol. 1999;94:2467–2474. doi: 10.1111/j.1572-0241.1999.01377.x. [DOI] [PubMed] [Google Scholar]
- 11.Scheuer P.J., Williams R., Muir A.R. Hepatic pathology in relatives of patients with haemochromatosis. J Pathol Bacteriol. 1962;84:53–64. [PubMed] [Google Scholar]
- 12.Rial B. Development of proton magnetic resonance spectroscopy in human heart at 3 Tesla. In: University of Oxford Doctoral thesis; 2010.
- 13.Piechnik S.K., Ferreira V.M., Dall’Armellina E., Cochlin L.E., Greiser A., Neubauer S. Shortened modified look-locker inversion recovery (ShMOLLI) for clinical myocardial T1-mapping at 1.5 and 3 T within a 9 heartbeat breathhold. J Cardiovasc Magn Reson. 2010;12:69. doi: 10.1186/1532-429X-12-69. [DOI] [PMC free article] [PubMed] [Google Scholar]
- 14.Ferreira V.M., Piechnik S.K., Dall’Armellina E., Karamitsos T.D., Francis J.M., Choudhury R.P. Non-contrast T1-mapping detects acute myocardial edema with high diagnostic accuracy: a comparison to T2-weighted cardiovascular magnetic resonance. J Cardiovasc Magn Reson. 2012;14:42. doi: 10.1186/1532-429X-14-42. [DOI] [PMC free article] [PubMed] [Google Scholar]
- 15.Rial B., Robson M.D., Neubauer S., Schneider J.E. Rapid quantification of myocardial lipid content in humans using single breath-hold 1H MRS at 3 Tesla. Magn Reson Med. 2011;66:619–624. doi: 10.1002/mrm.23011. [DOI] [PMC free article] [PubMed] [Google Scholar]
- 16.Tunnicliffe E. Evaluating liver fibrosis in the presence of elevated iron using MR relaxometry. In: UK Provisional Patent No. 1304728.7 filed on 15th March; 2013.
- 17.Nobili V., Parkes J., Bottazzo G., Marcellini M., Cross R., Newman D. Performance of ELF serum markers in predicting fibrosis stage in pediatric non-alcoholic fatty liver disease. Gastroenterology. 2009;136:160–167. doi: 10.1053/j.gastro.2008.09.013. [DOI] [PubMed] [Google Scholar]
- 18.Rosenberg W.M., Voelker M., Thiel R., Becka M., Burt A., Schuppan D. Serum markers detect the presence of liver fibrosis: a cohort study. Gastroenterology. 2004;127:1704–1713. doi: 10.1053/j.gastro.2004.08.052. [DOI] [PubMed] [Google Scholar]
- 19.Mariappan Y.K., Glaser K.J., Ehman R.L. Magnetic resonance elastography: a review. Clin Anat. 2010;23:497–511. doi: 10.1002/ca.21006. [DOI] [PMC free article] [PubMed] [Google Scholar]
- 20.Sandrin L., Fourquet B., Hasquenoph J.M., Yon S., Fournier C., Mal F. Transient elastography: a new noninvasive method for assessment of hepatic fibrosis. Ultrasound Med Biol. 2003;29:1705–1713. doi: 10.1016/j.ultrasmedbio.2003.07.001. [DOI] [PubMed] [Google Scholar]
- 21.Smith F.W., Mallard J.R., Reid A., Hutchison J.M. Nuclear magnetic resonance tomographic imaging in liver disease. Lancet. 1981;1:963–966. doi: 10.1016/s0140-6736(81)91731-1. [DOI] [PubMed] [Google Scholar]
- 22.Aisen A.M., Doi K., Swanson S.D. Detection of liver fibrosis with magnetic cross-relaxation. Magn Reson Med. 1994;31:551–556. doi: 10.1002/mrm.1910310513. [DOI] [PubMed] [Google Scholar]
- 23.Alanen A., Komu M., Leino R., Toikkanen S. MR and magnetisation transfer imaging in cirrhotic and fatty livers. Acta Radiol. 1998;39:434–439. doi: 10.1080/02841859809172459. [DOI] [PubMed] [Google Scholar]
- 24.Kim K.A., Park M.S., Kim I.S., Kiefer B., Chung W.S., Kim M.J. Quantitative evaluation of liver cirrhosis using T1 relaxation time with 3 Tesla MRI before and after oxygen inhalation. J Magn Reson Imaging. 2012;36:405–410. doi: 10.1002/jmri.23620. [DOI] [PubMed] [Google Scholar]
- 25.Heye T., Yang S.R., Bock M., Brost S., Weigand K., Longerich T. MR relaxometry of the liver: significant elevation of T1 relaxation time in patients with liver cirrhosis. Eur Radiol. 2012;22:1224–1232. doi: 10.1007/s00330-012-2378-5. [DOI] [PubMed] [Google Scholar]
- 26.McPherson S., Jonsson J.R., Cowin G.J., O’Rourke P., Clouston A.D., Volp A. Magnetic resonance imaging and spectroscopy accurately estimate the severity of steatosis provided the stage of fibrosis is considered. J Hepatol. 2009;51:389–397. doi: 10.1016/j.jhep.2009.04.012. [DOI] [PubMed] [Google Scholar]
- 27.Meisamy S., Hines C.D., Hamilton G., Sirlin C.B., McKenzie C.A., Yu H. Quantification of hepatic steatosis with T1-independent, T2-corrected MR imaging with spectral modeling of fat: blinded comparison with MR spectroscopy. Radiology. 2011;258:767–775. doi: 10.1148/radiol.10100708. [DOI] [PMC free article] [PubMed] [Google Scholar]
- 28.Larson S.P., Bowers S.P., Palekar N.A., Ward J.A., Pulcini J.P., Harrison S.A. Histopathologic variability between the right and left lobes of the liver in morbidly obese patients undergoing Roux-en-Y bypass. Clin Gastroenterol Hepatol. 2007;5:1329–1332. doi: 10.1016/j.cgh.2007.06.005. [DOI] [PubMed] [Google Scholar]
- 29.Wood J.C. Magnetic resonance imaging measurement of iron overload. Curr Opin Hematol. 2007;14:183–190. doi: 10.1097/MOH.0b013e3280d2b76b. [DOI] [PMC free article] [PubMed] [Google Scholar]
- 30.Chandarana H., Lim R.P., Jensen J.H., Hajdu C.H., Losada M., Babb J.S. Hepatic iron deposition in patients with liver disease: preliminary experience with breath-hold multiecho T2⁎-weighted sequence. Am J Roentgenol. 2009;193:1261–1267. doi: 10.2214/AJR.08.1996. [DOI] [PubMed] [Google Scholar]
Associated Data
This section collects any data citations, data availability statements, or supplementary materials included in this article.