

Abstract
Objective
Two-thirds of older adults are currently classified as overweight or obese. Given that the importance of these weight categories was documented primarily in middle-aged persons, the survival and health status consequences for older adults are controversial. Here, we explore the issue of whether weight categories predict subsequent mortality and morbidity in older adults.
Design, Setting, and Participants
Data came from the Cardiovascular Health Study, a population-based cohort study of 5888 older adults.
Measurements
We estimated the age- and sex-specific probabilities of transition from one health state to another and from one weight category to another. From these probabilities we estimated future life expectancy, years of healthy life, active life expectancy, and the number of years spent in each weight and health category after age 65.
Results
Women who are healthy and of normal weight at age 65 have a life expectancy of 22.1 years. Of that, they spend, on average, 9.6 years as overweight or obese, and 5.3 years in fair or poor health. For both men and women, being underweight at age 65 was associated with worse outcomes than normal weight, while overweight and obesity were rarely worse than normal weight, and were sometimes associated with significantly better outcomes.
Conclusions
Similar to middle-aged populations, older adults are likely to be or to become overweight or obese. However, higher weight is not associated with worse health in this age group. Thus, the number of older adults at a “healthy” weight may be much higher than currently believed.
Keywords: self-rated health, equilibrium, activities of daily living, years of healthy life, active life expectancy, multi-state life tables, older adults
INTRODUCTION
The prevalence of obesity and overweight in the U.S. has grown markedly in recent decades, and two-thirds of adults are now classified as overweight or obese. [1,2] In middle aged persons, obesity is linked to important health problems such as early death, diabetes, and physical disability. [3-6] The relationships between weight and mortality are different for older adults. Obesity is an established risk factor for shortened survival in younger but not older adults [7, 8] and relative risks for mortality typically decline with increasing age. [9] The importance of overweight and obesity as predictors of health status in adults over age 65 has also been questioned. For example, Arterburn et al. found that overweight was associated with better health status and quality of life than normal weight in a study of older veterans. [10] Weight loss advice is routinely given to patients of all ages even though the literature does not support the idea that obesity or overweight are strong risk factors beyond age 65. Understanding the relation of weight to morbidity and mortality into old age has important implications for clinical decisions and public health policy. [11]
Future years of life, years of healthy life and active life expectancy are important outcome measures that can be estimated at the person level from longitudinal data. [12] Longitudinal data can also be used to estimate probabilities of transition among states defined by health and weight. Multi-state lifetable methods can then be used to estimate the expected number of future years spent in each state. The usual life table (with only 2 states, alive and dead) starts with a hypothetical population of 100,000 living persons and estimates, from age-specific death rates, the number who will be alive in the following year, the number alive in the year after that, and so on. A multi-state lifetable is similar, but the years in which persons area live are tabulated separately to indicate what health and weight state they are in. For example, for a hypothetical cohort of 100,000 healthy normal-weight 65-year-old women, we can estimate the number who will be healthy and normal-weight one year later at age 66. (This method is explained in more detail in the appendix).
A related approach was used by Vasan, et al., to estimate the risk of developing obesity from age 35 to 65. [13] That analysis, using data from the Framingham study, found that the long-term risk of a normal-weight person becoming overweight was 50% and the risk of becoming obese was 25%. The authors concluded that the future burden of obesity-associated diseases may thus be substantial. However, they did not estimate this burden, and their results may not apply to persons over age 65. In a similar study, Reynolds, et al. found that persons who were obese at age 70 had lower active life expectancy than non-obese persons. [14] That study did not examine transitions among weight categories.
The work presented here uses transition probabilities and multi-state life tables to examine concurrent changes in weight and health status over time in older adults. The objective is to further examine the relationship between weight and health after age 65. We address the question of whether “normal” weight, which is defined without reference to age, is indeed associated in older adults with the best health, as measured by total, healthy, and active life expectancy.
METHODS
Study Design: The Cardiovascular Health Study
The Cardiovascular Health Study (CHS) is a population-based longitudinal study of risk factors for heart disease and stroke in 5,888 adults aged 65 and older at baseline. [15] Participants were recruited from a random sample of Medicare eligibles in four U.S. communities, and extensive data were collected during annual clinic visits and telephone calls. Members of the original cohort of 5201 participants, recruited in 1989-90, had up to ten annual clinic examinations. A supplemental cohort of 687 African Americans, recruited in 1992-93, had up to seven annual examinations. Follow-up for cardiovascular events was virtually complete for surviving participants. [16]
Body Mass Index
Weight was measured every year and height was measured up to three times during follow-up. Body mass index (BMI) was calculated as weight in kilograms divided by the square of height in meters. A report from the National Heart, Lung, and Blood Institute classified normal weight, without reference to age, as a BMI of 18.5 to 24.9, overweight as 25 to 29.9, and obesity as 30 or higher. [17] We defined underweight as BMI<20 instead of 18.5, because a BMI of 18.5 to 20 was associated with higher mortality and fewer years of healthy life in an earlier analysis of CHS data. [12] This choice also increased the number of underweight persons for analysis.
Years of Life, Years of Healthy Life, and Active Life Expectancy
“Years of life” (YOL) was defined as the life expectancy from age 65 to death. “Years of healthy life” (YHL) was defined on the basis of self-rated health, a simple but well-known measure [18, 19] which has been found in many studies to predict health events in older adults. [20] At annual clinic visits, participants were asked to rate their health as excellent, very good, good, fair, or poor. We defined YHL as the expected number of years in which a person was “healthy” (in excellent, very good, or good health) versus “sick” (in fair or poor health). “Active Life Expectancy” (ALE) is defined as the expected number of years of future life spent with no difficulties in activities of daily living (ADL). [21] Participants were asked every year whether, due to health or physical problems, they had any difficulty walking around at home, getting out of bed or a chair, eating, bathing or showering, or using the toilet. A person with a positive response to any of these items was considered to have an ADL difficulty at that time. Linear interpolation was used to impute missing data when values were known at clinic visits before and after the missing value. This approach has been shown to perform well in CHS. [22] After imputation, data completeness increased from about 93 to 95 percent.
Analysis
This section describes the analysis of YHL, but ALE analyses were performed in the same manner. At each year of follow-up, each CHS participant was classified into one of four BMI states (underweight, normal, overweight, or obese) and one of two health states, healthy or sick (or with or without ADL difficulties for the analysis of ALE). Eight BMI*Health states are possible, ranging from “sick and underweight” to “healthy and obese”. Because we are following persons over time, we added a ninth state for death. The longitudinal data allowed us to create about 40,000 “transition pairs”, from age 65 to 95. A transition pair is an observation of two BMI and health states for the same person, one year apart. We estimated the age-sex-specific probability of transition from one BMI*Health state to another using linear discriminant analysis to predict the state next year as a function of the current state and the logarithm of age. The transition probabilities were estimated separately for each initial BMI*Health state and gender. We programmed a spreadsheet to perform multi-state life table calculations, and applied the program to eight hypothetical cohorts of 100,000 women, one for each BMI*Health state at age 65. The program calculated the expected number of women in each BMI*Health state at age 66, at age 67, and so on. Estimates were summed and divided by 100,000 to calculate expected YOL, YHL (or ALE), and years spent in each BMI category for each hypothetical cohort. We repeated these steps for men. More detail is provided in the appendix.
Bootstrap Standard Errors
To estimate the standard error of YOL, YHL, and ALE, we re-sampled the 5,888 persons 100 times (with replacement) and performed the entire set of calculations for each new dataset. The standard deviations among the 100 sample estimates of the various quantities were used in the final analysis to calculate approximate t statistics.
FINDINGS
Information about the 39,717 transitions between states defined by BMI and self-rated health is shown in Table 1. For example, the first row shows there were 581 transition pairs in which the person was sick and underweight in the first year. In 53% (308) of these pairs, the person remained sick and underweight 1 year later. For 13.1% (76) of the pairs, the person was dead one year later. Examination of this and the other rows shows that although persons were most likely to remain in the same state, there was substantial movement among states as well. Persons moved both from healthy to sick and from sick to healthy in the following year. Persons both gained and lost weight, although they rarely moved more than one BMI category in a single year.
Table 1. Transition Pairs: BMI and Health States (row percentages for men and women, ages 65-100, inclusive).
| -----------------------------------------State One Year Later (row %) ----------------------------- | ||||||||||
|---|---|---|---|---|---|---|---|---|---|---|
| %Dead | --------------% Sick and ---------------- | ------------- % Healthy and ------------- | ||||||||
| Initial State | Under- weight |
Normal | Over- weight |
Obese | Under- weight |
Normal | Over- weight |
Obese | Total (#) |
|
| Sick Underweight | 13.1 | 53.0 | 9.6 | 0.2 | 0.2 | 18.1 | 5.3 | 0.3 | 0.2 | 581 |
| Sick Normal | 9.0 | 4.2 | 51.7 | 5.7 | 0.1 | 1.2 | 25.0 | 3.2 | 0.0 | 2759 |
| Sick Overweight | 5.1 | 0.1 | 7.3 | 51.7 | 4.1 | 0.0 | 2.7 | 27.3 | 1.6 | 3352 |
| Sick Obese | 3.6 | 0.0 | 0.1 | 7.6 | 59.4 | 0.0 | 0.1 | 2.8 | 26.3 | 2228 |
|
Healthy
Underweight |
3.7 | 11.9 | 2.0 | 0.1 | 0.0 | 67.8 | 14.4 | 0.1 | 0.1 | 1288 |
| Healthy Normal | 1.8 | 0.7 | 8.4 | 0.8 | 0.0 | 2.4 | 77.0 | 8.9 | 0.0 | 10221 |
| Healthy Overweight | 1.3 | 0.0 | 1.5 | 8.0 | 0.6 | 0.0 | 6.9 | 77.9 | 3.9 | 13432 |
| Healthy Obese | 1.2 | 0.0 | 0.0 | 1.5 | 11.4 | 0.0 | 0.1 | 8.6 | 77.2 | 5856 |
| Total (#) | 1051 | 647 | 2812 | 3304 | 2211 | 1262 | 9794 | 12947 | 5689 | 39717 |
Table 1 does not account for age or sex, and should not be over-interpreted. (Age and sex are completely accounted for in all of the following analyses). The mean age of the cohort was 75.7 years and decreased monotonically with BMI; underweight persons were about 3 years older than obese persons, on average (data not shown). Women contributed 59% of the transition pairs. Men who were initially sick and underweight contributed fewer than 200 transition pairs for self-rated health and fewer than 100 pairs for ADL (not shown). Therefore calculations for initially sick underweight men may be compromised, especially for ADL. The great majority of transition pairs were for healthy normal or healthy overweight persons.
Although it is not possible to comment on all 72 transition probabilities here, we will mention two trends for healthy, normal-weight persons. The proportion of healthy and normal-weight men who will be sick or dead one year later rises from about 9% at age 65-69 to 27% at 90-94. For women, this probability increases from 4% to 28%. These probabilities were worse (higher) for the other initial BMI*Health states except for healthy overweight, which was similar to healthy normal. The probability of becoming overweight or obese in the following year is also of interest. For healthy normal-weight men, this probability declines from about 16% at age 65-69 to 11% at age 90-94, and for women the decline is from 13% to 3%. Being sick rather than healthy had little effect on the probability of a normal-weight person becoming overweight or obese.
We used multi-state life table methods to examine these complex relationships further. The estimated health trajectory for a hypothetical cohort of 100,000 women who were healthy and of normal weight at age 65 is shown in Figure 1. All are healthy at age 65, and the number of healthy persons decreases regularly over time, while the number dead increases, and the number of sick persons waxes and then wanes. These patterns are similar for men (available from the authors). The sum of column heights in the lowest category (“healthy”), divided by 100,000, is the expected years of healthy life (YHL = 16.8 years); the sum of areas in the middle category (“sick”) represents years of sick life (YSL = 5.3 years); and the sum of these two represents years of life or life expectancy at age 65 (YOL = 22.1 years). Estimated YOL, YHL, and YSL for men and women in each of the 8 possible BMI*Health states at age 65 are shown in the first 3 columns of Table 2. Healthy overweight women and healthy obese men had the longest estimated life expectancy, while healthy normal-weight women and healthy overweight men had the most years of healthy life.
Figure 1.
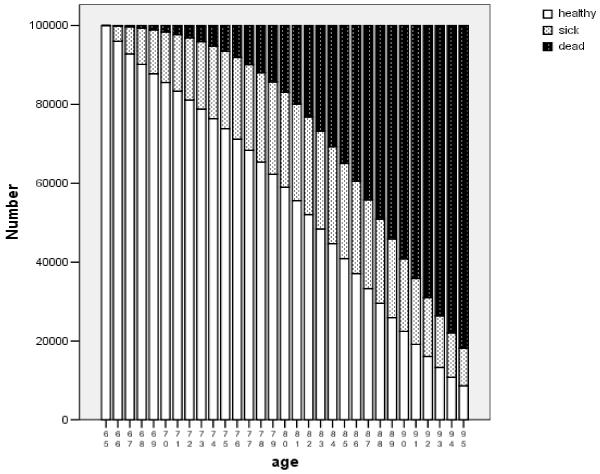
Projected Health Trajectory over Time .
Number of people in hypothetical cohort of 100,000 65-year-old healthy normal-weight women, with future health status estimated from multi-state life tables.
Table 2. Years Spent in Various Health States, by State at Age 65.
| Initial Health state |
Initial BMI state |
YOL |
YHL * |
YSL |
Years Under- weight |
Years Normal |
Years Over- weight |
Years Obese |
|---|---|---|---|---|---|---|---|---|
| Women | ||||||||
| Sick | Underweight | 20.2 | 13.3 | 6.9 | 6.1 | 8.6 | 4.3 | 1.2 |
| Normal | 20.9 | 14.0 | 7.0 | 1.7 | 10.0 | 6.9 | 2.3 | |
| Overweight | 21.6++ | 14.4 | 7.2 | 1.0 | 5.8 | 10.2 | 4.5 | |
| Obese | 21.6 | 13.9 | 7.7 | 0.6 | 3.4 | 6.3 | 11.4 | |
| Healthy | Underweight | 21.2− − | 15.9− − | 5.3 | 6.2 | 9.0 | 4.6 | 1.3 |
| Normal | 22.1 | 16.8 | 5.3 | 1.7 | 10.7 | 7.2 | 2.4 | |
| Overweight | 22.3 | 16.6 | 5.7 | 1.0 | 5.8 | 10.6 | 4.9 | |
| Obese | 22.1 | 15.8− − | 6.3 | 0.6 | 3.3 | 6.2 | 11.9 | |
| Men | ||||||||
| Sick | Underweight | 13.7 | 8.6 | 5.0 | 3.7 | 4.5 | 4.1 | 1.4 |
| Normal | 16.1 | 11.1 | 5.0 | 0.6 | 7.3 | 6.7 | 1.6 | |
| Overweight | 17.8++ | 12.4++ | 5.3 | 0.4 | 4.0 | 10.4 | 3.0 | |
| Obese | 18.4++ | 12.3 | 6.0 | 0.3 | 2.8 | 6.9 | 8.4 | |
| Healthy | Underweight | 17.3 | 13.2 | 4.1 | 3.8 | 6.6 | 5.5 | 1.4 |
| Normal | 18.3 | 14.3 | 4.0 | 0.6 | 8.1 | 8.0 | 1.7 | |
| Overweight | 18.8 | 14.7 | 4.1 | 0.4 | 4.3 | 11.3 | 2.9 | |
| Obese | 19.3++ | 14.6 | 4.7 | 0.3 | 2.9 | 7.1 | 9.0 |
YHL is years of healthy life (in excellent, very good, or good health, by self-report). YSL is years of sick life (in fair or poor health). YOL is years of life, or life expectancy at age 65.
Significant difference from the normal-weight group (2-tailed p<.05) , based on bootstrap standard errors:
indicates significantly more YOL or YHL than in the respective (healthy or sick) normal-weight group
indicates significantly fewer YOL or YHL than in the respective (healthy or sick) normal-weight group
Also shown in Table 2 are results of approximate t-tests comparing normal BMI to each other BMI category with respect to YOL and YHL. (Confidence intervals are not shown because of the complexity of the table, but are available from the authors). Five states that were significantly better than normal weight (in the corresponding health state) are indicated by “++”. Three states that were significantly worse than normal weight are indicated by “− −”. As expected, the standard errors of the difference between underweight and normal weight men were large (1.7 years for YHL and 2.4 years for YHL—not shown); thus the apparently large differences between underweight and normal-weight men were not statistically significant.
Results for active life expectancy (ALE) are shown in Table 3. For example, underweight women with ADL difficulties at age 65 are expected to have 20.3 YOL and an ALE of 15.3 years. In five comparisons, overweight or obese were significantly better than normal weight. In two comparisons normal weight was significantly better. The overall pattern is similar to that in Table 2.
Table 3. Years Spent in Various ADL States, by State at Age 65.
|
Initial ADL state |
Initial BMI state |
YOL |
ALE* |
DLE |
Years Under- weight |
Years Normal |
Years Over- weight |
Years Obese |
|---|---|---|---|---|---|---|---|---|
| Women | ||||||||
|
ADL
Difficulty |
Underweight | 20.3 | 15.3 | 5.0 | 5.4 | 8.9 | 4.7 | 1.4 |
| Normal | 21.3 | 15.5 | 5.8 | 1.6 | 9.8 | 7.3 | 2.6 | |
| Overweight | 21.9 | 15.6 | 6.3 | 1.0 | 5.7 | 10.6 | 4.6 | |
| Obese | 21.9 | 14.6 | 7.3 | 0.6 | 3.3 | 6.0 | 11.9 | |
| No Diff | Underweight | 21.0−− | 16.9 | 4.1 | 6.2 | 9.0 | 4.6 | 1.3 |
| Normal | 21.8 | 17.1 | 4.7 | 1.7 | 10.6 | 7.1 | 2.4 | |
| Overweight | 22.1++ | 16.8−− | 5.3 | 1.0 | 5.8 | 10.5 | 4.9 | |
| Obese | 22.0 | 15.9 | 6.1 | 0.6 | 3.4 | 6.3 | 11.7 | |
| Men | ||||||||
|
ADL
Difficulty |
Underweight | 14.7 | 11.9 | 2.7 | 4.1 | 5.8 | 4.0 | 0.7 |
| Normal | 15.3 | 12.0 | 3.3 | 0.5 | 6.5 | 6.8 | 1.5 | |
| Overweight | 18.0++ | 13.9++ | 4.1 | 0.3 | 3.9 | 10.2 | 3.6 | |
| Obese | 18.4++ | 13.8 | 4.6 | 0.3 | 2.9 | 7.2 | 8.1 | |
| No Diff | Underweight | 15.2 | 13.2 | 2.0 | 4.3 | 6.0 | 4.1 | 0.7 |
| Normal | 17.9 | 15.4 | 2.5 | 0.6 | 8.0 | 7.7 | 1.6 | |
| Overweight | 18.5 | 15.7 | 2.8 | 0.3 | 4.2 | 11.1 | 2.9 | |
| Obese | 19.2++ | 15.7 | 3.5 | 0.2 | 2.8 | 6.9 | 9.2 |
ADL Difficulty means one or more ADL difficulty. No Diff means no ADL difficulties. ALE is active life expectancy (years without ADL difficulties). DLE is “difficult” life expectancy (years with ADL difficulties). YOL is years of life, or life expectancy at age 65.
Significant difference from the normal-weight group (2-tailed p<.05) , based on bootstrap standard errors:
indicates significantly more YOL or ALE than in the respective (healthy or sick) normal-weight group
indicates significantly fewer YOL or ALE than in the respective (healthy or sick) normal-weight group
Estimated BMI trajectories for a hypothetical cohort of 100,000 women who were healthy and of normal weight at age 65 are shown in Figure 2, where the lowest (clear) bars represent the number projected to be obese at each age, the bars with slashes represent normal weight, and so on. Within just one year (at age 66), fully 15% of this hypothetical cohort was overweight, and the number overweight increased further over time, then decreased as the number dead increased. Findings were similar for men (available from the authors). The sum of the heights of the lowest bars represents expected years of future life spent in the obese state (2.4 years); the sum of the next higher set of bar areas represents expected years of overweight life (7.2 years); similarly, we estimated an average of 10.7 years of normal-weight life and 1.7 years of underweight life for this cohort. These four numbers sum to the YOL (life expectancy) at age 65 (22.1 years).
Figure 2.
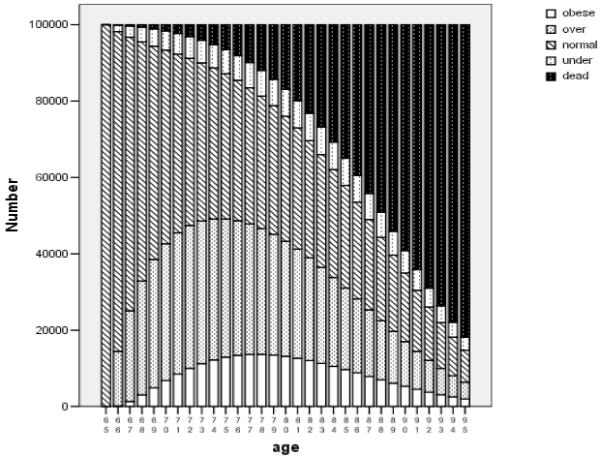
Projected BMI Trajectory over Time .
Number of people in hypothetical cohort of 100,000 65-year-old healthy normal-weight women, with future BMI states estimated from multi-state life tables.
Estimated years of future life spent in each BMI category for men and women in the 8 initial BMI*Health states at age 65 are shown in the last 4 columns of Table 2. On average, persons will spend the majority of their remaining life in the BMI state they were in at 65. The exception is that persons who are underweight at age 65 are expected to spend most of their future years at a normal weight. Underweight is a somewhat transient state, in part because of its higher death rate. The BMI patterns for ALE, shown in Table 3, are similar to those for YHL. Approximate standard errors for these quantities are available from the authors.
SUMMARY AND DISCUSSION
In this section we first summarize the results, then discuss the findings separately for underweight, obese, and overweight. We review the gender differences and compare the results for YOL, YHL and ALE. Finally, we discuss the potential role of confounding in the analysis, and consider why older adults may be different from middle-aged and younger persons.
Our findings have extended the results of the Vasan paper [13] by showing that persons of normal weight at age 65 are also likely to be overweight or obese in the future. However, the potentially harmful consequences of this finding may be mitigated by our further finding that older adults who are overweight (or, in some cases, obese) have no worse and sometimes better outcomes than those of normal weight at 65. Our results did not support Reynolds’ finding that obesity was associated with lower ALE. [14]
Underweight was associated with worse outcomes than normal weight in 16 of 16 comparisons in Tables 2 and 3. Only three of the individual comparisons reached statistical significance, due in part to the small number of underweight persons in this study. Risks associated with underweight have been reported in several studies of mortality and other health outcomes. [23-25] The association of low weight with previous unexplained weight loss may explain the higher mortality. [23] We defined underweight as a BMI less than 20, instead of the usual cutpoint of 18.5. If we had used the standard definition, both the normal and underweight groups would have had worse outcomes than shown here, because the healthiest underweight would have become the sickest normal-weight. Thus, our findings are robust to the definition of underweight.
Obesity was associated with better outcomes than normal weight in 11 of the 16 comparisons, and 2 of those comparisons were statistically significant. Obesity was the same or worse in the remaining 5 comparisons (1 statistically significant). It is unclear whether obesity is better or worse than normal weight for older adults.
Perhaps the most interesting finding is that being overweight at age 65 was associated with better outcomes than normal weight in 14 of 16 comparisons, and 6 of these differences were statistically significant. Reynolds et al. also found slightly better ALE for overweight compared to normal-weight older adults. In a recent study based on data from half a million volunteers from the American Association of Retired Persons (AARP), [26] overweight older adults had favorable mortality, similar to our findings, although this finding was not emphasized. A meta-analysis of the association between weight and mortality in 26 observational studies also noted that the overweight classification had favorable mortality, although the results were age-adjusted rather than age-specific. [27] A very recent publication by Takata following 697 80-year-old Japanese persons documented lower all-cause mortality in overweight/obese persons, and higher mortality in underweight persons, as compared to normal weight. [28] In addition to mortality, Arterburn et al. found that overweight was associated with better health status and quality of life than normal weight in a study of older veterans. [10] Until recently, the overweight category has been neglected in the literature, which has tended to focus on the extremes of obesity and underweight. Given the consistency of findings, perhaps new weight standards for older adults should define both normal weight and overweight to be “healthy weight”. By the current definition, only 37% of Americans aged 65-74 and 48% of those aged 75 and older are at a healthy weight. [29] If overweight was included, then 78% of those 65-74 and 82% of those 75 and older would be at a healthy weight, a major change from current perceptions.
Results sometimes differed by gender. For men, better outcomes were always seen in the overweight and obese, compared to the normal-weight group. Findings were mixed for women. This may represent a true gender difference in health and activity limitations; alternatively, men and women may rate themselves differently on these items. Obese women’s preference for thinness might lead them to downgrade their health status, and underweight women may mistakenly rate their health more favorably because they are thin. Such misclassification could help to explain the results for healthy thin and sick obese women who fare, respectively, worse and better than might have been expected.
The findings were fairly consistent for all three outcomes, YOL, YHL, and ALE. We had expected associations of weight with YOL to differ from associations with YHL and ALE because of the high prevalence of non-fatal conditions such as osteoarthritis in the obese elderly. That higher prevalence seemed to suggest that overweight and obesity would be more strongly associated with YHL and ALE than with mortality, but this was not the case. We had also expected the results for ALE and YHL to differ from one another because ADL and self-rated health do not classify the same persons as impaired. Only 53% of those with ADL difficulties rated themselves as sick, and only 11% of the sick reported an ADL difficulty. Nevertheless, results for YHL and ALE were substantively similar. There were more persons in fair or poor health than persons with ADL disabilities, suggesting that the transition probabilities were estimated more accurately for YHL than for ALE.
These analyses did not control for smoking or chronic disease except indirectly, through their effect on self-rated health or ADL. In separate analyses, we found that higher BMI was significantly associated at baseline with more heart disease, hypertension, diabetes, arthritis, depression and less exercise (data not shown). Despite these negative associations, the overweight and obese categories had favorable results. The only positive association was that low BMI was associated with smoking. Earlier analyses in CHS that were restricted to non-smokers and adjusted for a large number of important covariates resulted in similar conclusions to the present analysis.[12, 23] Studies of the health effects of weight often approach confounding by restricting the analysis to healthy nonsmokers. Such studies estimate the effect of BMI in persons with no other health problems. In CHS only 14% of the men and 23% of the women were never-smokers without a history of cancer, heart disease, stroke, respiratory disease, or recent loss of 10 pounds at baseline (the exclusions used by Calle et al [30]), suggesting that results from such restricted studies may not apply to most older adults. The analysis reported here examines whether BMI predicts mortality and morbidity in the general population of older adults. We found that overweight and even obesity are not, on average, risk factors for shortened YOL, YHL, and ALE, although it may be advisable for persons with certain health problems to modify their weight.
Relationships between BMI and future health and mortality in older adults are different from the relationships found in younger populations. There are several possible explanations for these differences. The first is a putative “survivor” effect in which middle-aged individuals whose health is sensitive to their weight -- perhaps due to genetic or environmental factors or to poor access to medical care for hypertension or dyslipidemia -- are less likely to survive into old age. The resulting cohort of survivors would be less susceptible to the health problems of overweight and obesity than a younger cohort.
Another possibility is that, in old age, the protective aspects of obesity may outweigh the negative effects. Obesity provides a nutritional reserve to the individual in times of stress such as illness or trauma, and persons with a higher BMI are more likely to survive acute illness. [31-33] Obesity also protects against acute injury from traumatic events such as falls. Heavier persons have lower rates of osteoporosis, probably as a result of fatty tissue synthesis of estrogens and greater weight-bearing-related bone formation. [34, 35]
A third explanation for differing BMI-health relationships between older and younger adults may be that disease processes and treatments change with age. The relative excess of chronic disease in the higher weight categories tends to decrease at older ages, as lighter weight persons eventually contract these diseases. [36] The increased disease burden with age leads to different interactions with the health care system, more hospitalizations, and changes in medication use and lifestyle. Health hazards of being overweight in later life may also be masked by other health risks associated with aging.[34] Finally, overweight and obesity in middle-aged and younger persons are usually associated with long-term sequellae, which may be less important in older adults because “forevermore is shorter than before.” [37]
Limitations
Persons who enrolled in CHS were relatively healthy for their age at baseline. Even though most of the data used here were collected long after baseline, our results may be overly favorable when compared to the general population. The data were collected prior to the current obesity epidemic, suggesting that today’s overweight and obese elderly may be different from their counterparts measured in the 1990’s. Nearly 40,000 transition pairs were available for estimating the transition probabilities, and a simple life table calculation yields a life-expectancy close to the national average. [38] However, for the multi-state life tables in this paper we needed to estimate 72 probabilities for each year of age by gender (5320 probabilities in all) and YOL, YHL, and ALE may be poorly estimated in the smallest cells. The standard errors for YHL and YOL in the initially “sick and underweight” category were large. Repeating these analyses with different and larger datasets would be valuable. Many differences among states were small and may not be clinically important. Finally, in the bootstrap procedure used to estimate the standard errors, we were unable to duplicate the complex calculations exactly, and the t-statistics used in Table 2 and Table 3 are only approximate. Despite these limitations, we believe the evidence is strong that higher weight does not not reflect increased risk for poor outcomes in older adults.
Conclusions
This paper supports the idea that guidelines for weight should be age-appropriate, not “one size fits all”. Older adults who are overweight (or, for men, even obese) may be at a healthy weight for their age. If confirmed by further research, this message should be emphasized. The current BMI/weight standards would seem to detract from appropriate concern for underweight, which has been shown to be a more important concern for older adults. [23]
ACKNOWLEDGMENTS
The research reported in this article was supported by contracts N01-HC-85079 through N01-HC-85086, N01-HC-35129, N01-HC-75150, N01-HC-45133, and N01 HC-15103 from the National Heart, Lung, and Blood Institute.
Appendix
Calculations for Multi-State Life Tables
Multi-state life tables are similar to the usual 2-state life tables except that the “alive” state is divided into separate states, such as the states listed in Table 1 (healthy and overweight, sick and underweight, and so on). The life table calculations apply the transition probabilities from Table 1 to a hypothetical population of 100,000 persons in a specified state at age 65, to determine how many will be in each state in the following year. (For simplicity in this example we use the transition probabilities in Table 1, even though they are not age- and sex-specific).
For example, if we start with 100,000 persons who are healthy and normal weight at age 65, the sixth row of Table 1 indicates that one year later (at age 66), 77%, or 77,000 will still be healthy and normal weight, while 8900 will be healthy and overweight, 8400 will be sick and normal weight, 1800 will have died, and smaller numbers (calculated in the same way) will be in the other states. One year after that (at age 67), 77% of the 77,000 or 59290 of the healthy normal persons will still be healthy and normal weight. In addition, using row 7 of Table 1, we see that 6.9% of the 8900 healthy overweight (614) will return to being healthy and normal weight, as will 25% of the 8400 sick and normal weight (from line 2, n = 2100) and smaller numbers returning from the other states. The number who are healthy and normal-weight at age 67 will thus be 59290 + 614 + 2100 + the smaller numbers returning from the other states.
These calculations can then be repeated to determine the number in each state at age 68, and on up to age 95, by which time most will have died. We then add up the number of person-years spent in a particular state over all the ages, for a given starting state, and divide the sum by 100,000 to yield the expected number of years spent in that state. (Actually, the values at age 65 and age 95 are weighted by 0.5, which is a feature of the trapezoidal approximation for the area under the curve). [39] This simple but tedious bookkeeping is most easily accomplished using a spreadsheet, which we programmed for this purpose. Note that we did not actually use the probabilities in Table 1, which includes men and women of all ages. Transition probabilities are different for each age and sex. [38] We thus had to create a version of Table 1 for each age and sex, to perform the calculations in the table.
This process assumes only that valid estimates of the average transition probability for each age/sex/state are available. Because CHS is a sample of the general population, the estimates used here should be appropriate except perhaps in the smallest cells, as noted in the paper.
REFERENCES
- 1.Flegal KM, Carroll MD, Ogden CL, et al. Prevalence and trends in obesity among US adults, 1999-2000. JAMA. 2002;288(14):1723–1727. doi: 10.1001/jama.288.14.1723. [DOI] [PubMed] [Google Scholar]
- 2.Hedley AA, Ogden CL, Johnson CL, et al. Prevalence of overweight and obesity among US children, adolescents, and adults, 1999-2002. JAMA. 2004;291(23):2847–2850. doi: 10.1001/jama.291.23.2847. [DOI] [PubMed] [Google Scholar]
- 3.National Institutes of Health . Clinical Guidelines on the Identification, Evaluation, and Treatment of Overweight and Obesity in Adults: The Evidence Report. 1998. NIH Publication No. 98-4083. Ref Type: Report. [Google Scholar]
- 4.Caterson ID, Hubbard V, Bray GA, et al. Prevention Conference VII: Obesity, a worldwide epidemic related to heart disease and stroke: Group III: worldwide comorbidities of obesity. Circulation. 2004;110(18):e476–e483. doi: 10.1161/01.CIR.0000140114.83145.59. [DOI] [PubMed] [Google Scholar]
- 5.Peeters A, Bonneux L, Nusselder WJ, et al. Adult obesity and the burden of disability throughout life. Obes Res. 2004;12(7):1145–1151. doi: 10.1038/oby.2004.143. [DOI] [PubMed] [Google Scholar]
- 6.Visscher TL, Rissanen A, Seidell JC, et al. Obesity and unhealthy life-years in adult Finns: an empirical approach. Arch Intern Med. 2004;164(13):1413–1420. doi: 10.1001/archinte.164.13.1413. [DOI] [PubMed] [Google Scholar]
- 7.Stevens J, Cai J, Pamuk ER, et al. The effect of age on the association between body-mass index and mortality. N Engl J Med. 1998;338(1):1–7. doi: 10.1056/NEJM199801013380101. [DOI] [PubMed] [Google Scholar]
- 8.Heiat A, Vaccarino V, Krumholz HM. An evidence-based assessment of federal guidelines for overweight and obesity as they apply to elderly persons. Arch Intern Med. 2001;161(9):1194–1203. doi: 10.1001/archinte.161.9.1194. [DOI] [PubMed] [Google Scholar]
- 9.Flegal KM, Williamson DF, Pamuk ER, et al. Estimating deaths attributable to obesity in the United States. Am J Public Health. 2004;94(9):1486–1489. doi: 10.2105/ajph.94.9.1486. [DOI] [PMC free article] [PubMed] [Google Scholar]
- 10.Arterburn DE, McDonell MB, Hedrick SC, et al. Association of Body Weight with Condition-Specific Quality of Life in Male Veterans. Amer J of Medicine. 2004;117:738–746. doi: 10.1016/j.amjmed.2004.06.031. [DOI] [PubMed] [Google Scholar]
- 11.Stevens J. Impact of age on associations between weight and mortality. Nutr Rev. 2000;58(5):129–137. doi: 10.1111/j.1753-4887.2000.tb01847.x. [DOI] [PubMed] [Google Scholar]
- 12.Diehr P, Newman AB, Jackson SA, et al. Weight modification trials in older adults: What should the outcome measure be? Controlled Clinical Trials in Cardiovascular Medicine. 2002;3:1–18. doi: 10.1186/1468-6708-3-1. [DOI] [PMC free article] [PubMed] [Google Scholar]
- 13.Vasan SV, Pencina MJ, Cobin M, et al. Estimated risks for developing obesity in the Framingham Heart Study. Annals of Internal Medicine. 2005;143:473–480. doi: 10.7326/0003-4819-143-7-200510040-00005. [DOI] [PubMed] [Google Scholar]
- 14.Reynolds SL, Yasuhiko S, Crimmins EM. The impact of obesity on active life expectancy in older American men and women. The Gerontologist. 2005;45:438–444. doi: 10.1093/geront/45.4.438. [DOI] [PubMed] [Google Scholar]
- 15.Fried LP, Borhani NO, Enright PL, et al. The Cardiovascular Health Study: design and rationale. Annals of Epidemiology. 1991;1:263–276. doi: 10.1016/1047-2797(91)90005-w. [DOI] [PubMed] [Google Scholar]
- 16.Ives G, Fitzpatrick A, Bild D, et al. Surveillance and ascertainment of cardiovascular events: the cardiovascular health study. Annals of Epidemiology. 1995 doi: 10.1016/1047-2797(94)00093-9. [DOI] [PubMed] [Google Scholar]
- 17.Clinical Guidelines on the identification, evaluation, and treatment of overweight and obesity in adults: the evidence report. U.S. Department of Health and Human Services, Public Health Service, National Institutes of Health, National Heart, Lung, and Blood Institute; Jun, 1998. [Google Scholar]
- 18.Krause NM, Jay GM. What do global self-rated health items measure? Med Care. 1994;32:930–942. doi: 10.1097/00005650-199409000-00004. [DOI] [PubMed] [Google Scholar]
- 19.Gold M, Siegel J, Weinstein M, et al., editors. Cost effectiveness in health and medicine. Oxford University Press; New York: 1996. [Google Scholar]
- 20.Idler EL, Benyamini Y. Self-rated health and mortality: A review of twenty-seven community studies. J Health Soc Behave. 1997;38:21–37. [PubMed] [Google Scholar]
- 21.Kate S, Branch LG, Branson MH, et al. Active life expectancy. N Engl J Med. 1983;309:1218–24. doi: 10.1056/NEJM198311173092005. [DOI] [PubMed] [Google Scholar]
- 22.Engels JM, Diehr P. Imputation of Missing Longitudinal Data: a comparison of methods. Journal of Clinical Epidemiology. 2003;56:968–976. doi: 10.1016/s0895-4356(03)00170-7. [DOI] [PubMed] [Google Scholar]
- 23.Diehr P, Bild DE, Harris TB, et al. Body mass index and mortality in nonsmoking older adults: the Cardiovascular Health Study. Am J Public Health. 1998;88(4):623–629. doi: 10.2105/ajph.88.4.623. [DOI] [PMC free article] [PubMed] [Google Scholar]
- 24.Newman AB, Yanez D, Harris T, et al. Weight change in old age and its association with mortality. J Am Geriatr Soc. 2001;49(10):1309–1318. doi: 10.1046/j.1532-5415.2001.49258.x. [DOI] [PubMed] [Google Scholar]
- 25.Strawbridge WJ, Wallhagen MI, Shema SJ. New NHLBI clinical guidelines for obesity and overweight: will they promote health? Am J Public Health. 2000;90(3):340–343. doi: 10.2105/ajph.90.3.340. [DOI] [PMC free article] [PubMed] [Google Scholar]
- 26.Adams KE, Schatzkin A, Harris TB, et al. Overweight, obesity, and mortality in a large prospective cohort of persons 50 to 71 years old. N Engl J Med. 2006;355:763–778. doi: 10.1056/NEJMoa055643. [DOI] [PubMed] [Google Scholar]
- 27.McGee DL, Diverse Populations Collaboration Body mass index and mortality: a meta-analysis based on person-level data from twenty-six observational studies. Ann Epidemiol. 2005;15:87–97. doi: 10.1016/j.annepidem.2004.05.012. 28. [DOI] [PubMed] [Google Scholar]
- 28.Takata Y, Ansai T, Soh I, Akifusa S, Sonoki K, Fujisawa K, Awano S, Kagiyama S, Hamasaki T, Nakamichi I, Yoshida A, Takehara T. Association between body mass index and mortality in an 80-year-old population. JAGS. 2007;55:913–917. doi: 10.1111/j.1532-5415.2007.01170.x. [DOI] [PubMed] [Google Scholar]
- 29.Schoenborn CA, Adams PF, Barnes PM, National Center for Health Statistics Body weight status of adults: United States, 1997-98. Vital Health Stat. 1989;16(1) Advance data from vital and health statistics: nos 1-10. National Center for Health Statistics. [Google Scholar]
- 30.Calle EE, Thun MJ, Petrelli JM, et al. Body-mass index and mortality in a prospective cohort of U.S. adults. N Engl J Med. 1999;341:1097–105. doi: 10.1056/NEJM199910073411501. [DOI] [PubMed] [Google Scholar]
- 31.Rissanen PM, Laakkonen EI, Suntioinen S, et al. The Nutritional Status of Finnish Home–living Elderly People and the Relationship between Energy Intake and Chronic Diseases. AGE AND AGING. 1996;25:133–8. doi: 10.1093/ageing/25.2.133. [DOI] [PubMed] [Google Scholar]
- 32.Hedlund J. Community Acquired Pneumonia Requiring Hospitalization. Factors of Importance for the Short and Long Term Prognosis. SCANDINAVIAN JOURNAL OF INFECTIOUS DISEASES. 1995;97:1–60. SUPPLEMENTUM. [PubMed] [Google Scholar]
- 33.Potter J, Klipstein K, Reilly JJ, et al. The Nutritional Status and Clinical Course of Acute Admissions to a Geriatric Unit. AGE AND AGING. 1995;24:131–6. doi: 10.1093/ageing/24.2.131. [DOI] [PubMed] [Google Scholar]
- 34.Baumgartner RN, Stauber PM, Koehler KM, et al. Associations of Fat and Muscle Masses with Bone Mineral in Elderly Men and Women. American Journal of Clinical Nutrition. 1996;63:365–72. doi: 10.1093/ajcn/63.3.365. [DOI] [PubMed] [Google Scholar]
- 35.Edelstein SL, Barrett–Connor E. Relation Between Weight and Bone Mineral Density in Elderly Men and Women. American Journal of Epidemiology. 1993;138(3):160–9. doi: 10.1093/oxfordjournals.aje.a116842. [DOI] [PubMed] [Google Scholar]
- 36.Van Itallie TB, Lew EA. Health implications of overweight in the elderly. Progress in clinical and biological research. 1990;326:89–108. [PubMed] [Google Scholar]
- 37.Lerner AJ, Lowe F. I’m glad I’m not young anymore. From “Gigi”. 1958 [Google Scholar]
- 38.Diehr P, Patrick DL. Probabilities of Transition among Health States for Older Adults. Quality of Life Research. 2001;10:431–422. doi: 10.1023/a:1012566130639. [DOI] [PubMed] [Google Scholar]
- 39.Diehr P, Psaty B, Patrick D. Effect size and power for clinical trials using years of healthy life as the primary endpoint. Stat Med. 1997;16:1211–1224. doi: 10.1002/(sici)1097-0258(19970615)16:11<1211::aid-sim549>3.0.co;2-7. [DOI] [PubMed] [Google Scholar]