Abstract
In small vessels blood is usually treated as a Newtonian fluid down to diameters of ~200 μm. We investigate the flow of red blood cell (RBC) suspensions driven through small tubes (diameters 10–150 μm) in the range marking the transition from arterioles and venules to the largest capillary vessels. The results of the simulations combined with previous simulations of uniform shear flow and experimental data show that for diameters less than ~100 μm the suspension’s stress cannot be described as a continuum, even a heterogeneous one. We employ the dissipative particle dynamics (DPD) model, which has been successfully used to predict human blood bulk viscosity in homogeneous shear flow. In tube flow the cross-stream stress gradient induces an inhomogeneous distribution of RBCs featuring a centreline cell density peak, and a cell-free layer (CFL) next to the wall. For a neutrally buoyant suspension the imposed linear shear-stress distribution together with the differentiable velocity distribution allow the calculation of the local viscosity across the tube section. The viscosity across the section as a function of the strain rate is found to be essentially independent of tube size for the larger diameters and is determined by the local haematocrit (H) and shear rate. Other RBC properties such as asphericity, deformation, and cell-flow orientation exhibit similar dependence for the larger tube diameters. As the tube size decreases below ~100 μm in diameter, the viscosity in the central region departs from the large-tube similarity function of the shear rate, since H increases significantly towards the centreline. The dependence of shear stress on tube size, in addition to the expected local shear rate and local haematocrit, implies that blood flow in small tubes cannot be described as a heterogeneous continuum. Based on the analysis of the DPD simulations and on available experimental results, we propose a simple velocity-slip model that can be used in conjunction with continuum-based simulations.
Keywords: biological fluid dynamics, capsule/cell dynamics, micro-/nano-fluid dynamics
1. Introduction
In this work the flow of red blood cell (RBC) suspensions in small tubes is investigated by means of dissipative particle dynamics (DPD) simulations and, where possible, the results are compared with available experimental data from the literature. The modelled RBCs have previously been well-characterized with a number of single-cell tests (Fedosov, Caswell & Karniadakis 2010a,c). In plane Couette-flow simulations of their suspensions have yielded non-Newtonian viscosities (Fedosov et al. 2011) in excellent agreement with in vitro viscosities of both healthy human whole blood and washed erythrocyte suspensions (ESs), as measured in three different laboratories over a time span of ~15 years (Merrill et al. 1963; Chien et al. 1966; Skalak, Keller & Secomb 1981). RBC membrane properties from which a shear-rate time scale can be derived were not measured for these data. Nonetheless the plots of relative viscosity versus the dimensional shear rate (s−1) in Fedosov et al. (2011, figure 1) for both healthy whole blood and for resuspended washed ESs point to two independent conclusions: (i) within experimental error, the measured values define single curves; this indicates that in healthy blood average RBC membrane properties do not vary enough to affect the shear-rate time scale whether due to variations between individuals or to age distributions of RBCs; (ii) the blood suspension model of Fedosov et al. (2011), which contains only monodisperse RBCs and ignores the other components (white cells, platelets, etc.), predicts the experimental data rather well; this suggests that this model can be a good candidate for the simulation of flow problems relevant to the circulation. Poiseuille flow in tubes is the simplest of this class, lending itself both to well-posed flow simulations and to reproducible experiments. The simulations of plane Couette flow (Fedosov et al. 2011) confirm the expectation of uniform concentration of cells or the haematocrit (H) across the gap. In Poiseuille flow the cross-stream stress gradient is known, for example (Moyers-Gonzalez & Owens 2010), to give rise to migration across the streamlines for suspended particles of any kind, the magnitude of the effect being dependent on the particle-to-channel size ratio. For fully developed blood flow in circular tubes the main consequence of migration is the formation of a cell-free layer (CFL) at the wall and a concentration peak at the centreline. Analytical approaches (Sharan & Popel 2001) have attempted to model this effect as a two-phase flow consisting of Newtonian fluid (plasma) in the CFL and in the rest of the cross-section a non-Newtonian suspension spatially uniform in H.
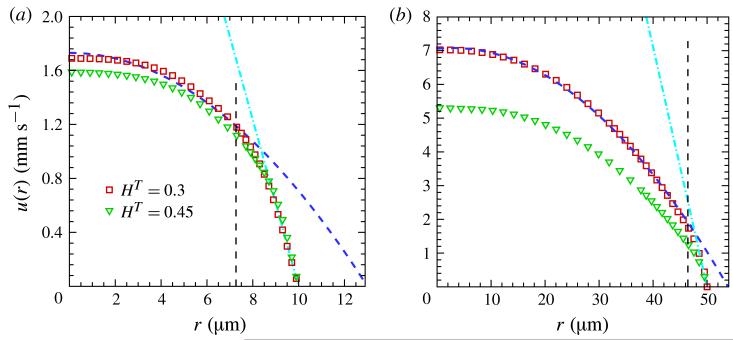
Figure 1.
(Colour online) Axial velocity profiles: (a) D = 20 μm for HT = 0.3, and for HT = 0.45, ; (b) D = 100 μm for HT = 0.3, and for HT = 0.45, . The data for HT = 0.3 are also fitted with parabolic curves (dashed) and the tangent lines (dashdot) at the wall with slopes τw/μ, while the vertical dashed line indicates the CFL thickness.
The main objective of this work is to investigate whether the assumptions built into such models of blood flow in small tubes are supported by results from the simulations of our multiscale model of blood suspensions. The tube flows of these suspensions (Fedosov et al. 2010d) are expensive to simulate, and therefore it is desirable to know when simplified approaches are feasible. As the tube size is reduced toward the RBC diameter the CFL becomes the dominant feature, and the assumption of a core of homogeneous flow will become increasingly tenuous. Hence, our goal is to determine the effective range of such approximations. Blood in uniform shear flow and in tube flow has previously been simulated by both particle methods and continuum treatments. Freund & Orescanin (2011) investigated flow in a tube of diameter 11 μm using a Stokes-flow continuum model suspension simulated by the boundary integral method, and very recently Alizadehrad et al. (2012) have also presented Navier–Stokes simulations for tube of diameter in the range 10–50 μm. The particle-based multi-particle collision dynamics (MPCD) method was employed by McWhirter, Noguchi & Gompper (2009) to simulate blood flow in micro-capillaries of radius 4.8 μm. Dupin et al. (2007) have applied the lattice-Boltzmann (LB) method to study flow of a RBC suspension in a nearly square (≈30 μm) channel. A number of two-dimensional simulations have been published; we do not cite them here because we are not aware of methods for comparing them quantitatively to three-dimensional simulations or to physical experiments.
Here the DPD method is used to study the flow of RBC suspensions driven through small tubes (diameters 10–150 μm, tube haematocrits (HT) 30 and 45 %). Unlike other works, the effects of cell aggregation (rouleaux) have been investigated.
The paper is organized as follows. In § 2 we analyse our simulation data with plots of the distributions of variables across the tube section. In § 3 we investigate the scaling of derived variables, such as viscosity, to uncover the way in which these suspension flows change as the tube diameter decreases. We also use dimensional analysis to examine the dimensional flow–resistance correlations of Pries, Neuhaus & Gaehtgens (1992), which suggest that the apparent viscosity of blood relative to the plasma viscosity is essentially independent of the driving pressure gradient. We also develop a simple velocity-slip model that predicts the velocity profile in tubes from 10 μm and above and can be used in conjunction with continuum-based simulations. We conclude in § 4 with a brief summary.
2. Simulation results
In this section simulation results for blood flow in tubes with diameters between 10 and 150 μm are presented. We have used the DPD method (see Appendix) for the blood flow simulations and employed the methods of Fedosov et al. (2010a, 2011) to model single RBCs and their suspensions. The steady tube flow simulations were carried out with the specification of: (i) the driving force f per unit mass applied to each DPD particle, which is equivalent to a suddenly applied constant pressure gradient; (ii) the tube radius R; (iii) the suspending solvent viscosity μ and its density ρ; and (iv) the tube haematocrit HT (RBC volume fraction), a RBC concentration measure. We define two important integrals to evaluate the tube haematocrit HT and the discharge haematocrit HD from the local haematocrit H(r) and velocity u(r) distributions
| (2.1) |
where is the bulk velocity. Both of these average haematocrits are experimentally measurable. In steady flow experiments HD is equal to the specified feed value. After stopping the flow the haematocrit within the tube, HT, can be measured by centrifugation of the suspension, or by spectroscopic determination of its total haemoglobin (Barbee & Cokelet 1971), which is accurate for sufficiently long tubes. Thus, in experiments HD is normally specified and HT is measured. In simulations, HT is specified by introduction of the necessary number of RBCs into the tubular computational volume, while HD must be derived from the output. We also define the pseudo-shear rate as , which serves as a characteristic strain rate of the flow.
The modelled cells are suspended in the solvent as neutrally buoyant bodies. Most of the results of this paper deal with unaggregated suspensions of healthy RBCs whose viscoelastic membrane properties have previously been converted by Fedosov et al. (2011) into model parameters, which are held constant in all simulations. For aggregating suspensions inter-cellular adhesive forces must be included in the model; their specification is also identical to that of Fedosov et al. (2011). The DPD simulations of the RBC suspensions in Poiseuille flow yield the continuum field variables calculated as statistical time averages of particle variables. These include flow velocity, haematocrit, cell density (CD) and orientation, and will be presented as radial distributions across tube sections.
2.1. Velocity and shear rate distributions
Figure 1 shows the time-averaged axial-velocity distribution u(r). The dashed lines (shown in blue online) are quadratic fits of the numerical data for HT = 0.3, and for diameters less than ~50 μm the velocity profiles were found to be markedly non-parabolic. For larger tubes, D = 100 μm and D = 150 μm, the profiles are well represented with parabolas, except for the near-wall region, a CFL, where plasma properties dominate. For illustration we plot the wall values of du/dr = τw/μ = ΔPR/(2Lμ) for HT = 0.3 in figure 1 indicated by the dash-dotted lines (shown in cyan online) drawn from the wall. Here, τw is the wall shear stress which is calculated directly from an imposed pressure drop ΔP along the tube length L, since the layer next to the wall is void of RBCs and its viscosity is equal to μ.
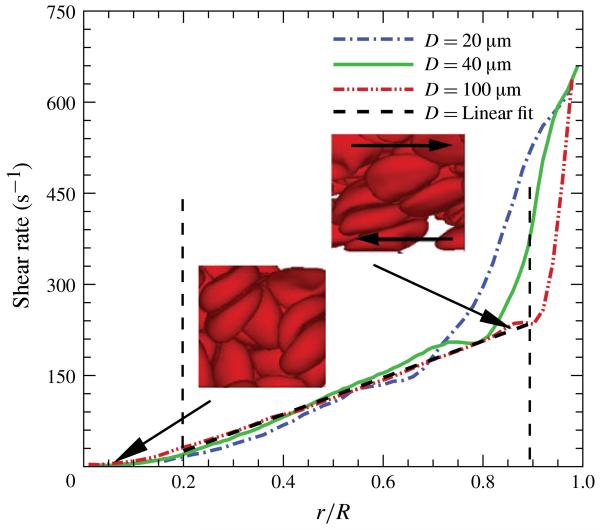
The velocity distributions appear to be very smooth since they reflect the statistical averages over all particles including those of the solvent and cells. This permits the calculation of shear rate profiles, and also of local viscosity from the imposed shear stress distributions (Fedosov, Caswell & Karniadakis 2010b). Figure 2 presents the shear rate distributions for different tube diameters calculated numerically from the velocity data for HT = 0.3. For the 100 μm tube, except for the core region r/R < 0.2, the shear rate is linear up to the CFL boundary. For all tube diameters the shear rate distributions can be roughly divided into three regions: (i) a non-Newtonian flow region near the centreline with low shear rates <60 s−1; (ii) a linear region between the centreline and CFL; and (iii) a linear region near the wall indicative of a CFL. For the large tube size (D = 100 μm), these three regions are very apparent: a non-Newtonian flow near the centreline, followed by a linear region with shear rates up to 250 s−1, and then a nearly linear region within the CFL with large shear rates.
Figure 2.
(Colour online) Shear rate distributions for blood flow in tubes of various diameters at HT = 0.3. For D = 100 μm the vertical dashed lines indicate the CFL thickness near the wall and the limit of the linear portion of the distribution near the centreline. The inset with a big arrow pointing to small values of r/R shows a snapshot of RBCs taken around the tube centreline, while the other inset illustrates RBCs close to the CFL and the arrows inside this inset indicate the direction of local shear flow. Both insets are visualizations from the case D = 100 μm. The pseudo-shear rates are for D = 20 μm, for D = 40 μm and for D = 100 μm.
2.2. Local CD and haematocrit
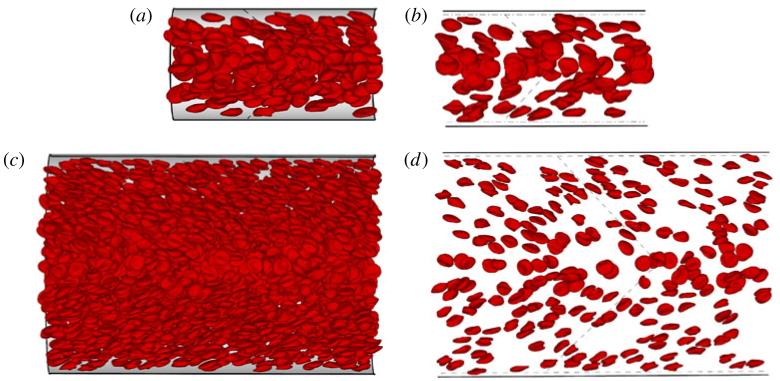
RBCs in blood flow in tubes or microvessels migrate towards the centreline yielding the CFL next to the wall (Goldsmith, Cokelet & Gaehtgens 1989; Cokelet & Goldsmith 1991). This leads to a variation in local RBC density and haematocrit affecting the velocity profiles and flow transport. Figure 3 shows snapshots of the blood flow cut near the centre of the tube for D = 40 and 100 μm. The figures show instantaneous distributions, orientations and deformations of RBCs, but do not capture the non-stationary motions of both the cells and the solvent. The RBC snapshots qualitatively indicate that the CD and haematocrit at the tube centre are higher than those away from the centreline. To support this statement we plot time-averaged, local cell-centre density and haematocrit for different HT and D values in figures 4 and 5.
Figure 3.
(Colour online) Central cut-plane snapshots along the tube axis for D = 40 μm (a,b) and 100 μm (c,d) at HT 0.3: (a,c) half-tube images; (b,d) thin slices across the cut. CFL thickness is shown by dashed lines parallel to the walls. The pseudo-shear rates are for D = 40 μm and for D = 100 μm.
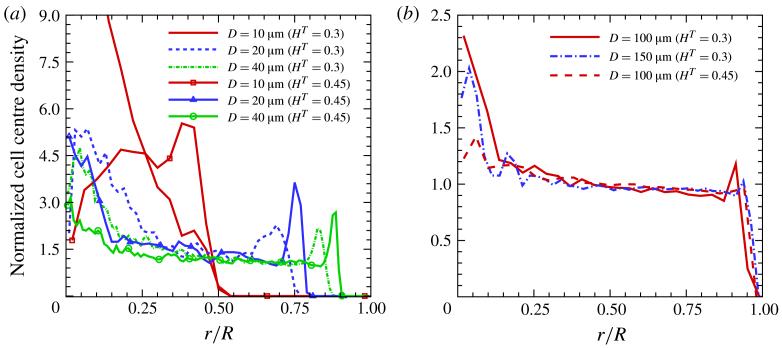
Figure 4.
(Colour online) Radial RBC density distributions normalized by the mean prescribed density: (a) D = 10–40 μm and (b) D = 100 and 150 μm for HT = 0.3 and 0.45. The pseudo-shear rates are , 54.84, 48.81, 41.2 and 46.9 s−1 for the cases D = 10, 20, 40, 100 and 150 μm at HT = 0.3 and , 52.93, 45.56 and 31.2 s− for the cases D = 10, 20, 40 and 100 μm at HT = 0.45.
FIGURE 5.
(Colour online) Local haematocrit distributions normalized by HT: (a) D = 10–40 μm and (b) D = 100 and 150 μm for HT = 0.3 and 0.45. The pseudo-shear rates are , 54.84, 48.81, 41.2 and 46.9 s−1 for the cases D = 10, 20, 40, 100 and 150 μm at HT = 0.3 and , 52.93, 45.56 and 31.2 s−1 for the cases D = 10, 20, 40 and 100 μm at HT = 0.45.
For the smallest tube diameter (10 μm) we observe a significant increase of H(r) in the tube centre (figure 5a), which reflects crowding of RBCs around the centreline. However, the CD distributions in figure 4(a) for D = 10 μm are strikingly different for HT = 0.3 and 0.45. Note that the cell-centre distributions contain information about an average RBC structure within the suspension which may occur in the flow. Thus, the pronounced peak in the CD distribution for D = 10 μm and HT = 0.3 indicates that most RBCs attain a parachute shape and move in trains such that the cell centres are narrowly distributed around the tube centreline. In contrast, the CD distribution for D = 10 μm and HT = 0.45 shows the preferred average positions of cell centres to lie between the tube wall and centreline, which is consistent with the so-called zig-zag motion of RBCs across the flow as observed by Gaehtgens, Dührssen & Albrecht (1980) and simulated by McWhirter et al. (2009).
For intermediate tube diameters (20–40 μm) the main features of the CD distributions (figure 4a) are an increase of the CD around the centreline and a peak next to the CFL region. A larger CD at the tube centre is again due to RBC structure or close packing. At the tube centre, shear rates are small allowing for a closer packing of cells, and therefore RBCs are transported downstream within a certain quasi-persistent structure. This is also reflected by the flat plug-like velocity profile of the flow around the tube centre in figure 1(a). Also, note that the increase in CD and H(r) around the centreline is much more pronounced for the lower simulated HT value. However, away from the tube centre shear rates increase which leads to cell mixing and any close-packed structure is destroyed. In the region between the centre and CFL both CD and H(r) are lower than those in the tube centre. Also, within this region the cell suspension appears to be nearly uniform in the radial direction, which is reflected by nearly flat CD and H(r) distributions in figures 4(a) and 5(a). Finally, a peak next to the CFL reflects another property of the flow. It appears that next to the CFL most RBCs are aligned with the flow and form a layer of aligned RBCs. Since RBC centres in this layer have similar radial positions, a peak in the CD distributions is observed. However, this property is virtually absent in the H(r) distributions where the peaks next to the CFL nearly subside.
For the larger tubes (D = 100 and 150 μm) similar features in the CD and H(r) distributions, as discussed above, are found and shown in figures 4(b) and 5(b). Thus, a central peak gives way to a plateau value close to the bulk HT, while the distributions vanish abruptly as the CFL is approached. In agreement with the results for the small tube diameters, the variations in the CD and H(r) distributions become smaller as HT is increased.
2.3. RBC deformation and orientation
The profiles of concentration and velocity reflect the changes of shape and orientation of the RBCs as they are transported by the flow. Snapshots of cells in the planes cut along the tube axis are illustrated in figure 3. They provide visual correlations of cell shapes and orientations corresponding to the haematocrit and velocity profiles and show how these characteristics vary across the section. Quantitative analysis of cell shape changes along the radius can be performed using the RBC gyration tensor (Mattice & Suter 1994). We define cell asphericity as follows
| (2.2) |
where λ1 ≤ λ2 ≤ λ3 are the eigenvalues of the gyration tensor. While the eigenvalues λi characterize cell shapes along the main directions defined as the tensor eigenvectors, cell asphericity shows how far a cell shape departs from a sphere such that A = 0 for a sphere and A = 1 for an infinitely long thin cylinder.
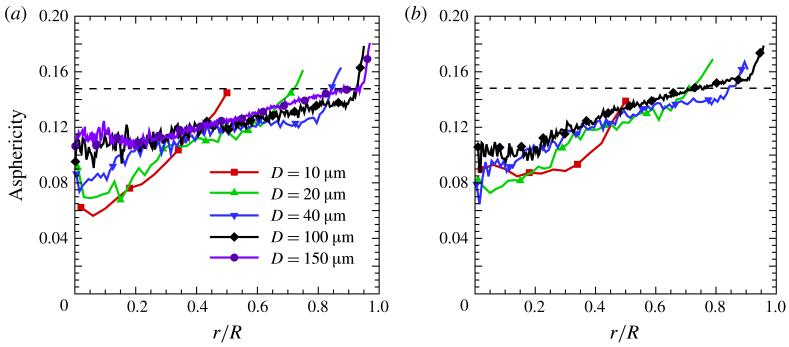
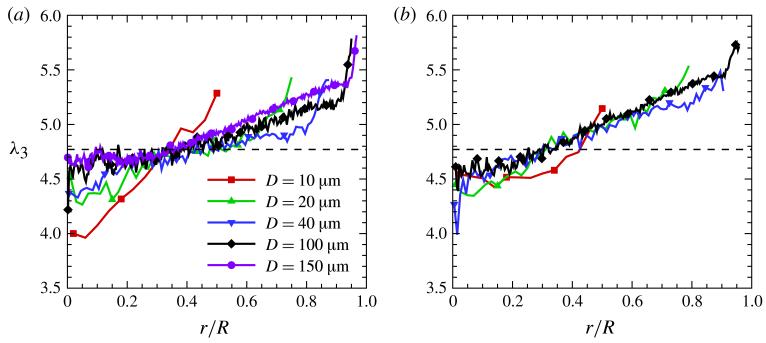
The asphericity distributions are presented in figure 6 for various tube diameters and HT values. The horizontal dashed line corresponds to the asphericity of a RBC in equilibrium. The RBC asphericity falls below its equilibrium value at almost all radial positions, except right next to the CFL. This indicates that RBCs tend to deform into a more spherical shape. Moreover, the asphericity distributions for larger tube diameters (D > 40–50 μm) show three distinct regions: (i) a centreline region, where A is nearly constant; (ii) the region between the centre and CFL, where A increases monotonically with a nearly constant slope; and (iii) A increases steeply next to the CFL. It is also clear that for large enough D the function of A(r) converges to a common curve and therefore becomes independent of the tube diameter. Next to the CFL, cells are subject to the highest shear rates, which lead to their elongation shown in figure 7 by the largest eigenvalue λ3. The cell elongation distributions show that RBCs are slightly compressed in the centre of the tube and become more stretched than in equilibrium at the mid-point as we approach the CFL region due to shear rate increase. The λ3 distributions can be also qualitatively divided into the three regions similarly to the A distributions above.
Figure 6.
(Colour online) Asphericity distributions for different tube diameters: (a) HT = 0.3 and (b) HT = 0.45. The horizontal dashed line denotes the equilibrium RBC asphericity equal to approximately 0.15. The pseudo-shear rates are , 54.84, 48.81, 41.2 and 46.9 s−1 for the cases D = 10, 20, 40, 100 and 150 μm at HT = 0.3 and , 52.93, 45.56 and 31.2 s−1 for the cases D = 10, 20, 40 and 100 μm at HT = 0.45.
Figure 7.
(Colour online) The largest eigenvalue (λ3) of the RBC gyration tensor for different tube diameters: (a) HT = 0.3 and (b) HT = 0.45. The horizontal dashed line denotes the equilibrium value of λ3 equal to approximately 4.77. The pseudo-shear rates are , 54.84, 48.81, 41.2 and 46.9 s−1 for the cases D = 10, 20, 40, 100 and 150 μm at HT = 0.3 and , 52.93, 45.56 and 31.2 s−1 for the cases D = 10, 20, 40 and 100 μm at HT = 0.45
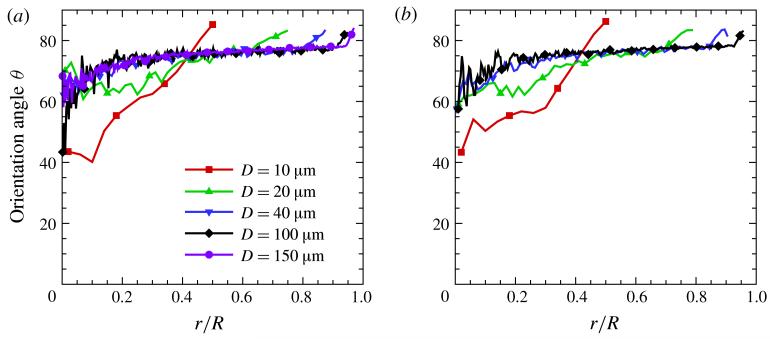
To identify RBC orientation in the tube flow we also plot the cell orientation angle θ in figure 8, which is calculated as the angle between the cell normal and the tube axis. The cell normal is defined by the eigenvector corresponding to the smallest eigenvalue λ1 of the gyration tensor of each cell. The smallest eigenvalue characterizes the RBC thickness in the equilibrium biconcave configuration, while the other two larger eigenvalues correspond to the cell radius. Hence, λ1-eigenvector is a good measure of cell orientation provided cell distortions are not extreme, as might occur in tubes of capillary size with diameters smaller than 8–10 μm. Cell-orientation angles relative to the shear planes show similarity of orientation for the larger tubes. Except for the smallest tube D = 10 μm, the orientations are all larger than 45°, the principal direction of the shear rate tensor.
Figure 8.
(Colour online) RBC orientation relative to the shear planes or tube axis for different tube diameters: (a) HT = 0.3 and (b) HT = 0.45. The pseudo-shear rates are , 54.84, 48.81, 41.2 and 46.9 s−1 for the cases D = 10, 20, 40, 100 and 150 μm at HT = 0.3 and , 52.93, 45.56 and 31.2 s−1 for the cases D = 10, 20, 40 and 100 μm at HT = 0.45.
2.4. Effect of RBC aggregation
The existence of interactive adhesive forces between healthy human RBCs is well-established (Chien et al. 1967). In RBC suspensions undergoing very low deformation rates or in equilibrium, these weak forces induce aggregation of RBCs into structures of stacked discoids or rouleaux which affect the measurable flow properties of the blood (Merrill et al. 1966). In particular, the model of this work (Fedosov et al. 2011) has been used to predict the whole range of experimental values of the Couette viscosity (CV) for both aggregating whole blood and non-aggregating ESs. As the shear rate decreases the CV of whole blood steeply increases relative to that of ESs; in the model this corresponds to the inclusion or exclusion of inter-cellular aggregating forces derived from the Morse potential
| (2.3) |
where r is the distance between cell-membrane vertices of adjacent cells, r0 and De are the zero force distance and well depth of UM(r), respectively, while β determines the range of interaction. For healthy RBCs in homogeneous Couette flow we previously (Fedosov et al. 2011) determined the Morse parameters to be De = 0.3, r0 = 0.3, β = 1.5 with cut-off distance rM = 1.1. These yield maximum adhesive forces between two cells in the range 3–7 pN.
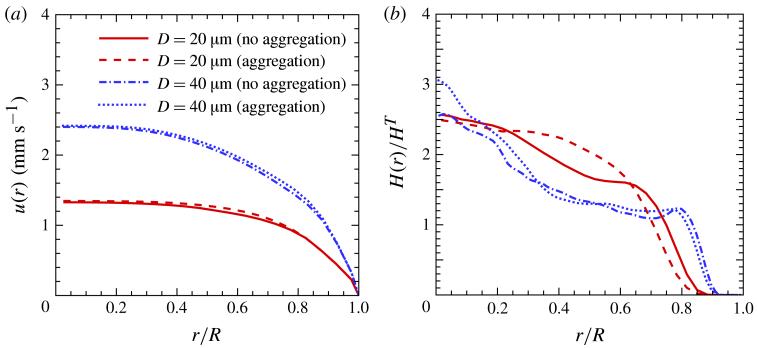
Figure 9 shows the velocity and H(r) profiles for tube diameters D = 20 and 40 μm with attractive inter-cellular forces (dashed lines) and without such forces (solid lines). The H(r) profiles indicate that the effect of adhesion is most pronounced for the smallest tube, D = 20 μm, is only slight for D = 40 μm, and the increase of HT from 0.3 to 0.45 does not alter this response. The velocity profiles are only slightly changed, which suggests that the flow in even larger tubes will be insensitive to normal levels of aggregation. Note that aggregation interactions in whole blood are important for the shear rates below 5–10 s−1, while at larger shear rates rouleaux structures are dispersed completely (Merrill et al. 1966; Fedosov et al. 2011). The characteristic shear rates () of simulated blood flows are considerably above that threshold, and therefore RBC aggregation plays a minor role here. For much smaller pseudo-shear rates the effect of RBC aggregation is expected to be more pronounced.
Figure 9.
(Colour online) Velocity (a) and local haematocrit (b) distributions with and without aggregation inter-cellular interactions for D = 20 and 40 μm with HT = 0.3. The pseudo-shear rates are for D = 20 μm and for D = 40 μm.
2.5. CFL thicknesses
Several types of haematocrit or RBC concentration measures can be introduced, for example the tube haematocrit HT and the discharge haematocrit HD defined in (2.1). The difference HD – HT has long been taken as a measure (Fahraeus 1929) of the effect in which a CFL develops at the wall and becomes more pronounced for smaller tube diameters. Another effect which is directly connected to the thickness of CFL is the Fahraeus–Lindqvist effect (Fahraeus & Lindqvist 1931) that describes a decrease in the apparent blood viscosity with decreasing tube diameter found in experiments of blood flow in glass tubes (Pries et al. 1992).
The CFL thickness δ is observable in vivo (Pries et al. 1989; Maeda et al. 1996; Kim et al. 2007) and is of interest in any study of cross-stream mass transport of the cells moving within the main flow. Experimentally (Bugliarello & Sevilla 1970; Reinke, Gaehtgens & Johnson 1987; Maeda et al. 1996; Kim et al. 2007) δ is measured by direct observation of the cells near the wall whose radial excursions define an irregular edge varying in time along the streamwise direction. The average edge position is taken to be δ, and Fedosov et al. (2010d) adapted this direct method in their simulations. The following alternative measures of CFL thickness are motivated by boundary layer definitions of concentration thickness, and taken to be thin annuli of thickness δ′/2 and δ″/2 respectively defined by the integrals,
| (2.4a) |
| (2.4b) |
where Um is the maximum flow velocity. By means of (2.1) these integrals can be expressed simply in terms of HT and HD as
| (2.5) |
The boundary layer definitions of CFL thickness given above for circular cross-sections are also applicable to non-circular tubes for which the direct method yields δ as a function varying along the perimeter. If the need is for an average value, then the boundary layer definition has the virtue of simplicity.
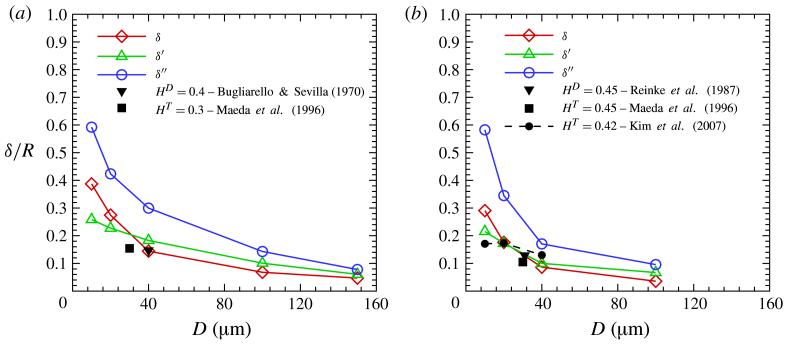
Figure 10 shows the relative CFL thicknesses δ/R using the various definitions above. As expected the relative CFL thickness δ/R decreases with D. The boundary layer definition (equation (2.4)) of δ′ appears to be a relatively good approximation for the CFL thickness for tube sizes >20 μm, while δ″ is about twice as large as δ, and δ″/2 also approximates the CFL thickness very well. The experimental values of Bugliarello & Sevilla (1970) (HD = 0.4 translates into HT ≈ 0.31) and of Maeda et al. (1996) in figure 10(a) are quite close to the simulated values. Good agreement is also found for HT = 0.45 in figure 10(b) between several experimental data points (Reinke et al. 1987; Maeda et al. 1996; Kim et al. 2007) and simulated δ values. The deviation of experimental measurements from the calculated values is most pronounced for in vivo measurements (Maeda et al. 1996; Kim et al. 2007). This may be due to several reasons such as the existence of the glycocalyx layer, inhomogeneous vessel structures (e.g. diameter variations, bifurcations), vessel elasticity and spatial resolution of the measurements (Pries et al. 1989; Maeda et al. 1996; Kim et al. 2007; Fedosov et al. 2010d).
Figure 10.
(Colour online) Relative CFL thicknesses as a function of tube diameter D in micrometres from simulations measured by the direct method and from the identities in (2.5): (a) HT = 0.3 and (b) HT = 0.45. Several available experimental points are also plotted for comparison.
3. Analysis
3.1. Blood viscosity and its scaling
The volumetric flow rate Q and the bulk velocity U = Q/πR2 are derived from the integral of the velocity profile across the tube section. For a neutrally buoyant suspension, the streamwise component of the steady flow equation of motion in terms of the shear stress τ can be regarded as being driven by a force f or an equivalent pressure gradient −∂p/∂x as follows
| (3.1) |
where its first integral is
| (3.2) |
and τw is the wall shear stress. The velocity profiles in figure 1 show that as the tube size decreases the velocity curves become less parabolic, i.e. non-Newtonian. In the range D = 20–40 μm the flow is distinctly non-Newtonian and the haematocrit distributions are correspondingly non-uniform (see figure 5). For D 100–150 μm, the main flow is nearly parabolic except for the CFL region.
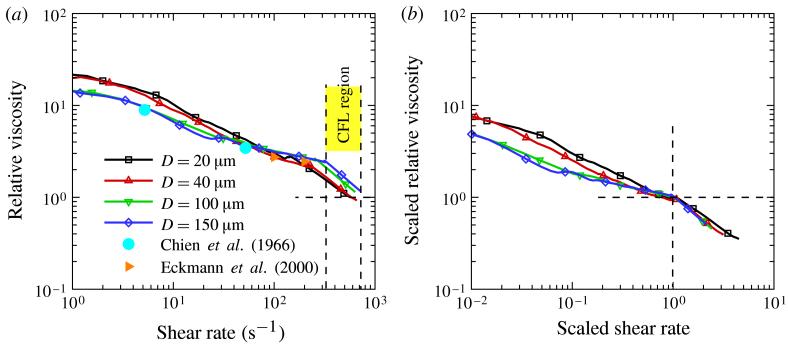
In plane Couette flow the modelled RBC suspensions of this work exhibit non-Newtonian viscosities (Fedosov et al. 2011) dependent on both the shear rate () and H in good agreement with experimental values (Merrill et al. 1963; Chien et al. 1966; Skalak et al. 1981). In previous simulations (Fedosov et al. 2010b) of Poiseuille flow of polymer solutions it was found that the non-Newtonian viscosity as a function of and concentration can be extracted from the profiles of velocity and shear stress. This method contains the local action assumption that stress depends on the local values of and concentration, i.e. the material is assumed to be a continuum locally. For the neutrally buoyant suspensions of this work the shear stress is prescribed (equation (3.2)), and the viscosity across the section is calculated from with the shear rate derived from the velocity profiles by numerical differentiation following the method of Fedosov et al. (2010b). Figure 11(a) shows the relative viscosity (the RBC suspension viscosity normalized by the solvent viscosity) as a function of the local shear rate along with the experimental rotational-Couette viscosities of Chien et al. (1966) and Eckmann et al. (2000). The experimental points are plotted with symbols at constant shear rates 5.2, 52, 100 and 200 s−1. From figure 2, the two lowest rates correspond to the nonlinear region near the centreline of the channel, and from figure 5 for D = 100–150 μm, they correspond to approximately H = 0.5 and 0.4, respectively. The two larger shear rates lie in the linear shear-rate region with H ≈ 0.34. Since the shear rates of figure 11(a) correspond to the shear-rate profile of figure 2, the viscosity can be traced from its low shear-rate value at the centreline as it drops by an order of magnitude to the edge of the CFL and then drops abruptly to the plasma value. The large viscosity drop across the main flow is counter-intuitive in view of the nearly parabolic velocity profile of figure 1 and the mildly varying H in figure 5. However, the main viscosity drop occurs for shear rates which correspond to the nonlinear region near the tube centre.
Figure 11.
(Colour online) (a) Relative viscosity (the cell suspension viscosity normalized by the solvent viscosity) versus shear rate for D = 20, 40, 100 and 150 μm at HT = 0.3. Experimental values are shown by symbols in solid colour. The vertical dashed line gives the position of the CFL for D = 150 μm. (b) Relative viscosity with respect to the shear rates scaled by their values at the CFL transition points.
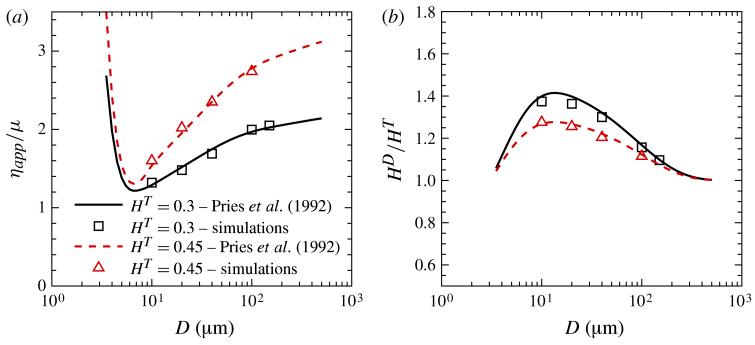
At the CFL edge the relative viscosity abruptly changes the slope and the viscosity ηcf/μ and shear rate at the abrupt transition are used as scale factors to produce figure 11(b), where the dimensionless scaled viscosity is plotted as a function of dimensionless scaled shear rate. Table 1 presents various characteristics at the abrupt transition. The fourth column gives the experimental relative apparent viscosities ηapp/μ (Pries et al. 1992). They suggest that Poiseuille flow in small tubes yields apparent viscosities which lie between the plasma viscosity and the value at the inner edge of the CFL, and approach the latter as the relative CFL thickness δ/R → 0. It will be shown below in figure 13 that the apparent viscosities predicted by the DPD model are in good agreement with the experimental values of ηapp/μ.
Table 1.
Scaling parameters for different tube diameters at HT = 0.3 including the shear rate and viscosity ηcf/μ at the CFL edge. The relative apparent viscosity ηapp/μ (Pries et al. 1992) and the CFL thickness δ are also included.
| D (μm) | ηcf/μ | ηapp/μ | δ (μm) | |
|---|---|---|---|---|
| 20 | 140.4 | 2.72 | 1.52 | 2.74 |
| 40 | 208.8 | 2.36 | 1.75 | 2.88 |
| 100 | 262.5 | 2.51 | 1.97 | 3.39 |
| 150 | 331.4 | 2.33 | 2.02 | 3.52 |
Figure 13.
(Colour online) (a) Relative apparent viscosity ηapp/μ and (b) discharge-to-tube haematocrit ratio HDHT. Curves are the fits to experimental data (Pries et al. 1992) and points are from DPD simulations for different tube diameters.
The shear rate and viscosity at the abrupt transition in figure 11(a) correspond closely to the position of the CFL thickness δ. Inspection of the relative viscosity curves suggests that they have a degree of similarity which implies that the viscosity is a two-parameter function of the strain rate, and therefore the viscosity curves in figure 11(a) are rescaled with ηcf and and shown in figure 11(b). In the vicinity of the scaled curves superpose within numerical accuracy whereas in the central region they separate. For the larger tubes (D = 100–150 μm) this separation of the curves is not significant, but for the smaller ones the departure is clear. Experimental Couette viscosities, given by the function , define a similarity viscosity function across the section of the larger tubes in figure 11(a). Moreover, the asphericity, λ3, and cell-orientation angle distributions presented in figures 6, 7 and 8 show clear similarity for the larger tubes consistent with their viscosities, when plotted against the scaled shear rate. These similarity relations for various blood flow properties can be used in a heterogeneous continuum theory such as that proposed by Moyers-Gonzalez & Owens (2010).
The agreement between simulated viscosity distributions and experimental values for larger tube diameters is consistent with the local viscosity in Poiseuille flow being the function as that which characterizes spatially homogeneous shear flow. However, the departures of the viscosity distributions from the experiment for the smaller tubes suggest that the continuum assumption may not be valid for tube diameters <100 μm. Thus, the main finding of this work is the quantification of the transition from a continuum to a non-continuum description as tube size decreases. Continuum models of materials, whether homogeneous or heterogeneous, are based on constitutive equations which assume the principle of ‘local action’, which means that within a material domain the stress is describable in terms of independent variables associated with each material element. The combination of the constitutive equation with the conservation laws results is a system of field equations which hold for every point in the domain, while boundary conditions are imposed on the solutions of the field equations. In the simple case of steady shear flow, where a RBC suspension is homogeneous, the viscosity or the stress are function of the shear rate and H. In contrast, a RBC suspension in Poiseuille flow (e.g. in small vessels) may be very inhomogeneous and figure 11 shows the increasing departure of the relative viscosity from Couette data (Chien et al. 1966; Eckmann et al. 2000) as the tube size decreases. Recall that our model (Fedosov et al. 2011) agrees very well with these data in uniform shear flow. This means that for small tubes the local viscosity or stress depends also on tube size, and hence no longer satisfies the principle of local action.
3.2. Velocity distribution in the CFL
The velocity profiles displayed in figure 1 suggest that in the CFL the velocity has an expansion in y = R – r, the distance from the wall,
| (3.3) |
where uy(0) and uyy(0) are the wall values of the first and second derivatives, respectively. Adjacent to the wall the value of the viscosity μw is initially assumed to be the plasma value μ so that uy(0) = τw/μ. At the wall the lines tangent to the velocity profiles in figure 1 confirm this assumption for HT = 0.3, but the HT = 0.45 near-wall velocity data seem to differ slightly from tangency. It appears that the effective wall-viscosity can increase beyond the plasma value as the cell packing density increases. In turbulent pipe flow it has been verified experimentally that the wall viscosity is indeed the fluid’s molecular viscosity, where wall variables are used to scale u and y such that very near the wall, in the viscous sublayer, they are O(1). For the RBC suspension, wall-variable scaling of (3.3) is assumed to be as follows
| (3.4a) |
| (3.4b) |
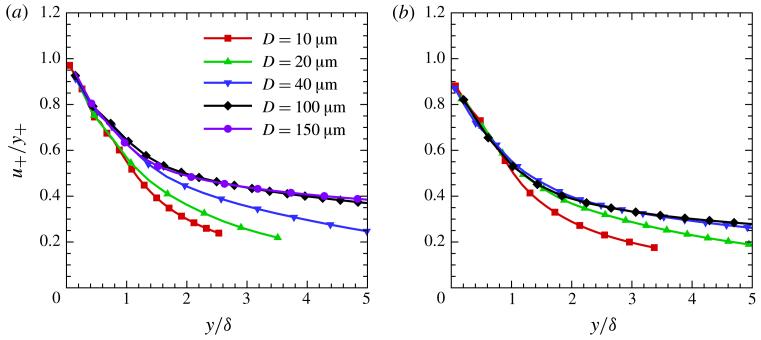
where ν = μ/ρ is the solvent kinematic viscosity. In the turbulent pipe flow, the description of the viscous sublayer beyond the linear term in expansion (3.3) requires the next term to be O(y4) (Spalding 1961). For the RBC suspension there is no ‘a priori’ theoretical reason to decide the order of the next term, and its scale is unknown. In (3.4) only the common linear term is scaled with the wall variables of turbulent flow, and the CFL thickness δ is used to scale the terms in parentheses. The validity of this assumption can be tested at constant HT with a plot of u+/y+ for each tube size as a function of the single variable ycf. Figure 12 shows the plots of u+/y+ versus ycf for various tube sizes. For HT = 0.3 the u+/y+ curves come together the CFL region, and extrapolate to unity at the wall. However, for HT = 0.45 extrapolation to the wall yields a wall viscosity ~10 % higher than the assumed solvent viscosity. From the plot, the coefficient a2 in expansion (3.4) is approximately −1/2, and appears to be independent of tube size. For the larger tubes u+/y+ is a function of ycf = y/δ alone up to ycf ~ O(1).
Figure 12.
(Colour online) The velocity-to-wall-distance ratio u+=y+ for various tube diameters at (a) HT = 0.3 and (b) HT = 0.45.
3.3. Dimensional analysis of global resistance variables
The similarities found between the CFL and the laminar sublayer region in turbulent pipe flow suggest that resistance relations between global variables might be described in terms of familiar dimensionless groups. Motivated by turbulent flow in pipes the mean or bulk velocity is scaled with the friction velocity and a dimensionless driving force, the ‘friction’ Reynolds number , is constructed to be independent of velocity. In turbulent pipe flow u* and R+ are said to be defined in terms of ‘wall’ variables. However, for suspensions the wall viscosity is an unknown and at higher volume fractions it may vary from the solvent’s viscosity as was shown above. Tube-size effects investigated in this work require the inclusion of the ratio S = R/Rcell (Rcell is the cell radius) as a relevant dimensionless parameter. Other groups can be composed from membrane and cell properties such as the dimensionless ratio (ρmGmRcell2)/μm2 where Gm, μm and ρm are the membrane’s shear modulus, viscosity and surface area density, respectively. The viscosity contrast μi/μ, where μi is the inner cytosol viscosity is often varied in simulations. However, in this work these groups are fixed at their healthy human blood values. Dimensional analysis now suggests the following dimensionless functional relations:
| (3.5) |
where the fi(R+, S, HT, …) are unknown functions, and … stands for variables held constant. It is useful to recall that , where λ is the friction factor, and thus f1(·) is a discharge function of the dimensionless driving force R+ at constant S and HT. However, while these general relations bear some resemblance to the well-known resistance correlations for turbulent flow in pipes, the specific forms of the functions are unlikely to be similar. Omitted from the list of independent variables is one which contains a characteristic modulus reflecting the RBC membrane elasticity. With fixed membrane properties the deformation of RBCs is a consequence of the flow driven by the imposed pressure gradient, already included in R+. In a monodisperse model with parameters fitted to represent normal human blood at the physiological temperature an elasticity parameter in the functions (3.5) will be needed only for comparisons with abnormal human blood or that of other species.
In the limit HT = 0, Poiseuille’s law determines the discharge law to be U+ = R+/4. For blood the favoured measure of resistance is the apparent viscosity ηapp motivated by Poiseuille’s law. In terms of both dimensional and dimensionless variables the apparent viscosity is expressible as ηapp/μ = Rτw/(4Uμ) = R+/(4U+). The familiar Fahraeus–Lindqvist plot (Fahraeus & Lindqvist 1931; Pries et al. 1992) represents experimental data of ηapp/μ at constant HD as a function of dimensional D, which for a monodisperse suspension is equivalent to S. A goal of simulations of RBC suspensions in tube flow is the determination of the validity of the functional dependencies implied by (3.5). These dimensionless functional relations are shown in figure 13 as relative apparent viscosity and HD/HT plotted against D, essentially S for constant Rcell, and in figure 14 as U+ versus R+. The solid curves in figure 13 and the dashed lines in figure 14 were calculated from the correlations of Pries et al. (1992).
Figure 14.
(Colour online) Dimensionless bulk velocity U+ as a function of friction Reynolds number R+ at (a) HT = 0.3 and (b) HT = 0.45. The dashed lines are calculated from correlations of Pries et al. (1992), while DPD simulations are shown by filled symbols for D = 10 μm (triangle), D = 20 μm (diamond), D = 40 μm (gradient), D = 100 μm (square) and D = 150 μm (circle).
Figure 14 shows that for the larger tubes D > 100 μm flow resistance at HT = 0.3 is independent of S, whereas for smaller tubes S must be retained as an independent variable in the resistance function of (3.5). This is consistent with the viscosity distributions of figure 11 and with other distributions of single RBC properties shown in figures 6–8. The correlations of Pries et al. (1992) omit dependence on the driving pressure gradient or the average strain rate U/D. The dimensionless equivalent for the resistance correlations is
| (3.6) |
where (3.6) is an approximate statement of functional dependence. The experiments of Reinke et al. (1987) show essentially constant ηapp/μ at normal physiological U/D values with a rise as rate diminishes. The breadth of the constant ηapp/μ region depends on the suspending solvent; with suspensions of RBCs in plasma having the broadest plateau with a fairly abrupt rise at low rates, while RBCs in saline yield gradually varying functions of U/D. Hence, (3.6) is not valid for the latter. For an 11 μm tube, Freund & Orescanin (2011) demonstrated the rise of ηapp/μ at small U/D. Unlike the Poiseuille-flow solid line for the Newtonian plasma, the dashed lines in figure 14 do not extrapolate to the origin, and they would do so only if the resistance relation in (3.6) becomes functionally exact. The slope of each line in figure 14 is determined by a point on the relative apparent-viscosity curve in figure 13(a). In Pries et al. (1992) the relative apparent viscosity correlation with D is derived from the data taken from a number of sources. It is not clear whether the considerable scatter is due to the variability inherent in measurements made in different laboratories on a fragile material, or due to the omission of either the pressure gradient or the average strain rate as a dependent variable. The omission of the driving pressure gradient from the correlation of HD/HT is consistent with (3.6). It is well-known that in turbulent flow at high Reynolds numbers certain hydraulic coefficients become constant, such as the friction factor at constant finite pipe roughness or the drag coefficient of bluff bodies. It appears that for tube flow of blood suspensions the ratio ηapp/μ is an essentially constant hydraulic coefficient over the range of physiological low-friction Reynolds numbers. (The range of R+ in figure 14 is well below R+ ≈ 65, the turbulence transition in pipe flow of a Newtonian fluid.)
3.4. Newtonian fluid approximation with velocity-slip boundary condition
In the simulation of flow in the large vessels, blood is taken to be a Newtonian fluid with no-slip on the vessel walls. This assumption becomes increasingly tenuous in the micro-circulation for vessel diameters less than ~200 μm. The complexities of blood flow in blood-vessel networks have been reviewed by Popel & Johnson (2005). Flow in long straight tubes is obviously an idealization of these systems, but it can be realized in fairly precise quantitative experiments to provide insights into the in vivo scenario. The DPD simulations of this work are computationally expensive, and this motivates our investigation to extend the continuum model to allow an approximate description of blood flow in tubes with diameters smaller than 200 μm. For gases confined in narrow channels of decreasing size the breakdown of the continuum model manifests itself as jump conditions at the boundaries. For the velocity the adherence condition changes to slip flow along channel walls. Here, we present a very simple, four-parameter slip-flow model for blood suspensions flowing in small tubes of diameter D driven by a pressure gradient dP/dx. Two additional parameters, namely the tube haematocrit HT and the plasma viscosity μ, also need to be specified. With the four specified parameters the correlations of Pries et al. (1992) yield the apparent viscosity ηapp and haematocrit ratio HD/HT. The latter allows the CFL thickness to be estimated as δ′ in (2.5). If available, it may be preferable to employ experimental values of δ and ηapp.
Within the CFL the fluid is taken to be Newtonian with the plasma viscosity μ. Under the action of the prescribed pressure gradient the velocity ucf(r) is the Poiseuille field,
| (3.7) |
The first step employs the mean velocity U0 and the centroid position R0 of ucf(r) within the CFL defined by the integrals,
| (3.8a) |
| (3.8b) |
The flow beyond R0 is ‘skimmed off’ and hence the tube radius is effectively reduced to R0 with a slip velocity of ucf (R0) along the adjusted boundary. However, to conserve the total volumetric flow in the reduced tube the flow skimmed off is accounted for as a uniform flow across the tube. Hence, the slip velocity is adjusted as follows
| (3.9) |
Within the reduced tube the fluid is also taken to be Newtonian, but with ‘effective’ viscosity ηeff. The skimmed velocity field usk(r) becomes
| (3.10) |
The total flow rate Q is determined from Poiseuille’s law with ηapp given by the Pries et al. (1992) correlation, or by integration of the DPD simulation velocity profiles. The total flow rate in the reduced tube is the integral of usk(r) across the reduced section, and hence ηeff is determined by the equality,
| (3.11) |
The simple velocity-slip model we propose can be summarized as follows.
Specify the values of tube diameter D, pressure gradient dP/dx, tube haematocrit HT and the blood plasma viscosity μ.
With the above four parameters above, obtain the apparent viscosity ηapp and haematocrit ratio HD/HT from the correlation of Pries et al. (1992). The latter allows the CFL thickness to be estimated by (2.5).
In the CFL region, compute the mean velocity U0 and the centroid position R0 by (3.8).
Compute the slip velocity Us by (3.9) using the centroid position R0.
With Us and R0, approximate the blood velocity profile by (3.10).
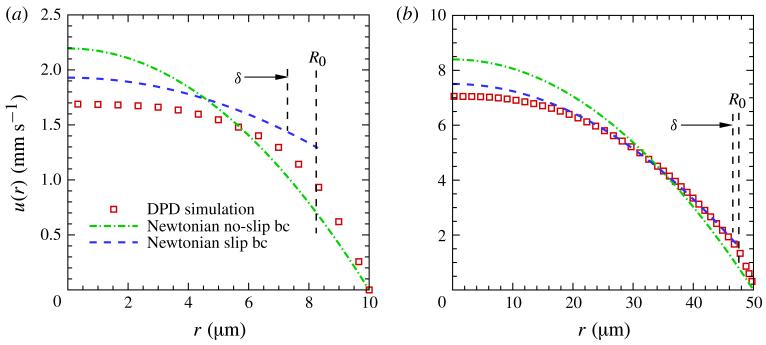
In figure 15 the slip-velocity model in the reduced tubes is compared with the Newtonian no-slip profiles calculated with ηapp and with the DPD simulation velocity profiles presented above for the original tubes. Table 2 summarizes the results for all of the tubes of the simulations. The slip-velocity model and the Newtonian no-slip model are denoted as NewtonianS and NewtonianNS, respectively. The CFL thicknesses are the direct values δ shown in figure 10 and also given in table 1. The viscosity value for Poiseuille flow with no slip (NewtonianNS) is the apparent viscosity which yields the flow rate Q of the DPD simulated flow. Thus, the viscosity is essentially the ηapp defined by Pries et al. (1992), since the latter is accurately predicted by the DPD model as shown in figure 13(a). For the slip-model (NewtonianS) the errors in Um range from ~5 to 14 % as the diameter decreases. It was shown above that flow of the model blood suspension in 20 μm tubes does not satisfy the principle of local action, but an economic continuum calculation with errors of 10 % may be acceptable alternative to an expensive mesoscopic simulation. When only the flow rate is required, then the NewtonianNS model will yield the correct result even though Um will be greatly overestimated. It might be thought that improved estimates of Us and R0 are achievable by use of expansion (3.4) in the CFL, since figure 12 shows the coefficients for the larger tubes to be only weakly dependent on tube size. However, the result would be a smaller Us, and hence a larger error in Um. Improved accuracy calls for improved velocity approximations in both the CFL and the main flow, which in turn calls for the specification of additional parameters. Since the ultimate goal of these models is their capacity to simulate blood flow in the microcirculation, the next step in their development is their extension to tapered tubes with non-circular varying cross-sections.
Figure 15.
(Colour online) Velocity profiles for (a) D = 20 μm and (b) D = 100 μm at HT = 0.3. Squares (shown in red online) denote DPD simulation results displayed in figure 1. The dashed curves (shown in blue online) show the profiles of the slip-velocity model with the wall-slip boundary condition of (3.10) and (3.9). The vertical dashed lines give the position of the CFL and the radius R0 (equation (3.8)) of the adjusted boundary. The dash-dotted parabola (shown in green online) is the no-slip velocity profile for a Newtonian fluid with apparent viscosity calculated from Poiseuille’s law to match the flow rate of the DPD simulation.
Table 2.
Flow rate Q and maximum flow velocity Um calculated in DPD simulations and with the Newtonians and NewtonianNS models at HT = 0.3. The slip velocity Us for the NewtonianS model is also shown. For each tube size D the pressure gradient ∂p/∂x is specified, and the flow rates are set to be equal to determine the effective viscosity by (3.11). The tabulated values for D = 20 and 100 μm correspond to the velocity profiles of figure 15.
| Model | D (μm) | Us (mm s−1) | Q (mm3 s−1) | Um (mm s−1) | ηeff/ηapp | |
|---|---|---|---|---|---|---|
| DPD | 20 | 1.56 × 10⁵ | 0 | 3.45 × 10⁻⁴ | 1.69 | |
| NewtonianS | 20 | 1.56 × 10⁵ | 1.29 | 3.45 × 10⁻⁴ | 1.93 | 2.3 |
| NewtonianNS | 20 | 1.56 × 10⁵ | 0 | 3.45 × 10⁻⁴ | 2.19 | 1.0 |
| DPD | 40 | 7.91 × 10⁴ | 0 | 2.45 × 10⁻³ | 3.14 | |
| NewtonianS | 40 | 7.91 × 10⁴ | 1.37 | 2.45 × 10⁻³ | 3.41 | 1.47 |
| NewtonianNS | 40 | 7.91 × 10⁴ | 0 | 2.45 × 10⁻³ | 3.90 | 1.0 |
| DPD | 100 | 3.16 × 10⁴ | 0 | 3.24 × 10⁻² | 7.03 | |
| NewtonianS | 100 | 3.16 × 10⁴ | 1.62 | 3.24 × 10⁻² | 7.50 | 1.27 |
| NewtonianNS | 100 | 3.16 × 10⁴ | 0 | 3.24 × 10⁻² | 8.39 | 1.0 |
| DPD | 150 | 2.44 × 10⁴ | 0 | 0.123 | 12.44 | |
| NewtonianS | 150 | 2.44 × 10⁴ | 2.07 | 0.123 | 13.08 | 1.18 |
| NewtonianNS | 150 | 2.44 × 10⁴ | 0 | 0.123 | 14.02 | 1.0 |
4. Summary and conclusions
This work has presented results and analysis of DPD simulations of Poiseuille flow of blood suspensions in small tubes in the size range 10–150 μm. The modelled suspension of monodispersed RBCs used here was previously applied in the simulation of homogeneous plane-shear flow by Fedosov et al. (2011). There it was demonstrated to successfully predict the measured CV of whole human blood and washed ESs. The important distinction between Poiseuille flow and homogeneous plane-shear flow is the cross-stream stress gradient whose effects are analysed and compared with available experimental measurements. Below we summarize the main findings of this work.
The simulations yield particle variables whose statistical averages are the continuum field variables (e.g. velocity, haematocrit), which are presented above as radial distributions across tube sections. The non-uniform cell number-density profiles reveal the main effects of the cross-stream stress gradient to be a CFL near the tube wall and a concentration peak near the centreline. The response of the suspended cells to the variable shear field is derived from their gyration tensors to measure cell asphericity, deformation and orientation relative to the shear planes. The smoothness of the velocity profiles allows the calculation of strain-rate distributions by numerical differentiation. For the larger tubes, these show a region of linear strain-rate variation beyond the CFL where the haematocrit is nearly constant, whereas for the smaller tubes the strain-rate profiles are nonlinear over the whole section. The imposed linear shear-stress distributions and the calculated strain rates yield local viscosity distributions, which show an abrupt transition at the edge of the CFL. The transition values of viscosity and shear rate are then used to scale the viscosity and other variables to demonstrate their similarity for the larger sizes and increasing departures from similarity with diminishing diameter. In the size range of similar viscosity the curves are in good agreement with experimental CV correlations evaluated at the local shear rate and haematocrit.
The CFL thickness is the most important measure of non-uniformity, and is defined as the average edge position of cell surfaces nearest to the wall. Motivated by boundary layer concepts, two alternative measures of CFL thickness were investigated which appear to be good approximations for the average edge position. They provide useful estimates in terms of the tube haematocrit HT, the discharge haematocrit HD and the maximum-to-bulk velocities ratio.
For blood flow in tubes the choice of dimensionless groups to represent resistance and other global variables is motivated by the dimensional analysis of turbulent pipe flow. The introduction of the friction Reynolds number R+ and the expression for the apparent viscosity ηapp/μ = R+/(4U+) provides some insight into the evident success of the dimensional correlations of Pries et al. (1992). For the flow resistance measured as apparent viscosity, these contain no explicit dependence on the driving force which is consistent with ηapp/μ being a function only of the size ratio S and the tube haematocrit HT. Such response is reminiscent of the constancy of the friction factor in rough pipes at high Reynolds numbers, and the similar behaviour of the drag coefficient for bluff bodies. The linearity of ηapp/μ with respect to R+ is a consequence of the low Reynolds numbers of blood flow in small tubes.
The most important finding of this investigation is that for a blood suspension flowing in small tubes, and hence in small vessels, the description of the stress as a continuum, whether homogeneous or heterogeneous, fails once the tube size decreases to ~100 μm. This has been demonstrated above with the viscosity distributions of figure 11 and other flow properties including RBC asphericity, deformation and orientation in figures 6-8.
The computationally costly DPD simulations described above have revealed precise information on the non-continuum character of blood suspension flow in small tubes. However, such computations are not viable for the more complex flows of the micro-circulation, and it remains a goal to extend to smaller vessels the continuum methods employed to simulate blood flow in larger vessels. The velocity-slip model of this work attempts to show that the Navier–Stokes description of the stress combined with slip at the wall yields fairly accurate velocity fields in the main flow. Most importantly this result is achieved with the specification of only two parameters, namely, the plasma viscosity μ and HT, in addition to diameter and driving pressure gradient. Whether the approximation can be extended to tapered tubes with junctions and to unsteady flow is a task for future investigation.
Acknowledgements
This work was supported by the NSF/CBET (0852948), NIH (R01HL094270) grants and the new Collaboratory on Mathematics for Mesoscopic Modelling of Materials (CM4) supported by the Department of Energy. Computations were performed at DOE/ANL (INCITE award) and NSF/NICS facilities. Dmitry A. Fedosov also acknowledges funding by the Humboldt Foundation through the Sofja Kovalevskaja award.
Appendix. Dissipative particle dynamics
Our simulations employ DPD, a mesoscopic simulation method (Hoogerbrugge & Koelman 1992; Espanol & Warren 1995), where each DPD particle represents a virtual cluster of atoms or molecules rather than an individual atom. Different from the molecular dynamics (MD) method, additional dissipative and random forces are included in the particle interactions due to the eliminated degrees of freedom during the coarse-graining procedure (Lei, Caswell & Karniadakis 2010). The DPD governing equations are summarized below.
A.1. DPD governing equations
The standard DPD formulation (Hoogerbrugge & Koelman 1992) with the motion of each particle governed by
| (A 1a) |
| (A 1b) |
where ri, vi and m are the position, velocity and mass of the particle i, and , and are the total conservative, dissipative and random forces acting on the particle i, respectively. Under the assumption of pairwise interactions the DPD forces are given by the sum of the pair interactions with the surrounding particle j, as follows
| (A 2) |
| (A 3a) |
| (A 3b) |
where rij = ri – rj, rij = |rij|, eij = rij/rij and vij = vi – vj Here rc is the cut-off radius beyond which all interactions vanish. The coefficients a, γ and σ represent the strength of the conservative, dissipative and random force, respectively. The last two coefficients are coupled with the temperature of the system by the fluctuation–dissipation theorem (Espanol & Warren 1995) as σ2 = 2γkBT. Here, ξij are independent Gaussian random variables with zero mean and unit variance. The weight functions wD (r) and wR(r) are defined by
| (A 4a) |
| (A 4b) |
where k = 1.0 in the standard DPD method; however, other values of k have been used to increase the viscosity of the DPD fluid (Fan et al. 2006). In the current work we chose k = 0.25.
A.2. Multiscale red blood cell model
The average equilibrium shape of a RBC is biconcave as measured experimentally (Evans & Skalak 1980). The surface area and volume of this RBC are equal to 135 μm2 and 94 μm3, respectively. The RBC membrane is modelled by a network of springs which corresponds to a triangulation on the membrane surface (Discher, Boal & Boey 1998; Fedosov et al. 2010a,c). For each single cell, the free energy is defined by
| (A 5) |
where Vs represents the viscoelastic bond interaction between the cell vertices such that proper membrane mechanical properties can be imposed, Vb represents the bending energy of the cell membrane and Va and Vv represent the area and volume constraints to mimic the incompressibility of the lipid bilayer and the intracellular cytosol. More details on the RBC model and the scaling between the model and the physical units can be found in Fedosov et al. (2010a,c).
A.3. Simulation parameters
The viscosity of blood plasma was taken to be μ = 1.2 × 10⁻³ Pa s, the length, time and force units are
| (A 6a) |
| (A 6b) |
| (A 6c) |
| (A 6d) |
The parameters we use for the different cases are shown in table 3.
Table 3.
Parameters used for the pressure-driven blood flow for different diameters and HT values. The cases with the superscript * were used for a sensitivity study where adhesion interactions were applied between the cells.
| HT | D (μm) | U (mm s−1) | ΔP/L (Pa m−1) | Um (mm s−1) | |
|---|---|---|---|---|---|
| 0.3 | 10 | 0.55 | 54.8 | 2.79 × 10⁵ | 0.79 |
| 0.3 | 20 | 1.1 | 54.84 | 1.56 × 10⁵ | 1.69 |
| 0.3 | 20* | 0.936 | 46.8 | 1.31 × 10⁵ | 1.3 |
| 0.3 | 40 | 1.95 | 48.81 | 7.91 × 10⁴ | 3.14 |
| 0.3 | 40* | 1.61 | 40.3 | 6.78 × 10⁴ | 2.42 |
| 0.3 | 100 | 4.12 | 41.2 | 3.16 × 10⁴ | 7.03 |
| 0.3 | 150 | 7.03 | 46.9 | 2.44 × 10⁴ | 12.44 |
| 0.45 | 10 | 0.46 | 45.84 | 2.83 × 10⁵ | 0.63 |
| 0.45 | 20 | 1.06 | 52.93 | 2.06 × 10⁵ | 1.59 |
| 0.45 | 40 | 1.82 | 45.56 | 1.03 × 10⁵ | 2.89 |
| 0.45 | 100 | 3.12 | 31.2 | 3.28 × 10⁴ | 5.31 |
REFERENCES
- Alizadehrad D, Imai Y, Nakaaki K, Ishikawa T, Yamaguchi T. Quantification of red blood cell deformation at high-hematocrit bloodflow in microvessels. J. Biomech. 2012;45:2684–2689. doi: 10.1016/j.jbiomech.2012.08.026. [DOI] [PubMed] [Google Scholar]
- Barbee JH, Cokelet GR. Prediction of blood flow in tubes with diameters as small as 29 μ. Microvasc. Res. 1971;3:17–21. doi: 10.1016/0026-2862(71)90003-3. [DOI] [PubMed] [Google Scholar]
- Bugliarello G, Sevilla J. Velocity distribution and other characteristics of steady and pulsatile blood flow in fine glass tubes. Biorheology. 1970;7:85–107. doi: 10.3233/bir-1970-7202. [DOI] [PubMed] [Google Scholar]
- Chien S, Usami S, Dellenback RJ, Gregersen MI, Nanninga LB, Guest NM. Blood viscosity: influence of erythrocyte aggregation. Science. 1967;157:829–831. doi: 10.1126/science.157.3790.829. [DOI] [PubMed] [Google Scholar]
- Chien S, Usami S, Taylor HM, Lundberg JL, Gregersen MI. Effects of hematocrit and plasma proteins on human blood rheology at low shear rates. J. Appl. Physiol. 1966;21:81–87. doi: 10.1152/jappl.1966.21.1.81. [DOI] [PubMed] [Google Scholar]
- Cokelet GR, Goldsmith HL. Decreased hydrodynamic resistance in the two-phase flow of blood through small vertical tubes at low flow rates. Circulat. Res. 1991;68:1–17. doi: 10.1161/01.res.68.1.1. [DOI] [PubMed] [Google Scholar]
- Discher DE, Boal DH, Boey SK. Simulations of the erythrocyte cytoskeleton at large deformation. II. Micropipette aspiration. Biophys. J. 1998;75:1584–1597. doi: 10.1016/S0006-3495(98)74076-7. [DOI] [PMC free article] [PubMed] [Google Scholar]
- Dupin MM, Halliday I, Care CM, Alboul L, Munn LL. Modeling the flow of dense suspensions of deformable particles in three dimensions. Phys. Rev. E. 2007;75(6):066707. doi: 10.1103/PhysRevE.75.066707. [DOI] [PMC free article] [PubMed] [Google Scholar]
- Eckmann DM, Bowers S, Stecker M, Cheung AT. Hematocrit, volume expander, temperature, and shear rate effects on blood viscosity. Anesthesia Analgesia. 2000;91:539–545. doi: 10.1097/00000539-200009000-00007. [DOI] [PubMed] [Google Scholar]
- Espanol P, Warren P. Statistical mechanics of dissipative particle dynamics. Europhys. Lett. 1995;30:191–196. [Google Scholar]
- Evans EA, Skalak R. Mechanics and Thermodynamics of Biomembranes. CRC; 1980. [PubMed] [Google Scholar]
- Fahraeus R. The suspension stability of the blood. Physiol. Rev. 1929;9:241–274. [Google Scholar]
- Fahraeus R, Lindqvist T. Viscosity of blood in narrow capillary tubes. Am. J. Phys. 1931;96:562–568. [Google Scholar]
- Fan XJ, Phan-Thien N, Chen S, Wu XH, Ng TY. Simulating flow of DNA suspension using dissipative particle dynamics. Phys. Fluids. 2006;18:063102. [Google Scholar]
- Fedosov DA, Caswell B, Karniadakis GE. A multiscale red blood cell model with accurate mechanics, rheology, and dynamics. Biophys. J. 2010a;98:2215–2225. doi: 10.1016/j.bpj.2010.02.002. [DOI] [PMC free article] [PubMed] [Google Scholar]
- Fedosov DA, Caswell B, Karniadakis GE. Steady shear rheometry of dissipative particle dynamics models of polymer fluids in reverse Poiseuille flow. J. Chem. Phys. 2010b;132:144103. doi: 10.1063/1.3366658. [DOI] [PMC free article] [PubMed] [Google Scholar]
- Fedosov DA, Caswell B, Karniadakis GE. Systematic coarse-graining of spectrin-level red blood cell models. Comput. Meth. Appl. Mech. Engng. 2010c;199:1937–1948. doi: 10.1016/j.cma.2010.02.001. [DOI] [PMC free article] [PubMed] [Google Scholar]
- Fedosov DA, Caswell B, Popel AS, Karniadakis GE. Blood flow and cell-free layer in microvessels. Microcirculation. 2010d;17:615–628. doi: 10.1111/j.1549-8719.2010.00056.x. [DOI] [PMC free article] [PubMed] [Google Scholar]
- Fedosov DA, Pan W, Caswell B, Gompper G, Karniadakis GE. Predicting human blood viscosity in silico. Proc. Natl Acad. Sci. USA. 2011;108:11772–11777. doi: 10.1073/pnas.1101210108. [DOI] [PMC free article] [PubMed] [Google Scholar]
- Freund JB, Orescanin MM. Cellular flow in a small blood vessel. J. Fluid Mech. 2011;671:466–490. [Google Scholar]
- Gaehtgens P, Dührssen C, Albrecht KH. Motion, deformation, and interaction of blood cells and plasma during flow through narrow capillary tubes. Blood Cells. 1980;6:799–817. [PubMed] [Google Scholar]
- Goldsmith HL, Cokelet GR, Gaehtgens P. Robin Fahraeus: evolution of his concepts in cardiovascular physiology. Am. J. Phys. 1989;257:H1005–H1015. doi: 10.1152/ajpheart.1989.257.3.H1005. [DOI] [PubMed] [Google Scholar]
- Hoogerbrugge PJ, Koelman JMVA. Simulating microscopic hydrodynamic phenomena with dissipative particle dynamics. Europhys. Lett. 1992;19:155–160. [Google Scholar]
- Kim S, Long LR, Popel AS, Intaglietta M, Johnson PC. Temporal and spatial variations of cell-free layer width in arterioles. Am. J. Phys. 2007;293:H1526–H1535. doi: 10.1152/ajpheart.01090.2006. [DOI] [PubMed] [Google Scholar]
- Lei H, Caswell B, Karniadakis GE. Direct construction of mesoscopic models from microscopic simulations. Phys. Rev. E. 2010;81:026704. doi: 10.1103/PhysRevE.81.026704. [DOI] [PMC free article] [PubMed] [Google Scholar]
- Maeda N, Suzuki Y, Tanaka J, Tateishi N. Erythrocyte flow and elasticity of microvessels evaluated by marginal cell-free layer and flow resistance. Am. J. Phys. 1996;271:H2454–H2461. doi: 10.1152/ajpheart.1996.271.6.H2454. [DOI] [PubMed] [Google Scholar]
- Mattice WL, Suter UW. Conformational Theory of Large Molecules: The Rotational Isomeric State Model in Macromolecular Systems. Wiley; 1994. [Google Scholar]
- Mcwhirter LJ, Noguchi H, Gompper G. Flow-induced clustering and alignment of vesicles and red blood cells in microcapillaries. Proc. Natl Acad. Sci. USA. 2009;106:6039–6043. doi: 10.1073/pnas.0811484106. [DOI] [PMC free article] [PubMed] [Google Scholar]
- Merrill EW, Gilliland ER, Cokelet G, Shin H, Britten A, Wells RE. Rheology of human blood, near and at zero flow: effects of temperature and hematocrit level. Biophys. J. 1963;3:199–213. doi: 10.1016/s0006-3495(63)86816-2. [DOI] [PMC free article] [PubMed] [Google Scholar]
- Merrill EW, Gilliland ER, Lee TS, Salzman EW. Blood rheology: effect of fibrinogen deduced by addition. Circulat. Res. 1966;18:437–446. doi: 10.1161/01.res.18.4.437. [DOI] [PubMed] [Google Scholar]
- Moyers-Gonzalez MA, Owens RG. Mathematical modelling of the cell-depleted peripheral layer in the steady flow of blood in a tube. Biorheology. 2010;47:39–71. doi: 10.3233/BIR-2010-0558. [DOI] [PubMed] [Google Scholar]
- Popel AS, Johnson PC. Microcirculation and hemorheology. Annu. Rev. Fluid Mech. 2005;37:43–69. doi: 10.1146/annurev.fluid.37.042604.133933. [DOI] [PMC free article] [PubMed] [Google Scholar]
- Pries AR, Ley K, Claassen M, Gaehtgens P. Red cell distribution at microvascular bifurcations. Microvasc. Res. 1989;38:81–101. doi: 10.1016/0026-2862(89)90018-6. [DOI] [PubMed] [Google Scholar]
- Pries AR, Neuhaus D, Gaehtgens P. Blood viscosity in tube flow: dependence on diameter and hematocrit. Am. J. Phys. 1992;263:H1770–H1778. doi: 10.1152/ajpheart.1992.263.6.H1770. [DOI] [PubMed] [Google Scholar]
- Reinke W, Gaehtgens P, Johnson PC. Blood viscosity in small tubes: effect of shear rate, aggregation, and sedimentation. Am. J. Phys. 1987;253:H540–H547. doi: 10.1152/ajpheart.1987.253.3.H540. [DOI] [PubMed] [Google Scholar]
- Sharan M, Popel AS. A two-phase model for flow of blood in narrow tubes with increased effective viscosity near the wall. Biorheology. 2001;38:415–428. [PubMed] [Google Scholar]
- Skalak R, Keller SR, Secomb TW. Mechanics of blood flow. Trans. ASME: J. Biomech. Engng. 1981;103:102–115. doi: 10.1115/1.3138253. [DOI] [PubMed] [Google Scholar]
- Spalding DB. A simple formula for the ‘law of the wall’. Trans. ASME: J. Appl. Mech. 1961;28:455–458. [Google Scholar]


