Abstract
Here we have provided evidence that nitric oxide-cyclic GMP (NO-cGMP) signaling regulates neurite length and migration of immature neurons derived from the medial ganglionic eminence (MGE). Dlx1/2−/− and Lhx6−/− mouse mutants, which exhibit MGE interneuron migration defects, have reduced expression of the gene encoding the α subunit of a soluble guanylate cyclase (Gucy1A3). Furthermore, Dlx1/2−/− mouse mutants have reduced expression of NO synthase 1 (NOS1). Gucy1A3−/− mice have a transient reduction in cortical interneuron number. Pharmacological inhibition of soluble guanylate cyclase and NOS activity rapidly induces neurite retraction of MGE cells in vitro and in slice culture and robustly inhibits cell migration from the MGE and caudal ganglionic eminence. We provide evidence that these cellular phenotypes are mediated by activation of the Rho signaling pathway and inhibition of myosin light chain phosphatase activity.
Introduction
Development of the ganglionic eminences (GEs), which produce basal ganglia projection neurons and interneurons that migrate tangentially to distant targets including the cerebral cortex, is regulated by the Dlx transcription factors. Mice lacking Dlx1 and Dlx2 (Dlx1/2−/− mutants) have a severe defect in interneuron migration (Anderson et al., 1997a; Cobos et al., 2007). Likewise, mice lacking either Lhx6 or Lhx6 and Lhx8 have a partial block in interneuron migration from one GE, the medial ganglionic eminence (MGE), where many neurons remain as a periventricular ectopia (Zhao et al., 2008; Flandin et al., 2011).
Analysis of changes in gene expression in the Dlx1/2−/− and Lhx6−/− mutants has identified candidate regulators of interneuron migration. For instance, the Pak3 kinase is overexpressed in Dlx1/2−/− mutants; reducing Pak3 expression in Dlx1/2−/− mutants partially rescued their migratory defect (Cobos et al., 2007). Reduced Zfhx1b expression in Dlx1/2−/− mutants contributes to interneuron migration defects (McKinsey et al., 2013). CXCR4 and CXCR7 receptor expression is reduced in the Dlx1/2−/− and Lhx6−/− mutants, these receptors guiding interneuron migration in the cortex (Fogarty et al., 2007; Sánchez-Alcañiz et al., 2011; Wang et al., 2011). ErbB4 expression is reduced in the Lhx6−/− mutants; this receptor tyrosine transduces the chemoattractant signal from neuregulin in promoting migration (Flames et al., 2004). Finally, Dlx1/2−/− repress neuropilin2 expression (Le et al., 2007; Long et al., 2009a); neuropilins are coreceptors for semaphorins. Neuropilin/semaphorin signaling, particularly through Sema3A, is implicated in sorting MGE-derived cortical and striatal interneurons (Marín et al., 2001; Nóbrega-Pereira et al., 2008), and regulating their migration in the cortex (Tamamaki et al., 2003).
Semaphorins regulate axon guidance and axon/dendrite specification; Sema3A signaling may mediate these processes at least in part by increasing cyclic GMP (cGMP) concentration through “soluble” guanylyl cyclases (sGCs) (Polleux et al., 1998, 2000; Schmidt et al., 2002; Nishiyama et al., 2003, 2008, 2011; Togashi et al., 2008; Shelly et al., 2011). In many tissues, including striatal medium spiny neurons, sGC are activated by nitric oxide (NO) (Denninger and Marletta, 1999; Lin et al., 2010). cGMP promotes slime mold cell migration (Sato et al., 2009).
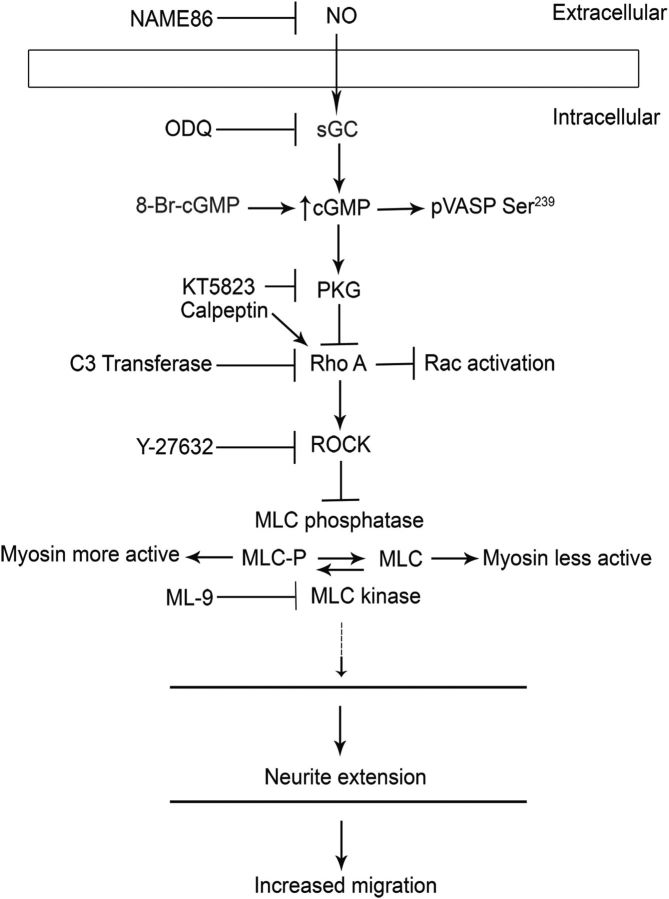
Here we have explored whether the NO-cGMP signaling system regulates the migration of immature neurons in the developing telencephalon. Preliminary analyses of Dlx1/2−/− mutants showed that expression of the α subunit of sGC (Gucy1A3) was decreased in the E15.5 GEs (Long et al., 2009a). Herein we demonstrate that Gucy1A3 is expressed in the dorsal MGE, the primordium where cortical interneurons are generated, where its expression is reduced in Dlx1/2−/− and Lhx6−/− mutants. We show that NOS1 (nNOS) expression in the MGE is lost in the Dlx1/2−/− mutants. We find that Gucy1A3−/− mice have a transient prenatal reduction in cortical interneuron number. Furthermore, pharmacological inhibition of sGC and NOS activity robustly inhibits cell migration from the MGE and caudal ganglionic eminence (CGE) and rapidly induces neurite retraction of MGE cells in vitro and in slice culture. We provide evidence that these cellular phenotypes are mediated by activation of the Rho signaling pathway and inhibition of myosin light chain phosphatase (MLCP) activity (see Fig. 14).
Figure 14.
Schematic diagram proposing the mechanism of cGMP (generated by sGC) mediated neurite extension via inhibition of the Rho signaling pathway in MGE neurons.
Materials and Methods
Animals and tissue preparation.
The following mouse strains (of either sex) were used and genotyped as described in the associated references: Dlx1/2+/− (Anderson et al., 1997a), Lhx6+/PLAP (Choi et al., 2005), Lhx6-GFP (http://www.gensat.org/index.html), Gucy1A3+/− (Buys et al., 2008), and NOS1+/− (Packer et al., 2003). CD-1 females were obtained from Charles River Laboratories. For staging of embryos, midday of the vaginal plug was calculated as embryonic day 0.5 (E0.5). Littermate mice, either male or female (wild-type [WT] or, when not possible, heterozygous) were used as controls for all experiments. Mouse colonies were maintained in accordance with the guidelines set by the author's institutions and the National Institutes of Health.
For embryonic brains (E13.5, E15.5), animals were deeply anesthetized, dissected, and fixed by immersion in 4% PFA in PBS overnight at 4°C. The following day, tissue was cryoprotected by immersion in 30% sucrose, embedded in OCT (Tissue-Tek), cryostat sectioned (20 μm), and used either for in situ hybridization or immunohistochemistry analysis.
In situ hybridization.
Section in situ hybridization experiments were performed using digoxigenin riboprobes on 20 μm frozen sections (from either male or females) as described previously (Jeong et al., 2004). The probes used and their sources are as follows: Gucy1A3 (GenBank accession no. NM_021896), NOS1 (GenBank accession no. BF536292), and NOS3 (GenBank accession no. BC052636). cDNA clones were purchased from imaGenes. An EST clone corresponding to Gucy1B3 (GenBank accession no. BF472368), and cDNA clone corresponding to NOS2 (GenBank accession no. BC062378) were purchased from Open Biosystems.
Immunohistochemistry.
Immunohistochemistry was performed on cryostat sections (20 μm, from either sex) according to Zhao et al. (2008). The primary antibody that was used was rabbit anti-calbindin (CB) (1:1000; Swant). Immunoperoxidase staining was performed by using the ImmPRESS reagent kit (Vector Laboratories). The quantification of calbindin-expressing cortical interneurons in E15.5 and P0, WT, and Gucy1A3−/− mice was performed on 10 × images. Boxes were drawn in the subventricular zone (SVZ) or the cortical plate; the numbers of cells were counted manually. All results are expressed as the mean ± SE of sample size n = 3. Data were analyzed using Student's t test or one-way ANOVA followed by Bonferroni post test to determine the level of significance. p ≤ 0.05 was considered significant, and p ≤ 0.01 was considered highly significant.
Pharmacological compounds.
8-Br-cGMP (a cGMP analog), ODQ (1 H- (1,2,4)oxadiazole (4,3-a)quinoxalin-1-one), guanylate cyclase inhibitor, and KT5823 (protein kinase G [PKG] inhibitor) were all purchased from Enzo Life Sciences. NAME86 (NG-monomethyl-l-arginine, monoacetate salt) was purchased from Calbiochem. Y-27632 was purchased from Sigma. C3 transferase, calpeptin, and EGF were all purchased from Cytoskeleton.
Slice culture and electroporation.
Slices (300 μm) were prepared from E13.5 mouse embryos (from either male or female) (Anderson et al., 1997a). Electroporations (pCAGGS-GFP) followed the methods of Stühmer et al. (2002).
Matrigel explant assay.
The 250 μm coronal vibratome sections were made from E13.5 WT, CD-1 telencephalons (from either sex), followed by microdissection of the MGE and CGE progenitor zones. The explants were embedded in Matrigel and placed into a 6-well insert (1 μm pore size) coated with Matrigel. Fresh slice culture medium, containing different pharmacological inhibitors/analogs, including ODQ, KT5823, NAME86, and 8-Br-cGMP, were added, and then incubated at 37°C with 5% CO2 for 48 h, followed by fixation with 4% PFA, Hoechst 33258 staining, and imaging with a CoolSNAP EZ Turbo 1394 digital camera (Photometric) on a Nikon ECLIPSE 80i microscope (Nikon Instruments). Using the Adobe Photoshop CS3 lasso tool, we drew two outlines around the explant core (original size) and the perimeter of where cells had migrated. The Hoechst-stained total explant area (after outgrowth) was divided by the area of the explant core to assess migration from the explant; results were presented as percentage of explant outgrowth, normalized to control or DMSO-treated explants. We used 4 or 5 explants per embryo, and a total of 2 or 3 embryos were examined per condition in each experiment. All results are expressed as the mean ± SE of sample size n = 3. Data were analyzed using Student's t test or one-way ANOVA followed by Bonferroni post test to determine the level of significance. p ≤ 0.05 was considered significant, and p ≤ 0.01 was considered highly significant.
Primary cell culture.
Primary cultures were made from WT, CD-1, or Lhx6-GFP animals (of either sex) dissociated anterior MGE (VZ/SVZ) as described previously (Xu et al., 2004; Cobos et al., 2005). After a day in culture, the cells were exposed to DMSO or drug (e.g., ODQ); 30 min later, the cells were fixed and studied by immunofluorescence.
Immunocytochemistry.
Immunofluorescence on dissociated cells (Xu et al., 2004) using the following primary antibodies: mouse anti-β-III-tubulin (Tuj1) (1:1000; Covance), chicken anti-GFP (1:1000; Aves Laboratories). Secondary antibodies were as follows: Alexa-488 goat anti-mouse (1:500), Alexa-488 goat anti-chicken (1:500) (Invitrogen).
Boyden chamber assay.
Dissociated MGE cells (E13.5 animals of either sex) were plated on a filter of Boyden chamber inserts (BD Biosciences) with an 8 μm pore size in a 24-well format. A total of 7 × 10³ cells in 200 μl Neurobasal medium supplemented with B27 were added to the top chamber. Cell migration was promoted by adding 10% FBS to the lower compartment of the chamber. Cultures were incubated for 19–22 h with different pharmacological inhibitors/analogs in both chambers. Cells that had remained on the top of the filter were eliminated with a cotton tip. The filters were then stained using HEMA3 stat pack (Protocol). The filter's lower side was imaged on a Nikon ECLIPSE 80i microscope (Nikon Instruments) and counted using ImageJ software (National Institutes of Health) in five randomly selected fields. For Dlx1/2−/− mutants, we used 3 WT and 3 mutant embryos per experiment. For all other Boyden assays, we used 7 WT embryos per experiment. Three independent experiments were performed. Cell migration is displayed as percentage of cells migrating normalized to control or DMSO-treated wells. All results are expressed as the mean ± SE of sample size n = 3. Data were analyzed using Student's t test or one-way ANOVA followed by Bonferroni post test to determine the level of significance. p ≤ 0.05 was considered significant, and p ≤ 0.01 was considered highly significant.
Real-time imaging.
Coronal E15.5 Lhx6-GFP brain slices (200 μm, from either males or females) were treated with DMSO or ODQ for 12 h. After drug treatment, the slices were placed onto nucleopore membrane filters over 35 mm glass-bottom dishes containing MEM (Invitrogen) and 10% FBS. Mounted slices were immediately transferred to a 37°C/5% CO2 live tissue incubation chamber attached to a Zeiss inverted microscope and a PASCAL confocal laser scanning system and imaged repeatedly every 12 min for up to 20 h. Real-time interneuronal migration patterns were quantified using Zeiss LSM Image Browser software. Statistical analysis was performed with the Student's t test using Prism4 software (GraphPad Software).
Protein preparation and Western blotting.
MGE cells were lysed in RIPA buffer containing protease inhibitors (Roche). Western blot was performed as described previously (Cobos et al., 2007). Each experiment was repeated at least three times. The intensity of the bands was quantified using the histogram feature in Adobe Photoshop (CS3). Using the marquee tool in Photoshop, a box was drawn covering one band, and the mean intensity of the value was recorded. The size of the box was consistent throughout the analysis. The mean value was then subtracted from the background. Results were presented as either absolute mean values or percentage of relative protein levels, normalized to control or DMSO-treated cell extracts. Primary antibodies used were obtained from Cell Signaling Technology: rabbit vasodilator-stimulated phosphoprotein (VASP) (1:1000); rabbit anti-pVASP-Ser239 (1:1000), and rabbit anti-phospho-myosin light chain 2 (Ser19) (1:400).
Quantification of neurite length.
Quantification of neurite length was performed in immature interneurons from brain slices (200 μm) or MGE primary cultures prepared with Lhx6-GFP or WT embryos (from either male or females), immunostained for GFP or Tuj1, respectively. Images from brain slices were acquired on a confocal microscope (LSM 510 META NLO, Carl Zeiss) with a 63 × objective. Series of z-stack images (3–5 optical series) were collected, encompassing all neuronal processes of each cell. The length of the longest neurite was quantified using Zeiss LSM Image Browser software. Neurite length of immature interneurons from MGE primary cultures was assessed on digitized images obtained with a CoolSNAP EZ Turbo 1394 digital camera (Photometric) on a Nikon ECLIPSE 80i microscope (Nikon Instruments) using a 40 × objective. Digitized images were imported to ImageJ (National Institutes of Health software) for tracing and quantifying neurites. Experimental results were expressed as length of the longest neurite normalized to DMSO control. Data were analyzed using Student's t test or one-way ANOVA followed by Bonferroni post test to determine the level of significance. p ≤ 0.05 was considered significant, and p ≤ 0.01 was considered highly significant.
Statistical analysis.
All results are expressed as the mean ± SE of sample size n = 3. Data were analyzed using a Student's t test or a one-way ANOVA followed by Bonferroni post test to determine the level of significance. p ≤ 0.05 was considered significant (*), and p ≤ 0.01 was considered highly significant (**).
Results
Soluble guanylate cyclase and NO synthase (NOS) expression in the developing telencephalon
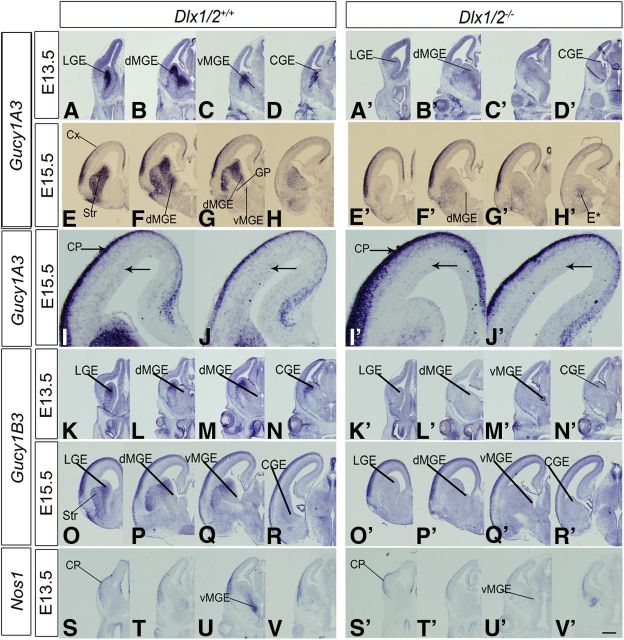
To elucidate the molecular mechanisms underlying the subpallial migration defects in the Dlx1/2−/− mutants (Anderson et al., 1997a, b; Cobos et al., 2007; Long et al., 2007), we previously identified dysregulated genes in the E15.5 GEs using RNA expression array analysis (Cobos et al., 2007; Long et al., 2009a,b). One of the most prominent downregulated genes was Gucy1A3, encoding the α1 subunit of sGC. Gucy1A3 RNA was reduced ∼3.5-fold in the Dlx1/2−/− mutant, which was confirmed by in situ RNA hybridization at E13.5 and E15.5 (Fig. 1A–H′).
Figure 1.
Dlx1/2 regulate the expression of Gucy1A3, Gucy1B3, and Nos1 (nNOS) in the developing basal ganglia. In situ RNA hybridization analysis of Gucy1A3 (A–D′, E–H′), Gucy1B3 (K–N′, O–R′), and Nos1 (S–V′) expression in the telencephalon of WT (left panels) and Dlx1/2−/− (right panels) mice at E13.5 and E15.5. In each case, four planes of hemisections are shown (rostral to caudal). Gucy1A3 expression in the MGE is restricted to the dMGE. By E15.5, Gucy1A3 expression is detected in scattered cells in the cortical SVZ (higher magnification in I–J′ below); this expression is reduced in the Dlx1/2−/− mutants (I′, J′, arrows). Dlx1/2−/− mutants also have reduced Gucy1A3 expression in the SVZ of the LGE and MGE (E13.5 and E15.5); in addition, at E15.5, the mutants have ectopic Gucy1A3 expression in the caudoventral CGE/MGE (H′, E*, arrows), the region that has ectopic interneuron migration (Long et al., 2009b). Gucy1B3 and Nos1 expression is also greatly reduced in the basal ganglia anlage of the Dlx1/2−/− mutants. CGE, Caudal ganglionic eminence; CX, cortex; GP, globus pallidus; Str, striatum. Scale bars: A–H′, K–V′, 500 μm; I–J′, 120 μm.
In WT mice, Gucy1A3 RNA was expressed in most cells of the E13.5 SVZ of the lateral ganglionic eminence (LGE), MGE, and CGE. Within the MGE, its expression was largely restricted to the dorsal MGE (dMGE), the part of the MGE that is largely responsible for generating pallial interneurons (Fig. 1B,B′) (Fogarty et al., 2007; Flandin et al., 2010). On the other hand, the ventral MGE (vMGE), which generates the globus pallidus (Flandin et al., 2010), had low Gucy1A3 expression (Fig. 1C,C′). In the E13.5 Dlx1/2−/− mutant, Gucy1A3 expression was greatly reduced (Fig. 1A′–D′).
At E15.5, Gucy1A3 expression was maintained in the GEs (again at very low levels in the vMGE) and was more prominently expressed in the subpallial mantle zone (MZ), particularly in the striatal neurons (Gucy1A3 expression was not detected in the globus pallidus). In the Dlx1/2−/− mutant, SVZ expression was strongly reduced and MZ expression was moderately decreased (Fig. 1E–H′). Ectopic subpallial expression (E*) (Fig. 1H′) was observed in a caudoventral region; previous analysis showed that this region expressed markers of immature interneurons (e.g., Lhx6) that had failed to migrate to the cortex (Long et al., 2009b).
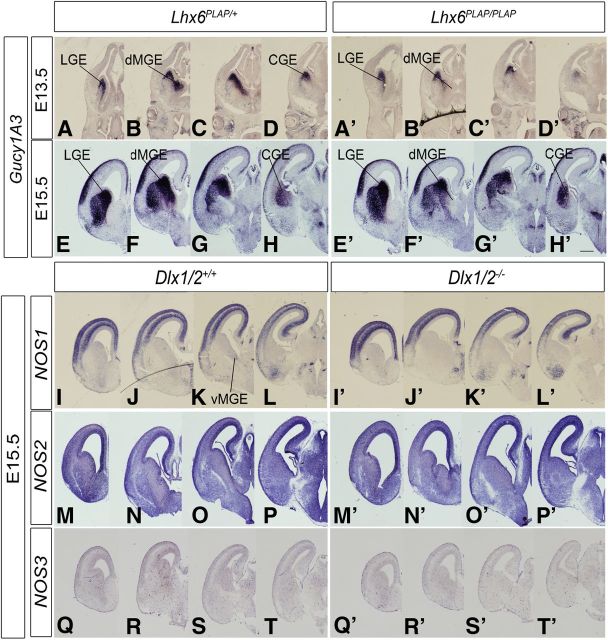
Lhx6 and Lhx6/8 mutants have defects in interneuron migration, including a prominent dMGE ectopia corresponding to a collection of unmigrated cells (Zhao et al., 2008; Flandin et al., 2011). In the Lhx6 null mutant (E13.5 and E15.5), Gucy1A3 expression in the dMGE was greatly reduced (Fig. 2A–H′), thus providing further evidence for a link between Gucy1A3 and interneuron migration.
Figure 2.
Lhx6 regulates the expression of Gucy1A3 in the dorsal MGE. In situ RNA hybridization analysis of Gucy1A3 expression in the telencephalon of Lhx6+/PLAP (heterozgyotes) (left panels) and Lhx6PLAP/PLAP (homozygote mutants) (right panels) mice at E13.5 (A–D′) and E15.5 (E–H′). In each case, four planes of hemisections are shown (rostral to caudal). Expression of Gucy1A3 is specifically lost from the dMGE (B′, F′). I–T′, Expression of NOS1 (nNOS), NOS2, and NOS3 in the developing basal ganglia of WT and Dlx1/2−/− E15.5 mice. In situ RNA hybridization analysis of NOS1 (I–L′), NOS2 (M–P′), and NOS3 (Q–T′) expression in the telencephalon of WT (left panels) and Dlx1/2−/− (right panels) mice at E15.5. In each case, four planes of hemisections are shown (rostral to caudal). Scale bars: A–T′, 500 μm.
In the pallium of WT mice, Gucy1A3 was expressed in cortical plate (CP) and in scattered cells in the SVZ whose location is consistent with tangentially migrating interneurons. Indeed, in the Dlx1/2−/− mutant, pallial SVZ expression was nearly eliminated (Fig. 1I′,J′), supporting the idea that Gucy1A3 is expressed in immature interneurons in the SVZ of the dMGE and as they tangentially migrate to the cortex. These interneurons could also be derived from the CGE, which also has high levels of Gucy1A3 expression (Fig. 1D,H).
Next, we assessed whether other guanylate cyclase subunits were expressed in the E15.5 telencephalon. Similar to Gucy1A3, RNA expression of Gucy1B3 was easily detected at E13.5 and E15.5, where it was largely restricted to the LGE (SVZ and MZ) and CP, with much lower expression in the CGE and MGE (Fig. 1N,R, L,M,P,Q). In the Dlx1/2−/− mutant, subpallial Gucy1B3 expression was nearly eliminated (Fig. 1K′–N′,O′–R′). While Gucy1A3 and Gucy1B3 were the only sGC subunits with strong in situ hybridization expression in the E15.5 subpallium, gene expression array analyses of E12.5 MGE, E15.5 MGE, and P0 cell-sorted purified cortical interneurons detected expression of Gucy1B2, Gucy1B3, and Gucy1A3, whereas Gucy1A2 expression was not detected (Cobos et al., 2007; Stanco et al., unpublished observations). For instance, in P0 interneurons, Gucy1A3 was the most robustly expressed (∼5000 units), and Gucy1B2 and Gucy1B3 were expressed at similar levels (∼450 and ∼1150 units, respectively).
sGCs are activated by NO produced by NOSs (Knowles and Moncada, 1994; Friebe and Koesling, 2003; Stothers et al., 2003; Garthwaite, 2008). There are three NOS genes: NOS1 (nNOS), NOS2, and NOS3; we studied their expression by in situ hybridization. At E13.5, NOS1 expression was detected in a ventral–dorsal gradient in the MGE SVZ, in addition to expression in the cortical plate (Fig. 1S–V). In the E13.5 Dlx1/2−/− mutant, NOS1 expression in the MGE was lost (Fig. 1U′). At E15.5, NOS1 expression in the WT subpallium was greatly reduced, with modest expression in the MGE SVZ (Fig. 2K), whereas cortical expression was strong, particularly in the SVZ and cortical plate (Fig. 2I–L′). NOS2 expression was difficult to discern because of high background; however, there appeared to be expression in the ventricular zones of the cortex, LGE, dMGE, and CGE, with lower expression in the vMGE (Fig. 2M–P). In the Dlx1/2−/− mutants, NOS2 expression increased in the VZ of the LGE and dMGE (Fig. 2M′–P′).
NOS3 expression was prominent in blood vessels throughout the telencephalon; this expression did not change in the Dlx1/2−/− mutants (Fig. 2Q–T′). Thus, subpallial NO could be produced in the VZ by NOS2, in the MGE SVZ by NOS1, and scattered throughout the subpallium by NOS3 in blood vessels. Of these, only NOS1 expression was lost in the Dlx1/2−/− mutants. In summary, Dlx1/2−/− mutants lose subpallial expression of Gucy1A3, Gucy1B3, and NOS1, and thus could have an alteration of cGMP-mediated cellular processes. To investigate whether these gene expression changes could alter the properties of immature cells in the GEs, we studied mouse mutants (Dlx1/2−/−, Gucy1A3−/−, and NOS1−/−) and inhibitors of sGCs (ODQ), NOS (NAME86), and PKG (a kinase activated by cGMP) (KT5823).
Migration defects of Dlx1/2−/− mutant MGE and CGE cells are partially rescued with 8-Br-cGMP, a cGMP analog
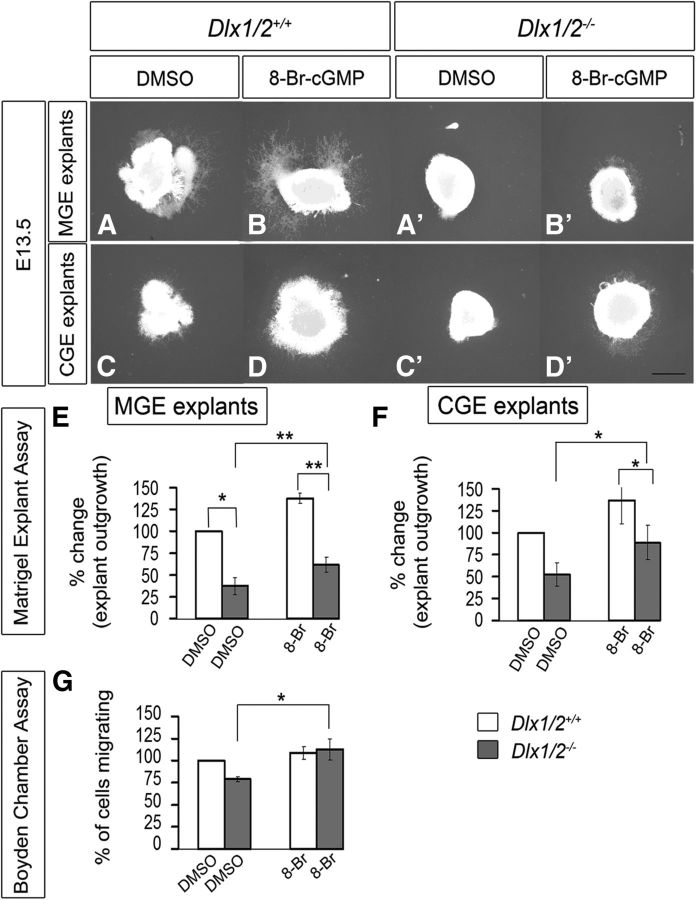
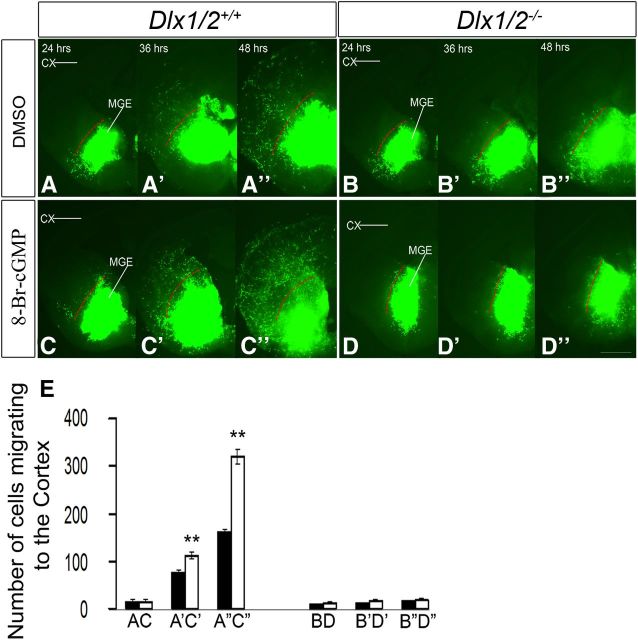
Given the reduced subpallial expression of Gucy1A3, Gucy1B3, and NOS1 in the Dlx1/2−/− mutants, we hypothesized that some of their cellular defects, such as migration, could be the result of changes in cGMP signaling. To test this, we used two migration assays (explant culture and Boyden chamber) to determine whether exposing the cells to the cell-permeable cGMP analog (8-Br-cGMP) would partially rescue their migration defect. Using the explant assay, we confirmed that Dlx1/2−/− mutant MGE and CGE (E13.5) had greatly reduced cellular migration (Fig. 3A′,C′) compared with WT explants (Fig. 3A,C). Addition of 8-Br-cGMP (500 μm) to the Dlx1/2−/− mutant explants induced outgrowth from the mutant MGE and CGE (Fig. 3B′,D′). 8-Br-cGMP also stimulated migration from WT MGE and CGE explants suggesting the cGMP is a positive regulator of migration (Fig. 3B,D). These results are quantified in Figure 3E, F. In the Boyden chamber assay, 8-Br-cGMP did not stimulate migration of WT MGE cells but did stimulate migration of the Dlx1/2−/− mutant MGE cells (Fig. 3G). In the slice migration assay, 8-Br-cGMP stimulated MGE tangential migration to the cortex approximately twofold in WT slices (Fig. 4C–C″, whereas it did not rescue migration of Dlx1/2−/− mutants (Fig. 4D–D″), probably because of the many defects in the Dlx1/2−/− mutants. These results are quantified in Figure 4E.
Figure 3.
8-Br-cGMP mediates a partial rescue of cell migration of MGE and CGE cells from Dlx1/2−/− mutants assessed using Matrigel explants and Boyden chamber assays. A–D′, Matrigel explant cell migration assays of E13.5 MGE and CGE comparing WT (A–D) and Dlx1/2−/− mutants (A′–D′) treated with DMSO (A, A′, C, C′) or 8-Br-cGMP (B, B′, D, D′). E, F, Histograms reporting the percentage change in the MGE (E) and CGE (F) explant outgrowth (normalized to DMSO). Data are the mean ± SEM. *p ≤ 0.05 (paired Student's t test). **p ≤ 0.01 (paired Student's t test). Scale bars: A–D′, 500 μm. A, A′, p = 0.02241; B, B′, p = 0.00884; A′, B′, p = 0.00246. G, Boyden chamber assay showing that 8-Br-cGMP partially rescues the Dlx1/2−/− mutant (p = 0.02645). *p ≤ 0.05. **p ≤ 0.01.
Figure 4.
A–D″, Slice electroporation migration assay. Cells were visualized by transfecting a GFP expression vector into the MGE in either the WT (A–A″, C–C″) or the Dlx1/2−/− mutants (B–B″, D–D″) treated with DMSO or 8-Br-cGMP. Migration into the LGE and cortex was assessed after 24, 36, and 48 h. E, Histogram showing quantification of the number of cells migrating to the cortex from MGE in slices. Data are the mean ± SEM. *p ≤ 0.05 (paired Student's t test). **p ≤ 0.01 (paired Student's t test). A′, C′, p = 0.018; A″, C″, p = 0.0006. Slices were grown in either DMSO or 8-Br-cGMP (500 μm). CX, Cortex. Scale bars: A–D″, 500 μm.
Inhibition of sGC and PKG blocks migration from the MGE and CGE
To investigate the role of sGCs in the tangential migration of MGE- and CGE-derived interneurons, we used a specific inhibitor of sGCs named ODQ (Boulton et al., 1995; Garthwaite et al., 1995; Zhao et al., 2000; Cechova and Pajewski, 2004). We analyzed the effect of ODQ using slice (telencephalic), explants, and Boyden chamber migration assays. In all three assays, ODQ inhibited migration in a dose-dependent manner.
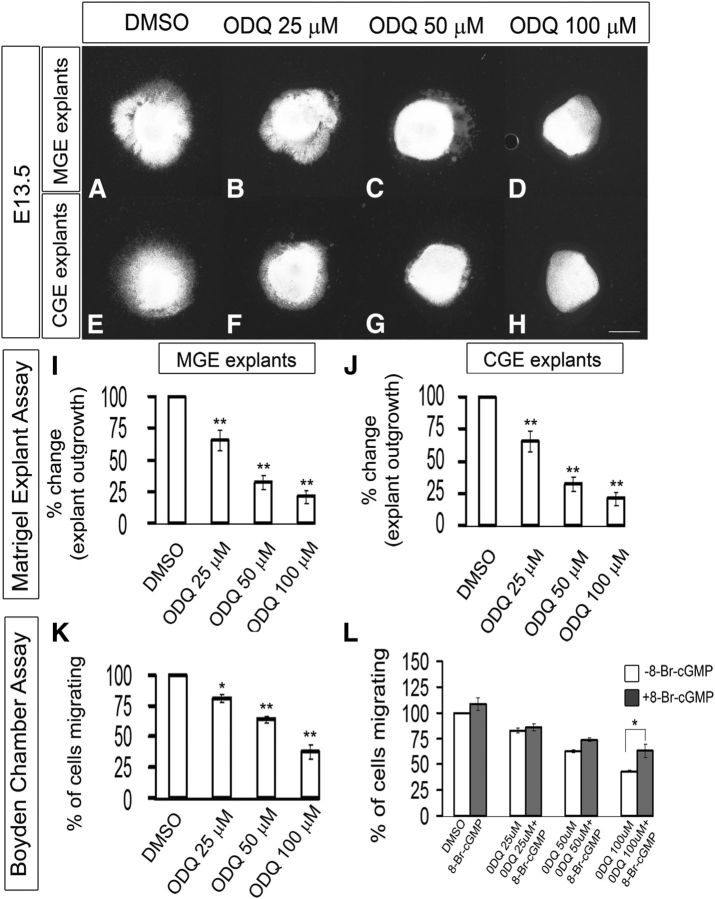
The slice migration assay (using electroporation of GFP into either the MGE or CGE) showed partial inhibition of tangential migration with 25 μm ODQ (Fig. 5B,B′,F,F′,I) and nearly complete inhibition with 50 μm ODQ (Fig. 5C,C′,G,G′,I). The inhibition of tangential migration in both MGE and CGE slices at 50 and 100 μm ODQ at 48 h was statistically significant as quantified in Figure 5I. Similar results were obtained with the explant culture assay (∼70% inhibition with 50 μm ODQ) (Fig. 6A–J); more modest inhibition was detected with the Boyden chamber assay (∼30% inhibition with 50 μm ODQ, ∼60% with 100 μm ODQ) (Fig. 6K). Next, we assessed whether we could rescue the ODQ-induced migration deficits by adding 8-Br-cGMP (500 μm) to ODQ in the Boyden chamber assay. 8-Br-cGMP partially counteracted the effect of 50 and 100 μm ODQ. However, the rescue in migration by 8-Br-cGMP was statistically significant in 100 μm ODQ (Fig. 6L).
Figure 5.
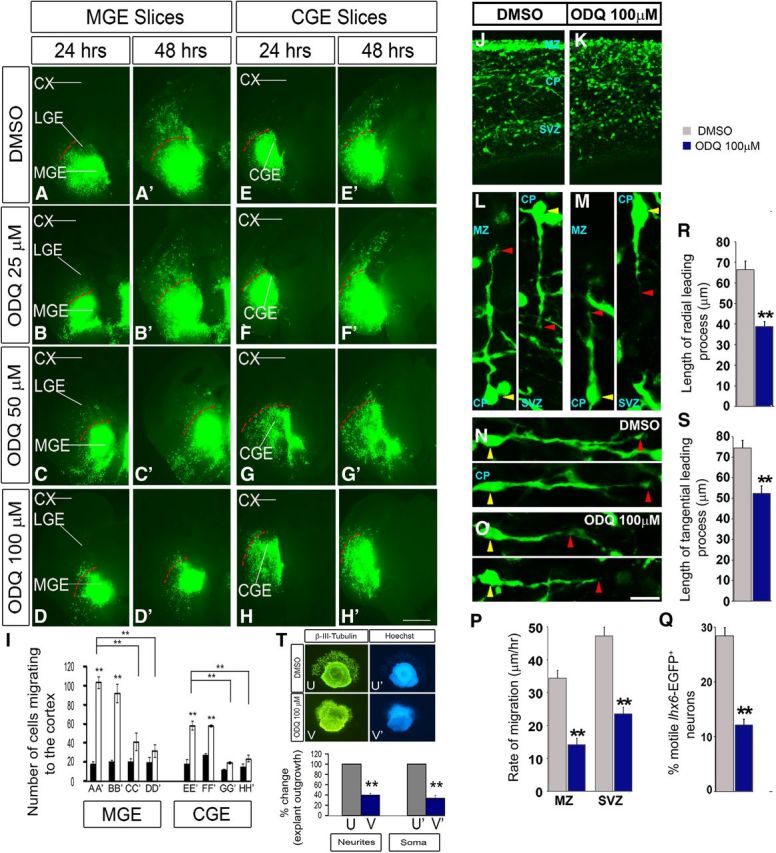
Inhibition of soluble guanlyate cyclase activity with ODQ reduces interneuron process length and migration from the MGE and CGE to the cortex in E13.5 telencephalic slices. Movies 1 and 2 show additional data. A–H′, Slice electroporation migration assay. Cells were visualized by transfecting a GFP expression vector into either the MGE (A–D′) or CGE (E–H′) by electroporation; migration into the LGE and cortex was assessed after 24 and 48 h. I, Histogram showing quantification of the number of cells migrating to the cortex from MGE or CGE in slices. Slices were grown in DMSO, 25 μm ODQ, 50 μm ODQ, or 100 μm ODQ. Data are the mean ± SEM. *p ≤ 0.05 (one-way ANOVA followed by Bonferroni post test). **p ≤ 0.01 (one-way ANOVA followed by Bonferroni post test). A, A′, p = 1.1 × E-6; B, B′, p = 0.00001; A′, C′, p = 0.00358; A′, D′, p = 0.00142; E, E′, p = 1.3 × E-6; F, F′, p = 0.00003; E′, G′, p = 0.00016; E′, H′, p = 0.00037. CX, Cortex. Scale bars: A–H′, 500 μm. J, K, Confocal image showing Lhx6-GFP expression in an E15.5 brain slice (200 μm) treated with either DMSO or ODQ (100 μm) for 1 h. L–O, Interneurons from the CP, oriented in a radial (L, M) or tangential (N, O) direction, are aligned by their cell soma (yellow arrowhead). The leading process length was assessed from the base of the soma to the tip of the leading process (red arrowhead). P, Quantification of rates of tangential migration through the MZ and SVZ are based on live imaging of E15.5 Lhx6-GFP+ ODQ-treated and DMSO-treated control cortices for 12 h. MZ, p = 4.01 × E-7; SVZ, p = 1.84 × E-8. Q, Quantification of the number of motile cells (i.e., cells migrating at a rate of >5 μm/h) within the CP of ODQ-treated and DMSO-treated control cortices (p = 0.00021). R, S, Quantification of leading process length of interneurons oriented in either radial or tangential direction (N = 5). *p < 0.001 (Student's t test). R, p = 1.16 × E-5. S, p = 0.00043. Scale bars: J, K, 110 μm; L, M, 28 μm; N, O, 30 μm. T, Matrigel explant cell migration assays of E13.5 MGE showing the outgrowth of neurites/cell processes (β-III-tubulin+) (U, V) and migration of the soma/nucleus (Hoechst+) (U′, V′) treated with DMSO (U, U′) or ODQ (100 μm) (V, V′). Bottom, Histograms reporting the percentage change in the MGE explant outgrowth. Data are the mean ± SEM. *p < 0.05 (paired Student's t test). **p < 0.01 (paired Student's t test). U, V, p = 0.00011; U′, V′, p = 5.1 × E-6.
Figure 6.
Inhibition of soluble guanlyate cyclase activity with ODQ blocks cell migration from E13.5 explants of the MGE and CGE, assessed using Matrigel explants and Boyden chamber assays. A–H, Matrigel explant cell migration assays of E13.5 MGE and CGE comparing DMSO (A, E), 25 μm ODQ (B, F), 50 μm ODQ (C, G), and 100 μm ODQ (D, H). I, J, Histograms reporting the percentage change in the MGE (I) and CGE (J) explant outgrowth as a function of ODQ dose using one-way ANOVA followed by Bonferroni post test. I, DMSO versus ODQ 25 μm, p = 0.01346; DMSO versus ODQ 50 μm, p = 1.52 × E-4; DMSO versus ODQ 100 μm, p = 4.72 × E-5. J, DMSO versus ODQ 25 μm, p = 0.01044; DMSO versus ODQ 50 μm, p = 0.00245; DMSO versus ODQ 100 μm, p = 3.156 × E-4. Scale bars: A–H, 500 μm. K, Boyden chamber assay showing that progressively increasing concentration of ODQ inhibit more migration. Data are the mean ± SEM. *p ≤ 0.05 (one-way ANOVA followed by Bonferroni post test). **p ≤ 0.01 (one-way ANOVA followed by Bonferroni post test). DMSO versus ODQ 25 μm, p = 0.02589; DMSO versus ODQ 50 μm, p = 4.29 × E-4; DMSO versus ODQ 100 μm, p = 6.73 × E-4. L, Boyden chamber assay showing that 8-Br-cGMP partially counteracted the effect of 50 and 100 μm ODQ. However, the rescue in migration by 8-Br-cGMP was statistically significant in 100 μm ODQ (p = 0.03).
To assess the effect at the single-cell level of reducing Gucy function, we treated slices from an E15.5 Lhx6-GFP-Bac mouse (Cobos et al., 2005, 2007) with ODQ (100 μm) for 1 h and studied the morphology of migrating GFP+ cortical interneurons. ODQ clearly attenuated the length of the tangential and radial leading processes (Fig. 5J–O,R,S); similar rapid responses were also observed in dissociated MGE cells (see Figs. 11A–I and 13A,D).
Figure 11.
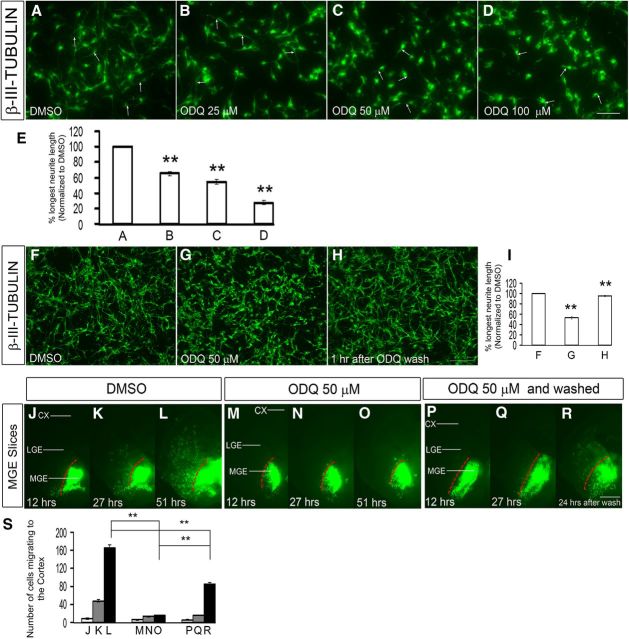
Inhibition of soluble guanylate cyclase rapidly alters the shape of MGE neurons. A–D, Dose-dependent attenuation of MGE neurite length comparing DMSO (A), 25 μm ODQ (B), 50 μm ODQ (C), and 100 μm ODQ (D) treated for 30 min followed by staining using β-III-tubulin (Tuj1) antibodies. Scale bars: A–D, 50 μm. E, Histogram showing the effect of different concentrations of ODQ (A–D) on longest neurite length, normalized to DMSO. A versus B, p = 4.667 × 10⁻⁵; A versus C, p = 5.378 × 10⁻⁶; A versus D, p = 1.535 × 10⁻⁷. F–H, ODQ attenuation of neurite length was reversible when ODQ was washed from the media as shown in H; compare with F (DMSO) and G (50 μm ODQ). Scale bars: F–H, 100 μm. I, Histogram showing the effect on neurite length when ODQ was washed from the media, normalized to DMSO. F versus G, p = 1.8 × E-6; G versus H, p = 3.4 × E-6. J–R, Inhibition of tangential migration from the MGE to the cortex was partially reversible when ODQ was removed from the media after 27 h of ODQ treatment, and image was taken 24 h after the ODQ wash in a slice electroporation experiment as shown in R compared with the unwashed specimen in O. Also compare with M–O (50 μm ODQ) and J–L (DMSO). S, Histogram quantifying the number of cells migrating to the cortex from MGE in slices. Scale bars: J–O, 500 μm. Data are the mean ± SEM. *p ≤ 0.05 (one-way ANOVA followed by Bonferroni post test). **p ≤ 0.01 (one-way ANOVA followed by Bonferroni post test). L, O, p = 1.13 × E-6; L, R, p = 4.5 × E-5; O, R, p = 0.0001.
Figure 13.
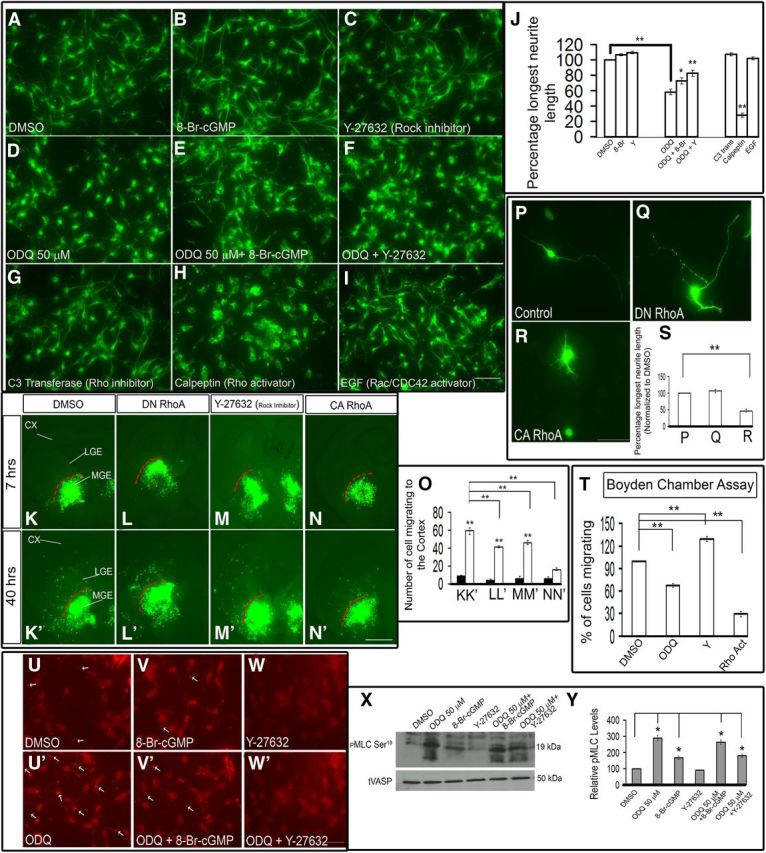
Inhibition of sGC activity with ODQ mediates neurite retraction via the activation of Rho signaling pathway. A–F, ODQ inhibition of neurite length (D) is counteracted by either 8-Br-cGMP (B, E, J) or the ROCK inhibitor Y-27632 (C, F, J). G–J, The RhoA inhibitor C3 transferase (G) and the Rac activator EGF (I) increased neurite length. On the other hand, the RhoA activator calpeptin reduced neurite length (H). Scale bars: A–I, 50 μm. Results are quantified in J. J, DMSO versus ODQ, p = 6.855 × 10⁻⁸; ODQ versus ODQ + 8-Br, p = 0.0296; ODQ versus ODQ + Y, p = 1.288 × 10⁻⁴; DMSO versus calpeptin, p = 8.756 × 10⁻¹². K–N′, Slice electroporation migration assay. Cells were visualized by transfecting a GFP expression vector (K, K′, M, M′) or cotransfecting a GFP expression vector with constitutively active RhoA (CA RhoA) (N, N′), dominant-negative RhoA (DN RhoA) (L, L′) into the MGE (K–N′) by electroporation; migration into the LGE and cortex was assessed after 7 and 40 h. O, Histogram showing quantification of the number of cells migrating to the cortex from MGE in slices. Slices were grown in either DMSO or 10 μm Y-27632 as indicated. Expression of a constitutively active RhoA (CA RhoA) inhibited tangential migration (N, N′) significantly, whereas the dominant-negative RhoA (DN RhoA) and the ROCK inhibitor (Y-27632) did not inhibit MGE tangential migration (L, L′, M, M′). Instead, there was a significant increase in the migration. K, K′, p = 3.9 × E-10; L, L′, p = 4.41 × E-8; M, M′, p = 1.23 × E-8; K′, L′, p = 0.00042; K′, M′, p = 0.01142; K′, N′, p = 3.76 × E-9. CX, Cortex. Scale bars: K–N′, 500 μm. P–R, Expression of a constitutively active RhoA (CA RhoA) (R) construct in MGE neurons reduced the neurite length significantly compared with control (P) or dominant-negative RhoA (DN RhoA) construct (Q). S, Histogram showing the effect on neurite length when dominant active or negative RhoA constructs were expressed in MGE neurons. P versus R, p = 0.00031. Scale bars: P–R, 50 μm. T, Boyden chamber assay showing that both ODQ and the Rho activator (calpeptin) inhibit migration in contrast to Y-27632 (ROCK inhibitor). DMSO versus ODQ, p = 0.0002; DMSO versus Y, p = 0.00039; DMSO versus Rho Act, p = 5.1 × E-7. U–W′, Increased p-MLC phosphorylation staining at distal ends of neurites after ODQ treatment compared with 8-Br-cGMP or Y-27632-treated cells. Scale bars: U–W′, 50 μm. X, Western blot analysis showing increased p-MLC (Ser19) phosphorylation after ODQ treatment in MGE cells. tVASP was used as the loading control. Y, Quantification of the Western blot bands using the histogram tool in Adobe Photoshop (CS3). Results are presented as relative protein levels, expressed in percentage normalized to DMSO-treated cell extracts. Data are the mean ± SEM. J, O, S, T, *p ≤ 0.05 (one-way ANOVA followed by Bonferroni post test). **p ≤ 0.01 (one-way ANOVA followed by Bonferroni post test).
Next, we compared migration rates using live imaging of E15.5 Lhx6-GFP cortical interneurons in ODQ-treated versus DMSO-treated slices (imaging after ∼12 h of ODQ treatment). ODQ resulted in an approximately twofold decrease in the rate of tangential migration through the MZ and SVZ (Fig. 5P), with an approximately twofold reduction in number of CP motile cells (i.e., cells migrating at a rate of >5 μm/h) (Fig. 5Q; Movies 1 and 2).
Interneuron migration in the DMSO-treated Lhx6-GFP+ cerebral wall. Images were obtained from the outlined region of embryonic cortical slices. Image orientation is indicated by the arrows. GE, Ganglionic eminence; CX, dorsal cortex; VS, ventricular surface. In E15.5 DMSO-treated Lhx6-GFP+ control cortices, approximately one-third of Lhx6-GFP+ interneurons within the cortical plate are motile (i.e., cells migrating at a rate of >5 μm/h) and display an elongated leading process. Time length = 4.1 h. See also Figure 5, J, L, N, and P–S.
Interneuron migration in the ODQ-treated Lhx6-GFP+ cerebral wall. Within the cortical plate, the number of motile interneurons and the leading process length of tangentially and radially migrating interneurons are significantly decreased in E15.5 ODQ-treated Lhx6-GFP+ cortices compared with DMSO-treated controls. Approximately 5 h after ODQ treatment, interneuron leading process length and motility return to control levels (data not shown). Time length = 3.9 h. GE, Ganglionic eminence; CX, dorsal cortex; VS, ventricular surface. See also Figure 5, K, M, O, P–S″.
These results were supported using the explant migration assay, where we found that ODQ inhibited the migration of both the soma/nucleus (Hoechst+) (Fig. 5T,U′,V′) and the outgrowth of neurites/cell processes (β-III-tubulin+) (Fig. 5T–V) from the explants.
To assess whether the decreased migration was affected by changes in cell proliferation, we measured the percentage of cells in M-phase of the cell cycle using PH3 immunofluoresence in MGE-dissociated cells; we found no significant effect on the number of PH3+ cells, even up to 100 μm ODQ (data not shown). Furthermore, ODQ treatment did not increase the number of apoptotic cells (caspase-3 antibody staining; data not shown). Thus, ODQ did not reduce the numbers of migrating cells by altering proliferation or cell death.
cGMP signaling is mediated in part through activation of PKG (Wall et al., 2003; Francis et al., 2010). We inhibited PKG pharmacologically using KT5823 (Dora et al., 2001; Kwan et al., 2004; Nugent et al., 2009) and assessed cell migration using the slice culture, Matrigel explants, and Boyden chamber migration assays. KT5823-mediated PKG inhibition reduced migration in all the assays (Fig. 7A,B″,C,D–L).
Figure 7.
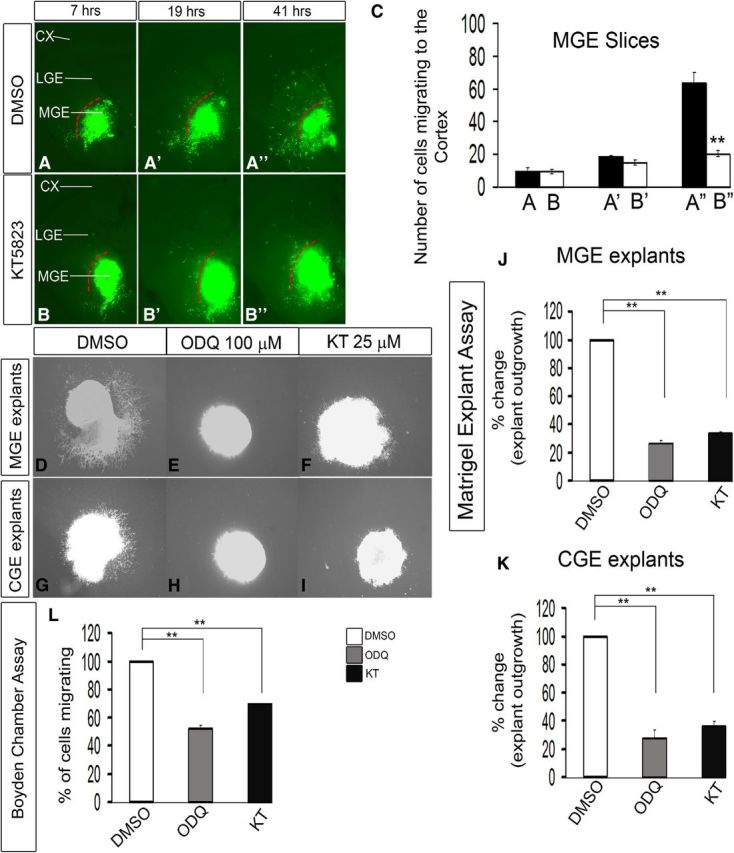
Inhibition of PKG activity with KT5823 reduces interneuron migration from the MGE to the cortex in E13.5 telencephalic slices. A–B″, Slice electroporation migration assay. Cells were visualized by transfecting a GFP expression vector into the MGE (A–B″) by electroporation; migration into the LGE and cortex was assessed after 7, 19, and 41 h. C, Histogram showing quantification of the number of cells migrating to the cortex from MGE in slices. Slices were grown in either DMSO or 25 μm KT5823. CX, Cortex. Data are the mean ± SEM. *p ≤ 0.05 (paired Student's t test). **p ≤ 0.01 (paired Student's t test). A″, B″, p = 7.5 × E-6. Additionally, inhibition of PKG activity with KT5823 inhibits cell migration from explants of the E13.5 MGE and CGE, assessed using Matrigel explants and Boyden chamber assays. D–I, Matrigel explant cell migration assays of E13.5 MGE and CGE comparing DMSO (D, G), 100 μm ODQ (E, H), and 25 μm KT5823 (F, I). J, K, Histograms reporting the percentage change in MGE (J) and CGE (K) explant outgrowth as a function of ODQ and KT5823 using one-way ANOVA followed by Bonferroni post test. DMSO versus ODQ, p = 3.26E-07; DMSO versus KT, p = 6.06E-07. K, DMSO versus ODQ, p = 3.57E-05; DMSO versus KT, p = 7.47E-05. L, Boyden chamber assay showing that both ODQ and KT5823 inhibit migration. Data are the mean ± SEM. *p < 0.05 (one-way ANOVA followed by Bonferroni post test). **p < 0.01 (one-way ANOVA followed by Bonferroni post test). DMSO versus ODQ, p = 1.4 × E-6; DMSO versus KT, p = 2.1 × E-5. Scale bars: A–I, 500 μm.
Gucy1A3−/− mutant mice have a transient reduction of neocortical interneurons
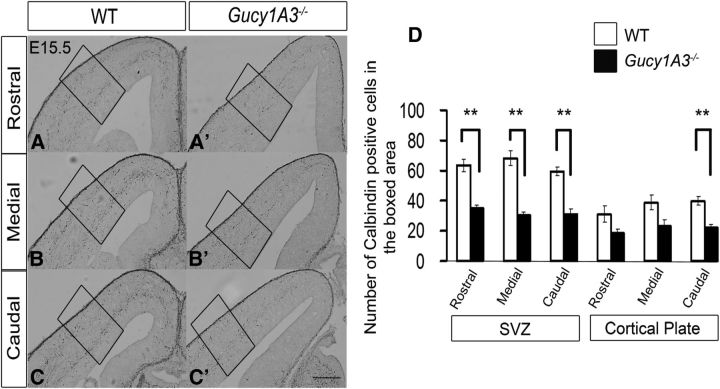
Given that pharmacological inhibition of sGC with ODQ strongly reduced neuronal migration from the MGE, we tested the effect of a loss of function mutation in Gucy1A3, one member of sGC family. As noted above, Gucy1A3 subpallial expression is greatly reduced in Dlx1/2−/− (Fig. 1). Gucy1A3−/− mice are viable and are not reported to have epilepsy; therefore, it is unlikely that they have a severe neuroanatomical defect. Indeed, calbindin+ (CB) interneurons migrating from the Gucy1A3−/− mutant MGE at E13.5 did not show neurite or migration deficits (data not shown). However, at E15.5, we detected a ∼50% reduction in the number of CB+ interneurons in their cortex (Fig. 8A–C′,D). At E15.5, CB is a marker of MGE-derived interneurons (Flames et al., 2004). There was a 50% reduction in the deep migration zone (SVZ) and a 60% reduction in the cortical plate. We did not assess the marginal zone numbers because the CB+ cell density was too high. By P0, Gucy1A3−/− mutants had a subtle reduction in CB+ interneurons in the rostral cortical plate (data not shown).
Figure 8.
Gucy1A3−/− mice have reduced numbers of calbindin+ cortical interneurons at E15.5. Calbindin immunohistochemistry staining of E15.5 coronal hemisections of WT (A–C) and Gucy1A3−/− (A′–C′) telencephalons showing migrating immature cortical interneurons in rostral (A, A′), middle (B, B′), and caudal (C, C′) planes of sections. D, Histogram showing quantification of calbindin+ cell numbers in the cortical SVZ and cortical plate. Data are the mean ± SEM. *p ≤ 0.05 (one-way ANOVA followed by Bonferroni post test). **p ≤ 0.01 (one-way ANOVA followed by Bonferroni post test). SVZ, WT versus Gucy1A3−/− (rostral, p = 0.00317; medial, p = 0.00202; caudal, p = 0.00344); cortical plate (caudal, p = 0.00745). Scale bars: A–C′, 200 μm.
Inhibition of NOS blocks migration from the MGE and CGE
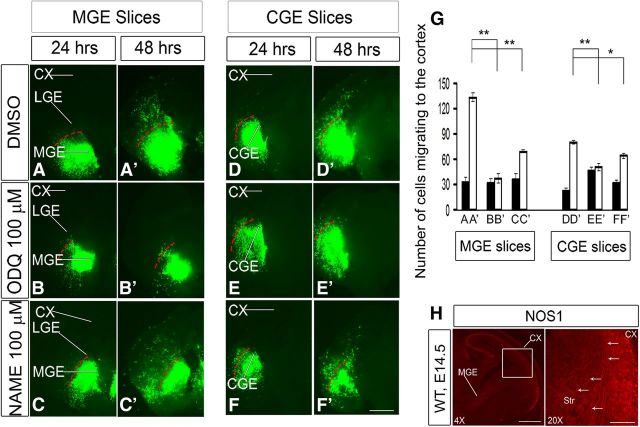
NO activates cGMP production by sGC (Denninger and Marletta, 1999; Lincoln et al., 2001; Ghalayini, 2004; Evgenov et al., 2006; Stasch et al., 2011). Thus, we tested the effect of pharmacologically inhibiting NOS activity using NAME86 (Regli et al., 1996; Georgiadou and Pitsikas, 2011; Mohammadi et al., 2011) on the migration of MGE- and CGE-derived interneurons using slice electroporation (Fig. 9A–F′,G), explants, and Boyden chamber migration assays (Fig. 10A–I). NAME86 treatment reduced migration in all three assays, although not to the extent of 100 μm ODQ (Figs. 9A–F′,G and 10A–I).
Figure 9.
Inhibition of NOS activity with NAME86 inhibits interneuron migration from E13.5 explants of the MGE and CGE, assessed using electroporation slice culture migration assays. Cells were visualized by transfecting a GFP expression vector into either the MGE (A–C′) or CGE (D–F′) by electroporation; migration into the LGE and cortex was assessed after 24 and 48 h. Slices were grown in DMSO, 100 μm ODQ, or 100 μm NAME86. G, Histogram quantifying the number of cells migrating to the cortex from MGE or CGE in slices. Data are the mean ± SEM. *p ≤ 0.05 (one-way ANOVA followed by Bonferroni post test). **p ≤ 0.01 (one-way ANOVA followed by Bonferroni post test). A′, B′, p = 1.3 × E-5; A′, C′, p = 0.00014; D′, E′, p = 0.00235; D′, F′, p = 0.0396. H, NOS1+ expression in E14.5 WT sections. Arrows in the 20 × magnification image indicate NOS1+ in corticofugal axons entering the striatum. CX, Cortex. Scale bars: A–F′, H (left), 500 μm; H (right), 100 μm.
Figure 10.
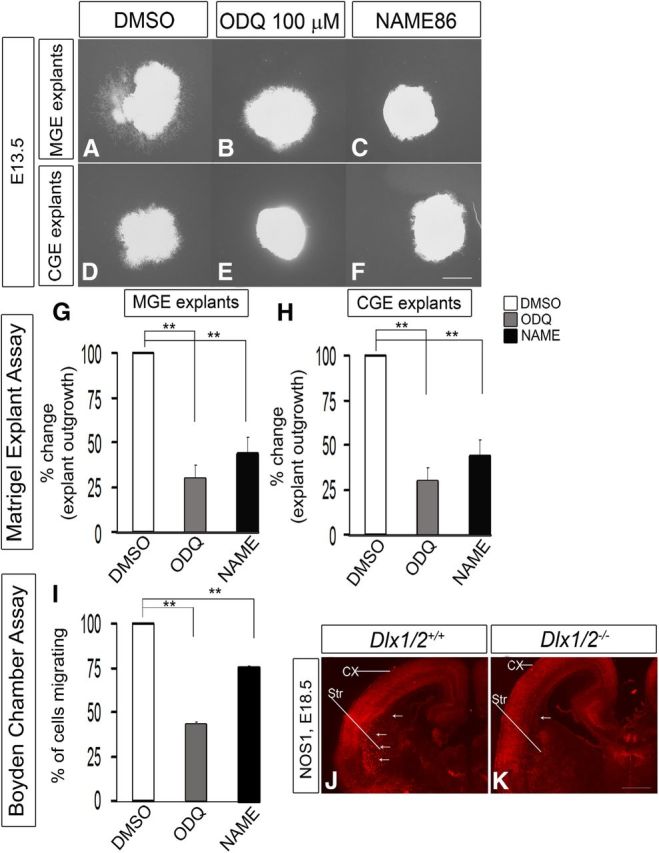
Inhibition of NOS activity with NAME86 blocks cell migration from E13.5 explants of the MGE and CGE, assessed using Matrigel explants and Boyden chamber assays. A–F, Matrigel explant cell migration assays of E13.5 MGE and CGE comparing DMSO (A, D), 100 μm ODQ (B, E), and 100 μm NAME86 (C, F). G, H, Histograms reporting the percentage change in MGE (G) and CGE (H) explant outgrowth as a function of ODQ and NAME86 using one-way ANOVA followed by Bonferroni post test. G, DMSO versus ODQ, p = 1.54E-06; DMSO versus NAME, p = 1.99E-06. H, DMSO versus ODQ, p = 8.33E-04; DMSO versus NAME, p = 2.84E-03. Scale bars: A–F, 500 μm. I, Boyden chamber assay showing that both ODQ (100 μm) and NAME86 (100 μm) inhibit migration. Data are the mean ± SEM. *p ≤ 0.05 (one-way ANOVA followed by Bonferroni post test). **p ≤ 0.01 (one-way ANOVA followed by Bonferroni post test). DMSO versus ODQ, p = 1.17E-07; DMSO versus NAME, p = 1.39E-05. J, K, Immunofluorescence analysis of NOS1 expression in the telencephalon of WT (J) and Dlx1/2−/− (K) mice at E18.5. Arrows indicate the axons going to striatum. CX, Cortex; Str, striatum.
NO could be supplied from several sources (Fig. 2I–T), including NOS1+ MGE cells and cortical plate cells and axons (Fig. 2K). Indeed, NOS1+ axons are detected extending from the cortical plate into the LGE/striatum (Fig. 9H); NO production from these axons could regulate interneuron migration. The cortical plate continued to express NOS1 RNA and protein (Figs. 2I′–L′ and 10J,K) in Dlx1/2−/− mutants, as expected, because neither Dlx1 nor Dlx2 is expressed in these cells. However, we found that the NOS1+ corticofugal axons were greatly reduced in the striatum of the Dlx1/2−/− mutant (Fig. 10J,K), consistent with our paper showing that corticofugal fibers have a pathfinding defect in Dlx1/2−/− mutants secondary to defects in the LGE/striatum (Garel et al., 2002).
Next, we assessed the effect of a loss of function NOS1 mutation on interneuron development (Packer et al., 2003). We did not observe a clear change in interneuron migration based on CB immunohistochemistry at E15.5 and P0 (data not shown). The lack of a detectable phenotype could be the result of NOS2 and NOS3 providing alternative sources of NO.
Inhibition of sGC rapidly alters the shape of MGE neurons via the activation of the Rho signaling pathway
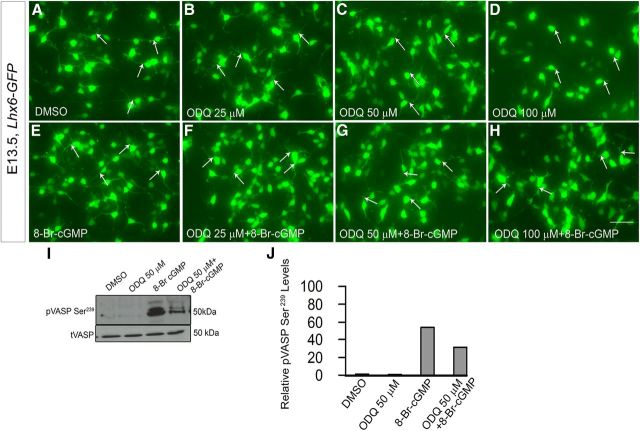
To understand the mechanisms by which ODQ inhibition of sGC impedes neuronal migration, we studied the shape of β-III-tubulin+ (Tuj1) MGE-derived neurons 30 min after ODQ treatment. ODQ induced a clear dose-dependent attenuation of neurite length (Fig. 11A–E), similar to what we observed in cortical slice culture (Fig. 5J–S), and dissociated MGE culture of Lhx6-GFP+ neurons (Fig. 12A–D). Importantly, ODQ attenuation of neurite length was reversible when ODQ was removed from the media (Fig. 11F–I). Furthermore, inhibition of tangential migration from the MGE to the cortex was also partially reversible when ODQ was removed from the media in a slice electroporation experiment (Fig. 11J–S). Thus, inhibition of sGC rapidly reduced neurite length and could underlie the defects in migration.
Figure 12.
Inhibition of sGC rapidly alters the neurite length of MGE neurons that were labeled by GFP expression from an Lhx6-GFP-Bac transgene. A–H, Dose-dependent attenuation of MGE neurite length comparing DMSO (A), 25 μm ODQ (B), 50 μm ODQ (C), and 100 μm ODQ (D) followed by the partial rescue in ODQ-induced neurite length by the addition of 8-Br-cGMP (E–H). Scale bars: A–H, 50 μm. I, Western blot analysis showing increased levels of phospho-VASP Ser239 (a measure of PKG activity) in MGE cells treated with either 8-Br-cGMP alone or in combination with ODQ compared with DMSO or ODQ alone treated cells. Total VASP (tVASP) was used as the loading control. J, Quanitification of the Western blot bands using the histogram tool in Adobe Photoshop (CS3). Results are presented as relative protein levels, expressed in percentage normalized to DMSO-treated cell extracts.
cGMP is known to modulate the cytoskeleton in several ways (see Fig. 14). Increased cGMP levels inactivate the RhoA signaling pathway (Sawada et al., 2001; Begum et al., 2002; Gudi et al., 2002; Sauzeau et al., 2003, 2000). Furthermore, activated RhoA signaling leads to neurite retraction, whereas inhibition of RhoA signaling leads to neurite elongation (Hirose et al., 1998; Togashi et al., 2000). Thus, it is possible that ODQ-mediated neurite retraction could be due to activated RhoA signaling. To test this hypothesis, we performed a series of in vitro pharmacological assays on MGE neuron neurite length (Figs. 13A–I,J and 14).
First, we tested whether ODQ (50 μm) inhibition of neurite length was counteracted by 8-Br-cGMP. Indeed, neurite length was intermediate in cells exposed to 8-Br-cGMP and ODQ (Fig. 13B,D,E,J). Addition of 8-Br-cGMP to DMSO or ODQ-treated MGE cells appeared to increase PKG activity (a measure of cGMP levels), as indicated by increased levels of phospho-VASP Ser239 by Western blot analysis (Fig. 12I); phospho-VASP Ser239 is a recognized indicator of active PKG (Smolenski et al., 1998; Oelze et al., 2000; Lawrence and Pryzwansky, 2001).
PKG inhibits RhoA activity (Sawada et al., 2001; Begum et al., 2002; Gudi et al., 2002; Sauzeau et al., 2003, 2000) (Fig. 14). RhoA mediates its effects through several pathways, including repression of Rac and CDC42 signaling (Sander et al., 1999; Wahl et al., 2000; Sugimoto et al., 2003; Xu et al., 2003; Seasholtz et al., 2004; Rosenfeldt et al., 2006; Burridge and Doughman et al., 2006) and activation of Rho kinase (ROCK) (Ishizaki et al., 1996; Leung et al., 1996, 1995; Matsui et al., 1996). Thus, we tested the effect of pharmacological inhibition and activation of RhoA, activation of Rac/CDC42, and inhibition of ROCK on MGE neurite length.
The ROCK inhibitor alone (Y-27632) (Sahai et al., 1999; Ishizaki et al., 2000) slightly increased neurite length, although this was not statistically significant compared with DMSO. ODQ in combination with Y-27632 resulted in neurite length that was intermediate to cells exposed only to ODQ or Y-27632 (Fig. 13C,D,F,J). Thus, the partial rescue of ODQ-mediated neurite retraction by 8-Br-cGMP provides evidence that cGMP signaling promotes neurite length. Furthermore, the partial rescue of ODQ-mediated neurite retraction by inhibition of the Rho pathway (by the ROCK inhibitor, Y-27632) provides evidence that Rho signaling inhibits neurite length.
To further investigate the role of RhoA signaling on MGE neuron neurite length, we tested the effect of pharmacological activation or inhibition of RhoA. The Rho inhibitor C3 transferase (Nwariaku et al., 2003; Krijnen et al., 2010) increased neurite length, whereas the Rho activator calpeptin (Castellone et al., 2011; Xiang et al., 2011) reduced neurite length (Fig. 13G,H,J). Thus, as predicted by the effect of ROCK inhibition, RhoA activation repressed neurite extension of immature MGE neurons consistent with the model in Figure 14.
As RhoA can repress Rac activity (Burridge and Doughman et al., 2006), we explored whether the effects on MGE neuronal morphology, which occurred in response to changes in RhoA activity, were acting through Rac. Thus, we tested the effect of activating Rac/CDC42 using EGF (Kurokawa et al., 2004). However, EGF treatment did not have a discernible effect on neurite length (Fig. 13I,J). Thus, whereas activation of RhoA shortened neurites, activation of Rac did not affect MGE neurite length (at least through EGF). Therefore, we have evidence that cGMP can act through PKG repression of RhoA signaling to increase neurite length of immature MGE neurons.
To test this model, we expressed various forms of RhoA in the slice migration assay. Consistent with our hypothesis, a dominant active RhoA (DA RhoA) inhibited tangential migration (Fig. 13N,N′,O), whereas the dominant-negative RhoA (DN RhoA) and the ROCK inhibitor (Y-27632) did not inhibit MGE tangential migration (Fig. 13L,L′,M,M′,O), compared with DMSO-treated slices (Fig. 13K,K′,O). Furthermore, the constitutively active RhoA induced approximately twofold attenuation in the neurite length of MGE immature neurons (Fig. 13R). Similar migration results were obtained with the Boyden chamber assay (approximately threefold inhibition with 50 μm ODQ, approximately sevenfold inhibition with the Rho activator calpeptin, and approximately threefold increase in migration with 10 μm Y-27632 (Fig. 13T). To begin to understand how cGMP modulates MGE neuron migration, we investigated whether cGMP's known effects on the cytoskeleton also affected immature MGE neurons. In smooth muscle cells, increases in cGMP levels increase the activity of MLCP. MLCP dephosphorylates, and thereby reduces, the activity of the regulatory MLC, which results in reduced myosin activity and smooth muscle relaxation (Gong et al., 1996; Otto et al., 1996; Fujihara et al., 1997; Uehata et al., 1997; Seko et al., 2003; Hartshorne et al., 2004; Nakamura et al., 2007; Somlyo, 2007). Thus, cGMP-dependent phosphorylation of MLCP reduces myosin activity and leads to smooth muscle relaxation.
To explore whether immature MGE neurons respond similarly to changes in cGMP levels, we studied the phosphorylation state of MLC in response to ODQ. We observed increased MLC phosphorylation (p-MLC Ser19) after ODQ treatment using immunofluorescence and Western blot analysis (Fig. 13U′,X,Y). ODQ increased the amount of p-MLC at the distal end of large neurites (Fig. 13U′ compared with Fig. 13U), in contrast to cells treated with 8-Br-cGMP (Fig. 13V) or Y-27632 (Fig. 13W). Given that ROCK can repress the activity of MLC phosphatase (Wang et al., 2011), we suggest that ODQ-mediated reduced cGMP is increasing p-MLC through activating the RhoA signaling pathway, as described above (Fig. 14, summary diagram).
Discussion
Toward identifying genes that are candidates for regulating MGE neuronal differentiation and migration, we have investigated gene expression changes in the Dlx1/2−/− and Lhx6−/− mouse mutants (Zhao et al., 2008; Long et al., 2009a,b; Flandin et al., 2011; McKinsey et al., 2013). Here we have focused on Gucy1A3, whose expression in the SVZ of the rostrodorsal MGE is greatly reduced in both mutants (Figs. 1 and 2). Gucy1A3 encodes a sGC whose activity is induced by NO to generate cGMP (Denninger and Marletta, 1999; Lincoln et al., 2001; Ghalayini, 2004; Evgenov et al., 2006; Stasch et al., 2011).
Gucy1A3 is expressed at multiple stages of interneuron development, including the SVZ of the MGE at the outset of tangential migration (Fig. 1A–H′) and during their migration in the cortex based on P0 gene expression array data (Stanco and Rubenstein, unpublished observations). Here we show that 8-Br-cGMP (a cGMP analog) promotes MGE neuronal migration and that inhibition of Gucy1A3 (pharmacologically and genetically) reduces migration (Figs. 3A,B,E, 4C–C″, 5A–H′,I,P,Q,U′,V′, 6A–K, and 8A–C′,D; Movies 1 and 2). ODQ potently and rapidly causes neurite retraction of immature MGE-derived neurons in MGE slices and in dissociated cultures (Figs. 5J–O,R,S,U,V, 11A–I, 12A–D, and 13A,D).
As with any pharamacological agent, one needs to be circumspect about its specificity; however, we are unaware of known off-target effects of ODQ at the concentrations we are using. Furthermore, the ODQ-induced phenotypes are remarkably similar to those observed with pharmacological inhibition of components of the cGMP signaling pathway that lie either upstream (NO generation) or downstream (PKG, Rho, ROCK) to Gucy1A3 (Figs. 7A–C, 9A–F′,G, 10A–I, and 13A–J,P–S). Therefore, the results of this study are internally consistent with the conclusion that NO-mediated activation of cGMP synthesis by sGC promotes neurite extension and cell migration.
Genetic analysis also supports our model, as the Gucy1A3−/− mutant has a reduction of CB+ interneurons in its E15.5 cortex (Fig. 8A–D). This phenotype is not as penetrant as the effects of ODQ on tangential migration from the MGE and CGE (Fig. 5A–I). However, as is common in mammalian genetic studies, genetic redundancy could compensate for the functional loss of one member of the gene family. Indeed, RNA arrays detected Gucy1B2, Gucy1B3, and Gucy1A3 expression in the E12.5 and E15.5 MGE, as well as in cell-sorter-purified P0 cortical interneurons (Cobos et al., 2007; Stanco et al., unpublished observations). Therefore, it is likely that the mild phenotype of the Gucy1A3−/− mutant is due to genetic compensation.
NO activates cGMP production by sGCs. Pharmacological inhibition of NO production reduced migration in slice and explant cultures, as well as the Boyden chamber assay (Figs. 9A–F′,G and Fig. 10A–I). This provides supportive and independent evidence that sGC function is important for MGE migration. Whereas the Nos1−/− mutant mouse did not show a clear defect in MGE interneuron migration (data not shown), Nos2 and Nos3 are also expressed in the developing telencephalon (Fig. 2M–T′). These homologs may generate sufficient NO to support cGMP production by the sGCs.
Signals other than NO may also regulate sGC activity in MGE-derived neurons. For instance, Sema3A can activate sGC (Schmidt et al., 2002; Nishiyama et al., 2003, 2008, 2011; Togashi et al., 2008; Shelly et al., 2011). These studies of Sema3A-mediated increased cGMP levels have focused on axon guidance and axon/dendrite specification, where cGMP regulates the neuron's response through activating cyclic nucleotide-gated calcium channels (Nishiyama et al., 2008, 2011; Togashi et al., 2008). Thus, we assessed whether repressing sGC activity in MGE neurons in vitro with ODQ affected calcium levels using calcium indicator dyes and fluorescence microscopy. However, we did not detect clear changes in calcium-mediate fluctuations after ODQ treatment (data not shown), suggesting that cGMP-mediated effects on MGE neuron morphology and migration may be primarily mediated by the RhoA pathway, as discussed below. Nonetheless, additional studies are needed to investigate whether changes in cGMP concentrations regulate cyclic nucleotide-gated calcium channels in MGE-derived neurons.
NO/cGMP signaling and the cytoskeleton
Thirty minutes of ODQ treatment of MGE cells in dissociated culture, or 1 h in slice culture, resulted in rapid and robust shortening of neurite length (Figs. 5J–O,R,S, 11A–E, 12A–D, and 13A,D,J). This effect was partially reversed using 8-Br-cGMP (Figs. 12E–H and 13B,E,J), providing evidence that neurite retraction was caused by inhibiting cGMP production (and thereby reducing active PKG). Furthermore, ODQ's effect was also partially reversed by the ROCK inhibitor Y-27632 (Fig. 13C,F,J), suggesting that neurite retraction was caused by activation of RhoA/ROCK signaling. This hypothesis was supported by results obtained by expression of dominant active RhoA that reduced neurite length and tangential migration of MGE immature neurons (Fig. 13P–S). We summarize our postulation of the pathway in a schema (Fig. 14). Most information on the mechanisms of how NO/cGMP signaling controls the cytoskeleton and cellular movement comes from work in non-neural cells, particularly smooth muscle (for review, see Pfitzer, 2001). ROCK increases the phosphorylation of the regulatory subunit of myosin (pMLC), through inhibiting MLCP (for review, see Pfitzer, 2001). Increased levels of pMLC increase myosin II activity. For instance, RhoA/ROCK signaling in cerebellar granule neurons activated myosin II activity, which in turn inhibited neurite outgrowth (Kubo et al., 2008).
These results are in concordance with our findings in immature MGE neurons. We found that inhibition of cGMP signaling with ODQ reduced neurite length (Figs. 5, 11, 12, and 13). This effect was partially reversed with the ROCK inhibitor (Y-27632) (Fig. 13). Furthermore, whereas 8-Br-cGMP decreased the level of pMLC, ODQ increased pMLC levels (Fig. 13V,U′).
Thus, we propose that sGC generation of cGMP promotes neurite extension and migration of subpallial-derived interneurons by blocking RhoA/ROCK activity (Figs. 12, 13, and 14). This model, summarized in Figure 14, has several ramifications, as interneuron migration is regulated by repulsive cues that cause neurite retraction. For instance, there is evidence that semaphorin3A/3F expression in the striatum and cerebral cortex repel migrating interneurons (Marín et al., 2001; Tamamaki et al., 2003). Thus, we predict that cGMP could counteract semaphorin-mediated repulsion. Another prediction is that NO-producing tissues would promote interneuron migration. NOS1 is expressed in the cortical plate (Fig. 1S–V); thus cortical plate neurons and their processes (including axons projecting through the basal ganglia; Fig. 9H) could be a source of NO that would promote interneuron neurite extension and migration.
Our analysis of sGC function during the development of the subpallium, and its derivatives such as cortical interneurons, adds new insights into the molecular mechanisms underlying the cellular phenotypes of cells lacking Dlx1/2 or Lhx6. We suggest that sGC regulation of cGMP levels is integrated with the other signaling systems that control the differentiation and migration of cortical interneurons, including those downstream of CXCR4, CXCR7, ErbB4, Neuropilin, and Pak3 (Marín et al., 2001; Tamamaki et al., 2003; Flames et al., 2004; Cobos et al., 2007; Fogarty et al., 2007; Nóbrega-Pereira et al., 2008; Sánchez-Alcañiz et al., 2011; Wang et al., 2011). It is clear that no single signaling system regulates each step in the maturation and migration of subpallial cells, explaining why the phenotypes of Dlx1/2 or Lhx6 mutants are more severe and, in some cases, qualitatively distinct from the effects of mutations, or pharmacological inhibition of sGCs or single components of the other signaling systems.
Footnotes
This work was supported by the American Heart Association Research Grant 10SDG2610313 to E.S.B., and Nina Ireland, Larry L. Hillblom Foundation, March of Dimes, Weston Havens Foundation, National Institute of Mental Health R37 MH049428, and R01 MH081880 to J.L.R.R. We thank Roger Cooke, Michael Marletta, and Orion Weiner for important discussions, Daniel Vogt for help with the statistics, and Sheel Dandekar with the calcium imaging studies.
The authors declare no competing financial interests.
References
- Anderson SA, Eisenstat DD, Shi L, Rubenstein JL. Interneuron migration from basal forebrain: dependence on Dlx genes. Science. 1997a;278:474–476. doi: 10.1126/science.278.5337.474. [DOI] [PubMed] [Google Scholar]
- Anderson SA, Qiu M, Bulfone A, Eisenstat DD, Meneses J, Pedersen R, Rubenstein JL. Mutations of the homeobox genes Dlx-1 and Dlx-2 disrupt the striatal subventricular zone and differentiation of late-born striatal cells. Neuron. 1997b;19:27–37. doi: 10.1016/S0896-6273(00)80345-1. [DOI] [PubMed] [Google Scholar]
- Begum N, Sandu OA, Ito M, Lohmann SM, Smolenski A. Active Rho kinase (ROK-alpha) associates with insulin receptor substrate-1 and inhibits insulin signaling in vascular smooth muscle cells. J Biol Chem. 2002;277:6214–6222. doi: 10.1074/jbc.M110508200. [DOI] [PubMed] [Google Scholar]
- Boulton CL, Southam J, Garthwaite E. Nitric oxide-dependent long-term potentiation is blocked by a specific inhibitor of soluble guanylyl cyclase. Neuroscience. 1995;69:699–703. doi: 10.1016/0306-4522(95)00349-N. [DOI] [PubMed] [Google Scholar]
- Burridge K, Doughman R. Front and back by Rho and Rac. Nat Cell Biol. 2006;8:781–782. doi: 10.1038/ncb0806-781. [DOI] [PubMed] [Google Scholar]
- Buys ES, Sips P, Vermeersch P, Raher MJ, Rogge E, Ichinose F, Dewerchin M, Bloch KD, Janssens S, Brouckaert P. Gender-specific hypertension and responsiveness to nitric oxide in sGCalpha1 knockout mice. Cardiovasc Res. 2008;79:179–186. doi: 10.1093/cvr/cvn068. [DOI] [PubMed] [Google Scholar]
- Castellone RD, Leffler NR, Dong L, Yang LV. Inhibition of tumor cell migration and metastasis by the proton-sensing GPR4 receptor. Cancer Lett. 2011;312:197–208. doi: 10.1016/j.canlet.2011.08.013. [DOI] [PubMed] [Google Scholar]
- Cechova S, Pajewski TN. The soluble guanylyl cyclase inhibitor ODQ, 1H-[1,2,4]oxadiazolo[4,3-a]quinoxalin-1-one, dose-dependently reduces the threshold for isoflurane anesthesia in rats. Anesth Analg. 2004;99:752–757. doi: 10.1213/01.ANE.0000132695.77191.F3. [DOI] [PubMed] [Google Scholar]
- Choi GB, Dong HW, Murphy AJ, Valenzuela DM, Yancopoulos GD, Swanson LW, Anderson DJ. Lhx6 delineates a pathway mediating innate reproductive behaviors from the amygdala to the hypothalamus. Neuron. 2005;46:647–660. doi: 10.1016/j.neuron.2005.04.011. [DOI] [PubMed] [Google Scholar]
- Cobos I, Calcagnotto ME, Vilaythong AJ, Thwin MT, Noebels JL, Baraban SC, Rubenstein JL. Mice lacking Dlx1 show subtype-specific loss of interneurons, reduced inhibition and epilepsy. Nat Neurosci. 2005;8:1059–1068. doi: 10.1038/nn1499. [DOI] [PubMed] [Google Scholar]
- Cobos I, Borello U, Rubenstein JL. Dlx transcription factors promote migration through repression of axon and dendrite growth. Neuron. 2007;54:873–888. doi: 10.1016/j.neuron.2007.05.024. [DOI] [PMC free article] [PubMed] [Google Scholar]
- Denninger JW, Marletta MA. Guanylate cyclase and the NO/cGMP signaling pathway. Biochim Biophys Acta. 1999;1411:334–350. doi: 10.1016/S0005-2728(99)00024-9. [DOI] [PubMed] [Google Scholar]
- Dora KA, Garland CJ, Kwan HY, Yao X. Endothelial cell protein kinase G inhibits release of EDHF through a PKG-sensitive cation channel. Am J Physiol Heart Circ Physiol. 2001;280:H1272–H1277. doi: 10.1152/ajpheart.2001.280.3.H1272. [DOI] [PubMed] [Google Scholar]
- Evgenov OV, Pacher P, Schmidt PM, Haskó G, Schmidt HH, Stasch JP. NO-independent stimulators and activators of soluble guanylate cyclase: discovery and therapeutic potential. Nat Rev Drug Discov. 2006;5:755–768. doi: 10.1038/nrd2038. [DOI] [PMC free article] [PubMed] [Google Scholar]
- Flames N, Long JE, Garratt AN, Fischer TM, Gassmann M, Birchmeier C, Lai C, Rubenstein JL, Marín O. Short- and long-range attraction of cortical GABAergic interneurons by Neuregulin1. Neuron. 2004;44:251–261. doi: 10.1016/j.neuron.2004.09.028. [DOI] [PubMed] [Google Scholar]
- Flandin P, Kimura S, Rubenstein JL. The progenitor zone of the ventral medial ganglionic eminence requires nkx2–1 to generate most of the globus pallidus but few neocortical interneurons. J Neurosci. 2010;30:2812–2823. doi: 10.1523/JNEUROSCI.4228-09.2010. [DOI] [PMC free article] [PubMed] [Google Scholar]
- Flandin P, Zhao Y, Vogt D, Jeong J, Long J, Potter G, Westphal H, Rubenstein JL. Lhx6 and Lhx8 coordinately induce neuronal expression of Shh that controls the generation of interneuron progenitors. Neuron. 2011;70:939–950. doi: 10.1016/j.neuron.2011.04.020. [DOI] [PMC free article] [PubMed] [Google Scholar]
- Fogarty M, Grist M, Gelman D, Marín O, Pachnis V, Kessaris N. Spatial genetic patterning of the embryonic neuroepithelium generates GABAergic interneuron diversity in the adult cortex. J Neurosci. 2007;27:10935–10946. doi: 10.1523/JNEUROSCI.1629-07.2007. [DOI] [PMC free article] [PubMed] [Google Scholar]
- Francis SH, Busch JL, Corbin JD, Sibley D. cGMP-dependent protein kinases and cGMP phosphodiesterases in nitric oxide and cGMP action. Pharmacol Rev. 2010;62:525–563. doi: 10.1124/pr.110.002907. [DOI] [PMC free article] [PubMed] [Google Scholar]
- Friebe A, Koesling D. Regulation of nitric oxide-sensitive guanylyl cyclase. Circ. Res. 2003;93:96–105. doi: 10.1161/01.RES.0000082524.34487.31. [DOI] [PubMed] [Google Scholar]
- Fujihara H, Walker LA, Gong MC, Lemichez E, Boquet P, Somlyo AV, Somlyo AP. Inhibition of RhoA translocation and calcium sensitization by in vivo ADP-ribosylation with the chimeric toxin DC3B. Mol Biol Cell. 1997;8:2437–2447. doi: 10.1091/mbc.8.12.2437. [DOI] [PMC free article] [PubMed] [Google Scholar]
- Garel S, Yun K, Grosschedl R, Rubenstein JL. The early topography of thalamocortical projections is shifted in Ebf1 and Dlx1/2 mutant mice. Development. 2002;129:5621–5634. doi: 10.1242/dev.00166. [DOI] [PubMed] [Google Scholar]
- Garthwaite J. Concepts of neural nitric oxide-mediated transmission. Eur J Neurosci. 2008;27:2783–2802. doi: 10.1111/j.1460-9568.2008.06285.x. [DOI] [PMC free article] [PubMed] [Google Scholar]
- Garthwaite J, Southam E, Boulton CL, Nielsen EB, Schmidt K, Mayer B. Potent and selective inhibition of nitric oxide-sensitive guanylyl cyclase by 1H-[1,2,4]oxadiazolo[4,3-a]quinoxalin-1-one. Mol Pharmacol. 1995;48:184–188. [PubMed] [Google Scholar]
- Georgiadou G, Pitsikas N. Repeated administration of the nitric oxide synthase inhibitor l-NAME differentially affects rats' recognition memory. Behav Brain Res. 2011;224:140–144. doi: 10.1016/j.bbr.2011.05.037. [DOI] [PubMed] [Google Scholar]
- Ghalayini IF. Nitric oxide–cyclic GMP pathway with some emphasis on cavernosal contractility. Int J Impot Res. 2004;16:459–469. doi: 10.1038/sj.ijir.3901256. [DOI] [PubMed] [Google Scholar]
- Gong MC, Iizuka K, Nixon G, Browne JP, Hall A, Eccleston JF, Sugai M, Kobayashi S, Somlyo AV, Somlyo AP. Role of guanine nucleotide-binding proteins, ras-family or trimeric proteins or both, in Ca2+ sensitization of smooth muscle. Proc Natl Acad Sci U S A. 1996;93:1340–1345. doi: 10.1073/pnas.93.3.1340. [DOI] [PMC free article] [PubMed] [Google Scholar]
- Gudi T, Chen JC, Casteel DE, Seasholtz TM, Boss GR, Pilz RB. cGMP-dependent protein kinase inhibits serum-response element-dependent transcription by inhibiting ρ activation and functions. J Biol Chem. 2002;277:37382–37393. doi: 10.1074/jbc.M204491200. [DOI] [PubMed] [Google Scholar]
- Hartshorne DJ, Ito M, Erdödi R. Role of protein phosphatase type 1 in contractile functions: myosin phosphatase. J Biol Chem. 2004;279:37211–37214. doi: 10.1074/jbc.R400018200. [DOI] [PubMed] [Google Scholar]
- Hirose M, Ishizaki T, Watanabe N, Uehata M, Kranenburg O, Moolenaar WH, Matsumura F, Maekawa M, Bito H, Narumiya S. Molecular dissection of the Rho-associated protein kinase (p160ROCK)-regulated neurite remodeling in neuroblastoma N1E-115 cells. J Cell Biol. 1998;141:1625–1636. doi: 10.1083/jcb.141.7.1625. [DOI] [PMC free article] [PubMed] [Google Scholar]
- Ishizaki T, Maekawa M, Fujisawa K, Okawa K, Iwamatsu A, Fujita A, Watanabe N, Saito Y, Kakizuka A, Morii N, Narumiya S. The small GTP-binding protein Rho binds to and activates a 160 kDa Ser/Thr protein kinase homologous to myotonic dystrophy kinase. EMBO J. 1996;15:1885–1893. [PMC free article] [PubMed] [Google Scholar]
- Ishizaki T, Uehata M, Tamechika I, Keel J, Nonomura K, Maekawa M, Narumiya S. Pharmacological properties of Y-27632, a specific inhibitor of ρ-associated kinases. Mol Pharmacol. 2000;57:976–983. [PubMed] [Google Scholar]
- Jeong J, Mao J, Tenzen T, Kottmann AH, McMahon AP. Hedgehog signaling in the neural crest cells regulates the patterning and growth of facial primordia. Genes Dev. 2004;18:937–951. doi: 10.1101/gad.1190304. [DOI] [PMC free article] [PubMed] [Google Scholar]
- Knowles RG, Moncada S. Nitric oxide synthases in mammals. Biochem J. 1994;298:249–258. doi: 10.1042/bj2980249. [DOI] [PMC free article] [PubMed] [Google Scholar]
- Krijnen PA, Sipkens JA, Molling JW, Rauwerda JA, Stehouwer CD, Muller A, Paulus WJ, van Nieuw Amerongen GP, Hack CE, Verhoeven AJ, van Hinsbergh VW, Niessen HW. Inhibition of Rho-ROCK signaling induces apoptotic and non-apoptotic PS exposure in cardiomyocytes via inhibition of flippase. J Mol Cell Cardiol. 2010;49:781–790. doi: 10.1016/j.yjmcc.2010.07.017. [DOI] [PubMed] [Google Scholar]
- Kubo T, Endo M, Hata K, Taniguchi J, Kitajo K, Tomura S, Yamaguchi A, Mueller BK, Yamashita T. Myosin IIA is required for neurite outgrowth inhibition produced by repulsive guidance molecule. J Neurochem. 2008;105:113–126. doi: 10.1111/j.1471-4159.2007.05125.x. [DOI] [PubMed] [Google Scholar]
- Kurokawa K, Itoh RE, Yoshizaki H, Nakamura YO, Matsuda M. Coactivation of Rac1 and Cdc42 at lamellipodia and membrane ruffles induced by epidermal growth factor. Mol Biol Cell. 2004;15:1003–1010. doi: 10.1091/mbc.E03-08-0609. [DOI] [PMC free article] [PubMed] [Google Scholar]
- Kwan HY, Huang Y, Yao X. Regulation of canonical transient receptor potential isoform 3 (TRPC3) channel by protein kinase G. Proc Natl Acad Sci U S A. 2004;101:2625–2630. doi: 10.1073/pnas.0304471101. [DOI] [PMC free article] [PubMed] [Google Scholar]
- Lawrence DW, Pryzwansky KB. The vasodilator-stimulated phosphoprotein is regulated by cyclic GMP-dependent protein kinase during neutrophil spreading. J Immunol. 2001;166:5550–5556. doi: 10.4049/jimmunol.166.9.5550. [DOI] [PubMed] [Google Scholar]
- Le TN, Du G, Fonseca M, Zhou QP, Wigle JT, Eisenstat DD. Dlx homeobox genes promote cortical interneuron migration from the basal forebrain by direct repression of the semaphorin receptor neuropilin-2. J Biol Chem. 2007;282:19071–19081. doi: 10.1074/jbc.M607486200. [DOI] [PubMed] [Google Scholar]
- Leung T, Manser E, Tan L, Lim L. A novel serine/threonine kinase binding the Ras-related RhoA GTPase which translocates the kinase to peripheral membranes. J Biol Chem. 1995;270:29051–29054. doi: 10.1074/jbc.270.49.29051. [DOI] [PubMed] [Google Scholar]
- Leung T, Chen XQ, Manser E, Lim L. The p160 RhoA-binding kinase ROK α is a member of a kinase family and is involved in the reorganization of the cytoskeleton. Mol Cell Biol. 1996;16:5313–5327. doi: 10.1128/mcb.16.10.5313. [DOI] [PMC free article] [PubMed] [Google Scholar]
- Lin DT, Fretier P, Jiang C, Vincent SR. Nitric oxide signaling via cGMP-stimulated phosphodiesterase in striatal neurons. Synapse. 2010;64:460–466. doi: 10.1002/syn.20750. [DOI] [PubMed] [Google Scholar]
- Lincoln TM, Dey N, Sellak H. Invited review: cGMP-dependent protein kinase signaling mechanisms in smooth muscle: from the regulation of tone to gene expression. J Appl Physiol. 2001;91:1421–1430. doi: 10.1152/jappl.2001.91.3.1421. [DOI] [PubMed] [Google Scholar]
- Long JE, Garel S, Alvarez-Dolado M, Yoshikawa K, Osumi N, Alvarez-Buylla A, Rubenstein JL. Dlx-dependent and independent regulation of olfactory bulb interneuron differentiation. J Neurosci. 2007;27:3230–3243. doi: 10.1523/JNEUROSCI.5265-06.2007. [DOI] [PMC free article] [PubMed] [Google Scholar]
- Long JE, Cobos I, Potter GB, Rubenstein JL. Dlx1&2 and Mash1 transcription factors control MGE and CGE patterning and differentiation through parallel and overlapping pathways. Cereb Cortex. 2009a;19:i96–i106. doi: 10.1093/cercor/bhp045. [DOI] [PMC free article] [PubMed] [Google Scholar]
- Long JE, Swan C, Liang WS, Cobos I, Potter GB, Rubenstein JL. Dlx1&2 and Mash1 transcription factors control striatal patterning and differentiation through parallel and overlapping pathways. J Comp Neurol. 2009b;512:556–572. doi: 10.1002/cne.21854. [DOI] [PMC free article] [PubMed] [Google Scholar]
- Marín O, Yaron A, Bagri A, Tessier-Lavigne M, Rubenstein JL. Sorting of striatal and cortical interneurons regulated by semaphoring–neuropilin interactions. Science. 2001;293:872–875. doi: 10.1126/science.1061891. [DOI] [PubMed] [Google Scholar]
- Matsui T, Amano M, Yamamoto T, Chihara K, Nakafuku M, Ito M, Nakano T, Okawa K, Iwamatsu A, Kaibuchi K. Rho-associated kinase, a novel serine/threonine kinase, as a putative target for small GTP binding protein Rho. EMBO J. 1996;15:2208–2216. [PMC free article] [PubMed] [Google Scholar]
- McKinsey GL, Lindtner S, Trzcinski B, Visel A, Pennacchio LA, Huylebroeck D, Higashi Y, Rubenstein JL. Dlx1&2-dependent expression of Zfhx1b (Sip1, Zeb2) regulates the fate switch between cortical and striatal interneurons. Neuron. 2013;77:83–98. doi: 10.1016/j.neuron.2012.11.035. [DOI] [PMC free article] [PubMed] [Google Scholar]
- Mohammadi MT, Shid-Moosavi SM, Dehghani GA. Contribution of nitric oxide synthase (NOS) in blood–brain barrier disruption during acute focal cerebral ischemia in normal rat. Pathophysiology. 2012;19:13–20. doi: 10.1016/j.pathophys.2011.07.003. [DOI] [PubMed] [Google Scholar]
- Nakamura K, Koga Y, Sakai H, Homma K, Ikebe M. cGMP-dependent relaxation of smooth muscle is coupled with the change in the phosphorylation of myosin phosphatase. Circ Res. 2007;101:712–722. doi: 10.1161/CIRCRESAHA.107.153981. [DOI] [PubMed] [Google Scholar]
- Nishiyama M, Hoshino A, Tsai L, Henley JR, Goshima Y, Tessier-Lavigne M, Poo MM, Hong K. Cyclic AMP/GMP-dependent modulation of Ca2+ channels sets the polarity of nerve growth-cone turning. Nature. 2003;423:990–995. doi: 10.1038/nature01751. [DOI] [PubMed] [Google Scholar]
- Nishiyama M, von Schimmelmann MJ, Togashi K, Findley WM, Hong K. Membrane potential shifts caused by diffusible guidance signals direct growth-cone turning. Nat Neurosci. 2008;11:762–771. doi: 10.1038/nn.2130. [DOI] [PubMed] [Google Scholar]
- Nishiyama M, Togashi K, von Schimmelmann MJ, Lim CS, Maeda S, Yamashita N, Goshima Y, Ishii S, Hong K. Semaphorin 3A induces CaV2.3 channel-dependent conversion of axons to dendrites. Nat Cell Biol. 2011;13:676–685. doi: 10.1038/ncb2255. [DOI] [PMC free article] [PubMed] [Google Scholar]
- Nóbrega-Pereira S, Kessaris N, Du T, Kimura S, Anderson SA, Marín O. Postmitotic Nkx2–1 controls the migration of telencephalic interneurons by direct repression of guidance receptors. Neuron. 2008;59:733–745. doi: 10.1016/j.neuron.2008.07.024. [DOI] [PMC free article] [PubMed] [Google Scholar]
- Nugent FS, Niehaus JL, Kauer JA. PKG and PKA signaling in LTP at GABAergic synapses. Neuropsychopharmacology. 2009;34:1829–1842. doi: 10.1038/npp.2009.5. [DOI] [PMC free article] [PubMed] [Google Scholar]
- Nwariaku FE, Rothenbach P, Liu Z, Zhu X, Turnage RH, Terada LS. Rho inhibition decreases TNF-induced endothelial MAPK activation and monolayer permeability. J Appl Physiol. 2003;95:1889–1895. doi: 10.1152/japplphysiol.00225.2003. [DOI] [PubMed] [Google Scholar]
- Oelze M, Mollnau H, Hoffmann N, Warnholtz A, Bodenschatz M, Smolenski A, Walter U, Skatchkov M, Meinertz T, Münzel T. Vasodilator-stimulated phosphoprotein serine 239 phosphorylation as a sensitive monitor of defective nitric oxide/cGMP signaling and endothelial dysfunction. Circ Res. 2000;87:999–1005. doi: 10.1161/01.RES.87.11.999. [DOI] [PubMed] [Google Scholar]
- Otto B, Steusloff A, Just I, Aktories K, Pfitzer G. Role of Rho proteins in carbachol-induced contractions in intact and permeabilized guinea-pig intestinal smooth muscle. J Physiol. 1996;496:317–329. doi: 10.1113/jphysiol.1996.sp021687. [DOI] [PMC free article] [PubMed] [Google Scholar]
- Packer MA, Stasiv Y, Benraiss A, Chmielnicki E, Grinberg A, Westphal H, Goldman SA, Enikolopov G. Nitric oxide negatively regulates mammalian adult neurogenesis. Proc Natl Acad Sci U S A. 2003;100:9566–9571. doi: 10.1073/pnas.1633579100. [DOI] [PMC free article] [PubMed] [Google Scholar]
- Pfitzer G. Signal transduction in smooth muscle: regulation of myosin phosphorylation in smooth muscle. J Appl Physiol. 2001;91:497–503. doi: 10.1152/jappl.2001.91.1.497. [DOI] [PubMed] [Google Scholar]
- Polleux F, Giger RJ, Ginty DD, Kolodkin AL, Ghosh A. Patterning of cortical efferent projections by semaphorin-neuropilin interactions. Science. 1998;282:1904–1906. doi: 10.1126/science.282.5395.1904. [DOI] [PubMed] [Google Scholar]
- Polleux F, Morrow T, Ghosh A. Semaphorin 3A is a chemoattractant for cortical apical dendrites. Nature. 2000;404:567–573. doi: 10.1038/35007001. [DOI] [PubMed] [Google Scholar]
- Regli L, Held MC, Anderson RE, Meyer FB. Nitric oxide synthase inhibition by l-NAME prevents brain acidosis during focal cerebral ischemia in rabbits. J Cereb Blood Flow Metab. 1996;16:988–995. doi: 10.1097/00004647-199609000-00024. [DOI] [PubMed] [Google Scholar]
- Rosenfeldt H, Castellone MD, Randazzo PA, Gutkind JS. Rac inhibits thrombin-induced Rho activation: evidence of a Pak-dependent GTPase crosstalk. J Mol Signal. 2006;1:8. doi: 10.1186/1750-2187-1-8. [DOI] [PMC free article] [PubMed] [Google Scholar]
- Sahai E, Ishizaki T, Narumiya S, Treisman R. Transformation mediated by RhoA requires activity of ROCK kinases. Curr Biol. 1999;9:136–145. doi: 10.1016/S0960-9822(99)80067-0. [DOI] [PubMed] [Google Scholar]
- Sánchez-Alcañiz JA, Haege S, Mueller W, Pla R, Mackay F, Schulz S, López-Bendito G, Stumm R, Marín O. Cxcr7 controls neuronal migration by regulating chemokine responsiveness. Neuron. 2011;69:77–90. doi: 10.1016/j.neuron.2010.12.006. [DOI] [PubMed] [Google Scholar]
- Sander EE, ten Klooster JP, van Delft S, van der Kammen RA, Collard JG. Rac downregulates Rho activity: reciprocal balance between both GTPases determines cellular morphology and migratory behavior. J Cell Biol. 1999;147:1009–1022. doi: 10.1083/jcb.147.5.1009. [DOI] [PMC free article] [PubMed] [Google Scholar]
- Sato MJ, Kuwayama H, van Egmond WN, Takayama AL, Takagi H, van Haastert PJ, Yanagida T, Ueda M. Switching direction in electric-signal-induced cell migration by cyclic guanosine monophosphate and phosphatidylinositol signaling. Proc Natl Acad Sci U S A. 2009;106:6667–6672. doi: 10.1073/pnas.0809974106. [DOI] [PMC free article] [PubMed] [Google Scholar]
- Sauzeau V, Jeune H, Cario-Toumaniantz C, Smolenski A, Lohmann SM, Bertoglio J, Chardin P, Pacaud P, Loirand G. Cyclic GMP-dependent protein kinase signaling pathway inhibits RhoA-induced Ca2+ sensitization of contraction in vascular smooth muscle. J Biol Chem. 2000;275:21722–21729. doi: 10.1074/jbc.M000753200. [DOI] [PubMed] [Google Scholar]
- Sauzeau V, Rolli-Derkinderen M, Marionneau C, Loirand G, Pacaud P. RhoA expression is controlled by nitric oxide through cGMP-dependent protein kinase activation. J Biol Chem. 2003;278:9472–9480. doi: 10.1074/jbc.M212776200. [DOI] [PubMed] [Google Scholar]
- Sawada N, Itoh H, Yamashita J, Doi K, Inoue M, Masatsugu K, Fukunaga Y, Sakaguchi S, Sone M, Yamahara K, Yurugi T, Nakao K. cGMP-dependent protein kinase phosphorylates and inactivates RhoA. Biochem Biophys Res Commun. 2001;280:798–805. doi: 10.1006/bbrc.2000.4194. [DOI] [PubMed] [Google Scholar]
- Schmidt H, Werner M, Heppenstall PA, Henning M, Moré MI, Kühbandner S, Lewin GR, Hofmann F, Feil R, Rathjen FG. cGMP-mediated signaling via cGKI is required for the guidance and connectivity of sensory axons. J Cell Biol. 2002;159:489–498. doi: 10.1083/jcb.200207058. [DOI] [PMC free article] [PubMed] [Google Scholar]
- Seasholtz TM, Radeff-Huang J, Sagi SA, Matteo R, Weems JM, Cohen AS, Feramisco JR, Brown JH. Rho-mediated cytoskeletal rearrangement in response to LPA is functionally antagonized by Rac1 and PIP2. J Neurochem. 2004;91:501–512. doi: 10.1111/j.1471-4159.2004.02749.x. [DOI] [PubMed] [Google Scholar]
- Seko T, Ito M, Kureishi Y, Okamoto R, Moriki N, Onishi K, Isaka N, Hartshorne DJ, Nakano T. Activation of RhoA and inhibition of myosin phosphatase as important components in hypertension in vascular smooth muscle. Circ Res. 2003;92:411–418. doi: 10.1161/01.RES.0000059987.90200.44. [DOI] [PubMed] [Google Scholar]
- Shelly M, Cancedda L, Lim BK, Popescu AT, Cheng PL, Gao H, Poo MM. Semaphorin3A regulates neuronal polarization by suppressing axon formation and promoting dendrite growth. Neuron. 2011;71:433–446. doi: 10.1016/j.neuron.2011.06.041. [DOI] [PMC free article] [PubMed] [Google Scholar]
- Smolenski A, Bachmann C, Reinhard K, Hönig-Liedl P, Jarchau T, Hoschuetzky H, Walter U. Analysis and regulation of vasodilator-stimulated phosphoprotein serine 239 phosphorylation in vitro and in intact cells using a phosphospecific monoclonal antibody. J Biol Chem. 1998;273:20029–20035. doi: 10.1074/jbc.273.32.20029. [DOI] [PubMed] [Google Scholar]
- Somlyo AV. Cyclic GMP regulation of myosin phosphatase: a new piece for the puzzle? Circ Res. 2007;101:645–647. doi: 10.1161/CIRCRESAHA.107.161893. [DOI] [PubMed] [Google Scholar]
- Stasch JP, Pacher P, Evgenov OV. Soluble guanylate cyclase as an emerging therapeutic target in cardiopulmonary disease. Circulation. 2011;123:2263–2273. doi: 10.1161/CIRCULATIONAHA.110.981738. [DOI] [PMC free article] [PubMed] [Google Scholar]
- Stothers L, Laher I, Christ GT. A review of the l-arginine-nitric oxide-guanylate cyclase pathway as a mediator of lower urinary tract physiology and symptoms. Can J Urol. 2003;10:1971–1980. [PubMed] [Google Scholar]
- Stühmer T, Anderson SA, Ekker M, Rubenstein JL. Ectopic expression of the Dlx genes induces glutamic acid decarboxylase and Dlx expression. Development. 2002;129:245–252. doi: 10.1242/dev.129.1.245. [DOI] [PubMed] [Google Scholar]
- Sugimoto N, Takuwa N, Okamoto H, Sakurada S, Takuwa Y. Inhibitory and stimulatory regulation of Rac and cell motility by the G12/13-Rho and Gi pathways integrated downstream of a single G protein-coupled sphingosine-1-phosphate receptor isoform. Mol Cell Biol. 2003;23:1534–1545. doi: 10.1128/MCB.23.5.1534-1545.2003. [DOI] [PMC free article] [PubMed] [Google Scholar]
- Tamamaki N, Fujimori K, Nojyo Y, Kaneko T, Takauji R. Evidence that Sema3A and Sema3F regulate the migration of GABAergic neurons in the developing neocortex. J Comp Neurol. 2003;455:238–248. doi: 10.1002/cne.10476. [DOI] [PubMed] [Google Scholar]
- Togashi H, Nagata K, Takagishi M, Saitoh N, Inagaki M. Functions of a ρ-specific guanine nucleotide exchange factor in neurite retraction: possible role of a proline-rich motif of KIAA0380 in localization. J Biol Chem. 2000;275:29570–29578. doi: 10.1074/jbc.M003726200. [DOI] [PubMed] [Google Scholar]
- Togashi K, von Schimmelmann MJ, Nishiyama M, Lim CS, Yoshida N, Yun B, Molday RS, Goshima Y, Hong K. Cyclic GMP-gated CNG channels function in Sema3A-induced growth cone repulsion. Neuron. 2008;58:694–707. doi: 10.1016/j.neuron.2008.03.017. [DOI] [PubMed] [Google Scholar]
- Uehata M, Ishizaki T, Satoh H, Ono T, Kawahara T, Morishita T, Tamakawa H, Yamagami K, Inui J, Maekawa M, Narumiya S. Calcium sensitization of smooth muscle mediated by a Rho-associated protein kinase in hypertension. Nature. 1997;389:990–994. doi: 10.1038/40187. [DOI] [PubMed] [Google Scholar]
- Wahl S, Barth H, Ciossek T, Aktories K, Mueller BK. Ephrin-A5 induces collapse of growth cones by activating Rho and Rho kinase. J Cell Biol. 2000;149:263–270. doi: 10.1083/jcb.149.2.263. [DOI] [PMC free article] [PubMed] [Google Scholar]
- Wall ME, Francis SH, Corbin JD, Grimes K, Robyn RJ, Kotera J, Macdonald BA, Gibson RR, Trewhella J. Mechanisms associated with cGMP binding and activation of cGMP-dependent protein kinase. Proc Natl Acad Sci U S A. 2003;100:2380–2385. doi: 10.1073/pnas.0534892100. [DOI] [PMC free article] [PubMed] [Google Scholar]
- Wang Y, Li G, Stanco A, Long JE, Crawford D, Potter GB, Pleasure SJ, Behrens T, Rubenstein JL. CXCR4 and CXCR7 have distinct functions in regulating interneuron migration. Neuron. 2011;69:61–76. doi: 10.1016/j.neuron.2010.12.005. [DOI] [PMC free article] [PubMed] [Google Scholar]
- Xiang SY, Vanhoutte D, Del Re DP, Purcell NH, Ling H, Banerjee I, Bossuyt J, Lang RA, Zheng Y, Matkovich SJ, Miyamoto S, Molkentin JD, Dorn GW, 2nd, Brown JH. RhoA protects the mouse heart against ischemia/reperfusion injury. J Clin Invest. 2011;121:3269–3276. doi: 10.1172/JCI44371. [DOI] [PMC free article] [PubMed] [Google Scholar]
- Xu J, Wang F, Van Keymeulen A, Herzmark P, Straight A, Kelly K, Takuwa Y, Sugimoto N, Mitchison T, Bourne HR. Divergent signals and cytoskeletal assemblies regulate self-organizing polarity in neutrophils. Cell. 2003;114:201–214. doi: 10.1016/S0092-8674(03)00555-5. [DOI] [PubMed] [Google Scholar]
- Xu Q, Cobos I, De La Cruz E, Rubenstein JL, Anderson SA. Origins of cortical interneuron subtypes. J Neurosci. 2004;24:2612–2622. doi: 10.1523/JNEUROSCI.5667-03.2004. [DOI] [PMC free article] [PubMed] [Google Scholar]
- Zhao Y, Brandish PE, Di Valentin M, Schelvis JP, Babcock GT, Marletta MA. Inhibition of soluble guanylate cyclase by ODQ. Biochemistry. 2000;39:10848–10854. doi: 10.1021/bi9929296. [DOI] [PubMed] [Google Scholar]
- Zhao Y, Flandin P, Long JE, Cuesta MD, Westphal H, Rubenstein JL. Distinct molecular pathways for development of telencephalic interneuron subtypes revealed through analysis of Lhx6 mutants. J Comp Neurol. 2008;510:79–99. doi: 10.1002/cne.21772. [DOI] [PMC free article] [PubMed] [Google Scholar]
Associated Data
This section collects any data citations, data availability statements, or supplementary materials included in this article.
Supplementary Materials
Interneuron migration in the DMSO-treated Lhx6-GFP+ cerebral wall. Images were obtained from the outlined region of embryonic cortical slices. Image orientation is indicated by the arrows. GE, Ganglionic eminence; CX, dorsal cortex; VS, ventricular surface. In E15.5 DMSO-treated Lhx6-GFP+ control cortices, approximately one-third of Lhx6-GFP+ interneurons within the cortical plate are motile (i.e., cells migrating at a rate of >5 μm/h) and display an elongated leading process. Time length = 4.1 h. See also Figure 5, J, L, N, and P–S.
Interneuron migration in the ODQ-treated Lhx6-GFP+ cerebral wall. Within the cortical plate, the number of motile interneurons and the leading process length of tangentially and radially migrating interneurons are significantly decreased in E15.5 ODQ-treated Lhx6-GFP+ cortices compared with DMSO-treated controls. Approximately 5 h after ODQ treatment, interneuron leading process length and motility return to control levels (data not shown). Time length = 3.9 h. GE, Ganglionic eminence; CX, dorsal cortex; VS, ventricular surface. See also Figure 5, K, M, O, P–S″.


