

Abstract
Oscillations and synchrony are often used synonymously. However, oscillatory mechanisms involving both excitation and inhibition can generate non-synchronous yet coordinated firing patterns. Using simultaneous recordings from multiple layers of the entorhinal–hippocampal loop, we found that coactivation of principal cell pairs (synchrony) was lowest during exploration and rapid-eye-movement (REM) sleep, associated with theta oscillations, and highest in slow wave sleep. Individual principal neurons had a wide range of theta phase preference. Thus, while theta oscillations reduce population synchrony, they nevertheless coordinate the phase (temporal) distribution of neurons. As a result, multiple cell assemblies can nest within the period of the theta cycle.
Keywords: theta oscillations, synchrony, temporal coordination, place cells, cell assemblies, brain states
1. Introduction
Improvement of behavioural performance in various tasks is often accompanied by reduced spike correlation among cortical neurons [1–3]. These experimental observations support the suggestion that decorrelated spike fluctuations among neurons are advantageous for population coding because they increase the entropy and reduce the redundancy in the network [4–8]. This view is seemingly at variance with other suggestions that the computational benefit of oscillations is due to neuronal synchrony [9–11], because synchronous discharges of neurons introduce coding redundancy [12,13]. In line with the latter view, several types of oscillations, such as spindles and slow oscillations, powerfully synchronize cortical neurons [14] during sleep. However, oscillations may not always induce synchrony and spike redundancy.
Hippocampal and entorhinal networks display prominent theta oscillations in the exploring waking animal [15] and are thought to serve important coding functions in the generation of ‘place’ cells [16,17] and ‘grid’ cells [18]. Both place cells and grid cells show ‘phase precession’, i.e. their spikes fire at progressively earlier phases of the theta cycle as the animal passes through the place field or the apexes of the grid [16–18]. Therefore, theta oscillations do not simply entrain and synchronize neurons [16,17,19].
To compare the strength of theta oscillations-related population synchrony with neuronal co-activation in other brain states, we quantified temporal co-occurrence of principal cells in the main layers of the entorhinal cortex (EC) and hippocampal subregions. We report that brain states associated with theta oscillations are characterized by significantly less synchrony, yet orderly temporal coordination, across principal neurons than non-theta states.
2. Material and methods
(a). Animals and surgery
Eleven male Long-Evans rats (250–400 g) were implanted with a four- or eight-shank silicon probe in the right dorsal hippocampus under isoflurane anaesthesia (1–1.5%) and recorded from dorsal CA1 pyramidal layers. In four of the rats, another four-shank silicon probe was also implanted in the right dorsocaudal medial EC [20]. The silicon probes were attached to micromanipulators and moved slowly to the target. Each shank had eight recording sites (160 µm2 each site; 1–3 MΩ impedance) and inter-shank distance was 200 µm. Recordings sites were staggered to provide a two-dimensional arrangement (20 µm vertical separation). The EC probe was positioned so that the different shanks recorded from different layers [20]. At the end of the physiological recordings, a small anodal DC current (2–5 µA, 10 s) was applied to recording sites 1 or 2 days prior to sacrificing the animals. The rat was deeply anesthetized and perfused with 10% formalin solution. The position of the electrodes was confirmed histologically and reported previously in detail [20,21]. Two stainless steel screws inserted above the cerebellum were used as indifferent and ground electrodes during recordings.
(b). Behavioural testing
After recovery from surgery (approx. 1 week), physiological signals were recorded during two different types of active waking behaviours [20,22,23]. (i) On the elevated linear track (250 × 7 cm), the animal was required to run back and forth for 30 µl water reward on both ends [20]. (ii) In the open field task, the rats chased randomly dispersed drops of water or pieces of Froot loops (approx. 25 mg, Kellogg's) on an elevated square platform (180 × 180 cm, or 120 × 120 cm) [20]. Theta periods from all maze behaviours were lumped together as ‘RUN’. Recordings were also carried out during sleep, typically both before and after tasks, in the animal's home cage.
(c). Data collection and cell type classification
Detailed information about the recording system and spike sorting has been described [20,21]. Briefly, signals were amplified (1000×), bandpass-filtered (1 Hz to 5 kHz) and acquired continuously at 20 kHz (DataMax system; RC Electronics) or 32 kHz (NeuraLynx, MT, USA) at 16-bit resolution. After recording, the signals were downsampled to 1250 Hz for the local field potential (LFP) analysis. Positive polarity is up in all illustrations. To maximize the detection of very slowly discharging (‘silent’) neurons [24], clustering was performed on concatenated files of several behavioural and sleep sessions recorded at the same electrode position on the same recording day. Spike sorting was performed automatically, using KlustaKwik (http://klustakwik.sourceforge.net [25]), followed by manual adjustment of the clusters, with the help of autocorrelogram, cross-correlogram and spike waveshape similarity matrix (Klusters software package, http://klusters.sourceforge.net [26]). Because none of the existing spike sorting algorithms works completely in an automatic way, manual adjustment is necessary [25]. After spike sorting, we plotted the spike features of units as a function of time, and the units and sessions with signs of significant drift over the period of recording were discarded. Within the remaining data, only units with clear refractory periods and well-defined cluster boundaries were included in the analyses [25,27].
Classification of principal neurons and interneurons of hippocampal and entorhinal cortical neurons was described previously [20,21]. A total of 3541 (CA1), 962 (CA3), 66 (DG), 491 (EC2), 576 (EC3) and 559 (EC5) principal neurons and 468 (CA1), 216 (CA3), 52 (DG), 85 (EC2), 217 (EC3) and 94 (EC5) interneurons were identified and used for analyses. The tip of the probe either moved spontaneously or was moved by the experimenter between recording days to record from potentially different sets of neurons. However, we cannot exclude the possibility that some neurons recorded on different days were identical, because spikes recorded on each day were clustered separately. When we moved the electrodes, we waited for at least an hour before starting recording to stabilize the position of electrodes.
(d). Detection of brain states
Theta periods during task performance (RUN), immobility (IMM), rapid-eye-movement (REM) epochs and slow wave sleep (SWS) were detected using the ratio of the power in theta band (6–10 Hz) to delta band (1–4 Hz) of LFP, followed by manual adjustment with the aid of visual inspection of whitened power spectra and the raw traces [20,22]. The manual adjustment was necessary to remove falsely detected short segments of data and epochs containing movement artefacts. REM periods were cross-validated with experimenter notes taken while observing theta activity online in sleep session and verifying that the rat was sleeping [22,23,28]. The total length of recording was 57.4 ± 36.1 min for RUN, 20.8 ± 13.2 min for REM, 40.0 ± 23.2 min for IMM, 114.7 ± 59.5 min for SWS (mean ± s.d.).
(e). Pairwise correlation analysis
The correlation of spike counts in T ms time resolution (T = 10, 20, 50 or 100) was calculated for each cell pair in each brain state (RUN, REM, IMM or SWS) using a modified version of correlation coefficient recently developed by Renart et al. [7]. Briefly, spike trains were first sorted into 1 ms bins, yielding spike counts vector si(t) (i = 1,2, … ,N; N is the number of cells; t = 0,1, … ,L; L is the length of recording in each brain state) for each neuron. The spike counts vector si(t) was convoluted using a Gaussian kernel of standard deviation T (T = 10, 20, 50 or 100 ms), yielding smoothed spike counts vector ni(t) with temporal resolution of T. The conventional correlation coefficient of spike counts quantifies the degree to which spike counts fluctuations of two neurons i and j measured with respect to their mean spike counts across the whole duration of the spike trains are predictive of each other.
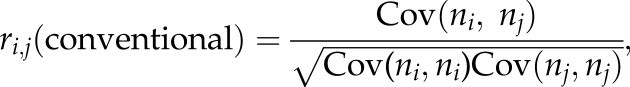 |
where Cov(ni,nj) is the covariance between the spike counts of the two cells
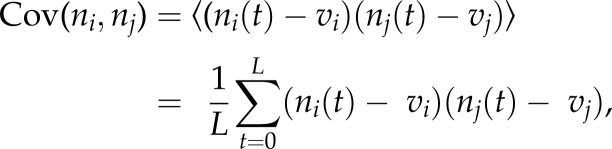 |
and 〈〉 denotes mean across the whole duration in each brain state.
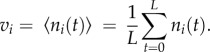
Mean spike counts vi is defined as the mean of ni(t) over the whole length L
 |
This conventional correlation coefficient was used only in the electronic supplementary material, figure S1.
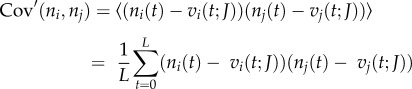
The activity of neurons is non-stationary and therefore spike correlation using the conventional method above in principle may reflect to some extent slow covariation the timescale of which is much slower than the temporal resolution of interest [7]. Coactivations of a given timescale can be isolated by using jitter method [7,29]. For this purpose, mean spike counts vi across the whole recording is replaced by the instantaneous mean spike counts vi(t;J) at time t across an ensemble of jittered surrogates of the spike trains [7].
 |
and
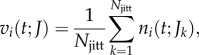 |
where ni(t;Jk) is the spike counts at time resolution T of the kth of jittered spike trains at time t, and Njitt is the number of jittered surrogates. We jittered spike trains by adding to each spike time an independent Gaussian random variable of zero mean and standard deviation J. We used J = 5T. This jitter method destroys the correlation on timescales smaller than J, but slower covariations ( ) are preserved in the jittered surrogates. Practically, instantaneous mean spike counts vi(t;J) were calculated by convolving the actual spike counts vector si(t) with a normalized Gaussian kernel of standard deviation
  [7].
[7].
Correlation coefficient of spike counts at time resolution T is calculated as
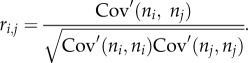 |
This correlation coefficient of spike counts quantifies the degree to which spike counts fluctuation of two neurons measured with respect to their instantaneous mean spike counts are predictive of each other, and is used throughout in this study.
Significance of correlation was assessed using jitter method [7]. Briefly, we jittered spike trains by adding to each spike time an independent Gaussian random variable of zero mean and standard deviation J (J = 5T). The process was repeated independently 200 times to form 200 such surrogate datasets. We repeated the calculation of correlation coefficient of jittered surrogate spike trains in exactly the same way as for the actual spike trains. The correlation coefficient of actual spike trains is regarded as significant if the value is atypical with respect with the correlation coefficient of surrogate spike trains at the cut-off of p < 0.05 [7]. All neurons which fired at least once in a given brain state were included in the analysis. Time resolution T = 10, 20, 50 and 100 ms gave similar results and only correlation coefficients at resolution T = 50 ms are reported in the figures.
(f). Synchrony index
To minimize the effect of slow firing rate covariation on the measured synchrony in theta-cycle timescale, we used two types of synchrony index. The synchrony index (centre versus flanking) at T ms temporal resolution (T = 10, 20, 50 or 100) for each cell pair is defined as follows:
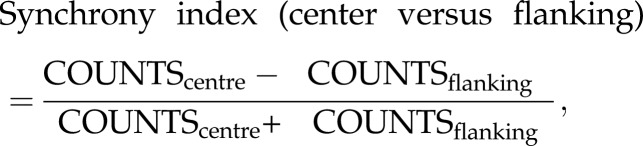 |
where COUNTScentre is the mean counts across bins in [−T/2, +T/2] ms and COUNTSflanking is the mean counts across bins in [−10T, −T/2] ms and [+T/2, +10T] ms in the cross-correlogram. To assess the significance of synchrony index (centre versus flanking), we used a jitter method [29]. For each cell pair, each spike from each neuron in the original dataset was randomly and independently jittered on a uniform interval of [−5T, +5T] ms, to form a surrogate dataset. The process was repeated independently 200 times to form 200 such surrogate datasets. The synchrony index (centre versus flanking) of jittered surrogate spike trains was calculated in the same way as for the actual spike trains. The synchrony index was regarded as statistically significant (p < 0.05) when the synchrony index of actual spike trains was larger (or smaller) than the 97.5 percentile (or 2.5 percentile) of the surrogate synchrony index.
To compute the synchrony index (real centre versus jitter centre), we used a jitter method [29]. For each cell pair, each spike from each neuron in the original dataset was randomly and independently jittered on a uniform interval of [−5T, +5T] ms, to form a surrogate dataset. The process was repeated independently 200 times to form 200 such surrogate datasets. Synchrony index (real centre versus jitter centre) was defined as follows:
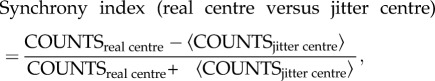 |
where COUNTSreal centre is the mean counts across bins in [−T/2, +T/2] ms for the real spike trains, and COUNTSjitter centre is the mean counts across bins in [−T/2, +T/2] ms for jittered spike trains in the cross-correlogram;  denotes mean across surrogate spike trains. The synchrony index (real centre versus jitter centre) was regarded as statistically significant (p < 0.05) when COUNTSreal centre was larger (or smaller) than the 97.5 percentile (or 2.5 percentile) of the COUNTSjitter centre.
Time resolution T = 10, 20, 50 and 100 ms gave similar results for both synchrony indices, and only indices for resolution T = 50 ms are reported in the figures. To calculate synchrony index for each brain state, only cell pairs in which the number of events in the interval [−5T, +5T] ms in the original cross-correlogram was larger than 50 in that brain state were used.
Data analysis was carried out by custom-written MATLAB-based software.
3. Results
Data analyses have been performed on a database of 7327 neurons in the EC and hippocampus of 11 rats [20–23,28,30]. The surgical, behavioural, recording and signal analysis procedures for these animals have been described in detail earlier [20–23,30]. Local field potentials (LFPs) and unit firing were recorded by multiple-shank silicon probes from the septal third of hippocampal CA1 and CA3 pyramidal layers and dentate gyrus. In four animals, recordings were made simultaneously in CA1 and in multiple layers of the medial EC. Histological localization of the electrodes, criteria for clustering of single units and separation of principal neurons and interneurons in these animals have been described in detail previously [20,21]. Recordings were carried out while the animal ran on an open field or a linear maze [20]. Theta periods from all maze behaviours were lumped together as RUN and periods without theta were concatenated as immobility or consummatory behaviours (IMM). Additional recordings were carried out during sleep, including several epochs of REM sleep and SWS in the animal's home cage, typically both before and after the behavioural sessions [22,23,28].
‘Coactivation’ of neuron pairs was quantified by pairwise correlation coefficient of spike counts [7,31,32] in 10, 20, 50 or 100 ms windows in each brain state. The conventional correlation coefficient of spike counts may reflect to some extent slow covariation the timescale of which is much slower than the temporal resolution of interest (e.g. degree of overlap between two neurons’ place fields). To minimize the effect of slow firing rate covariation on the measured synchrony in the theta-cycle timescale, we used a modified version of correlation coefficient recently developed by Renart et al. [7] (see Material and methods and the electronic supplementary material, figure S1). In line with previous observations [31], CA1 pyramidal cell–pyramidal cell pairs showed stronger positive spike counts correlation during SWS compared with other states (figure 1; p < 0.00001; ANOVA, F3,258271 = 10 775, followed by Tukey's test, p < 0.00001). Coactivation of interneuron–interneuron pairs was almost an order of magnitude higher than that of principal cell–principal cell pairs, partially owing to their higher rates [32] (see electronic supplementary material, figure S2, but also see electronic supplementary material, figures S3 and S4). They also showed a significant dependence on brain state (figure 1; p < 0.00001; ANOVA, F3,3404 = 159). Coactivation of principal neuron–interneuron pairs was similar to principal neuron–principal neuron coactivation. The distribution of correlation coefficients in other hippocampal regions and EC layers was similar (see electronic supplementary material, figure S5).
Figure 1.
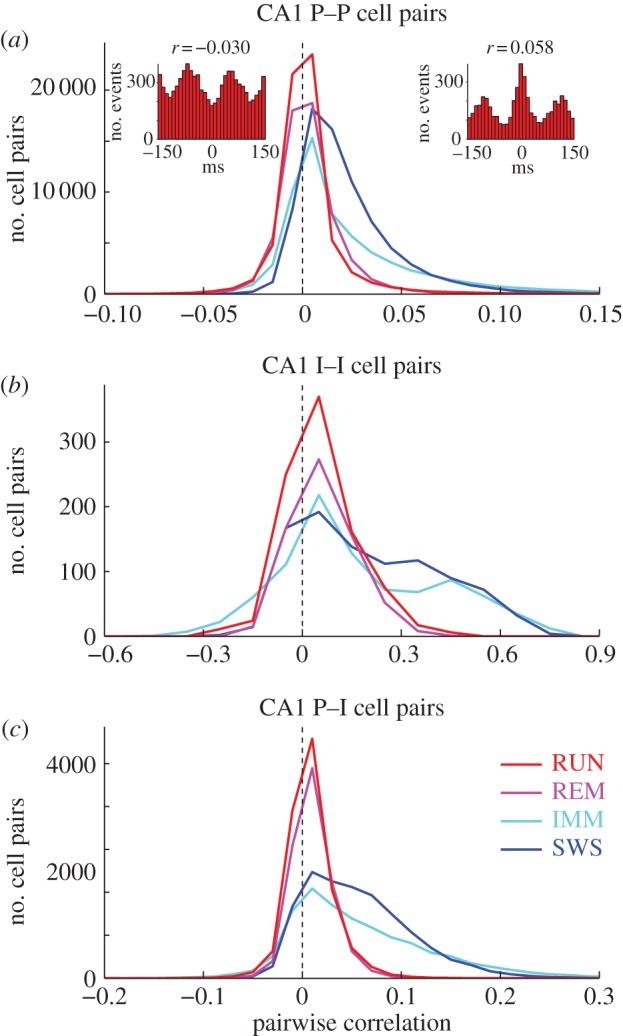
Neuronal synchrony is brain state-dependent. Distribution of the pairwise correlation coefficient values of spike counts in CA1 pyramidal neuron–pyramidal neuron (a), interneuron–interneuron (b) and pyramidal neuron–interneuron pairs (c) in different brain states. Insets: cross-correlograms of example pairs with significant negative (r = −0.030) and positive (r = 0.058) correlation coefficient values during RUN. The time window for the correlation coefficient was 50 ms, but essentially similar patterns were observed at 10, 20, 100 ms windows. (Online version in colour.)
A large fraction of principal neuron–principal neuron pairs showed low and non-significant correlations and, in the next level of analysis, they were excluded (figure 2). Significance of correlation was tested using jitter methods ([7], see Material and methods), and a cut-off of p < 0.05 was used to identify significantly correlated cell pairs. The fraction of significantly positively coactivated (i.e. synchronous) principal neuron–principal neuron pairs during RUN and REM was significantly smaller compared with SWS and IMM (figure 2b; p < 0.00001 in all regions; chi-squared test). Remarkably, a considerable percentage of neuron pairs were significantly negatively correlated. The fraction of negatively correlated principal neuron–principal neuron pairs was significantly different across state (figure 2a,b; p < 0.00001; chi-squared test). The largest percentage of negatively correlated principal neuron–principal neuron pairs was present during RUN in all layers (figure 2).
Figure 2.

Theta oscillations decorrelate spiking between neuron pairs. (a) Distribution of pairwise correlation values of spikes in principal neuron–principal neuron (left), interneuron–interneuron (middle) and principal neuron–interneuron pairs (right) in different brain states (calculated using 50 ms time windows). Only neuron pairs with significant cross-correlograms are shown. Note a fraction of significantly negatively correlated pairs in several regions, mainly during RUN. Note also much stronger correlation between putative interneurons. (b) Fraction of significantly correlated pairs (±95% Clopper–Pearson confidence intervals) in different regions, layers and brain states. Positively and negatively correlated pairs are shown upward and downward, respectively. Note largest positive correlations during SWS and IMM (non-theta) states. See also the electronic supplementary material, figure S5. (Online version in colour.)
Negative correlation between neuronal activity during theta oscillations implies that the member neurons prefer different phases within a given theta cycle [21,33]. This is illustrated in figure 3a where the spatial and temporal relations of five place cells are displayed. The sequentially active place cells on the linear track had time lags commensurate with the distance between their place fields (figure 3a, top and middle traces). This sequential pattern was also expressed in a time-compressed manner at the theta timescale (figure 3a, bottom traces), so that the sequential firing of the neurons within the theta cycle faithfully reflected the longer timescale activity of the same neurons [17,33]. Thus, neurons representing different parts of the environment occupy different phase space in the theta wave, and this sequential organization can explain the negative spike time correlations between neuron pairs.
Figure 3.

Negative correlations reflect phase-distributed cell assemblies in the theta cycle. (a) Top: normalized firing rates of five place cells, with neuron 3 as a reference (black trace with peak firing at 0 cm). Middle: normalized cross-correlations between the reference neuron and other place cells (colours) and the autocorrelogram of the reference neuron (black). Temporal offsets between the peaks represent the time needed for the rat to run between the place fields of the neurons. Bottom: Time-expanded versions of the normalized cross-correlograms shown in the middle (theta timescale). Note that maximum firing of the neurons is distributed within the theta cycle and that the order of peak activity of place cells 1–5 within the theta cycle is the same as the order of position representation on the track. The dip around time 0 in the autocorrelogram of the reference cell is due to refractory period of spikes. Auto- and cross-correlograms in the middle and bottom are plotted in 10 ms time bins without further smoothing. (b) Cross-correlograms of CA1 pyramidal cells in different brain states. Each row corresponds to a normalized cross-correlogram of a cell pair. Bin size, 1 ms; Gaussian kernel smoothing (s.d. = 10 ms) was applied, and height of cross-correlogram was z-scored and colour coded for each cell pair. Neuron pairs were sorted by the timing of the peak of the cross-correlogram. (c) Distribution of synchrony index of principal neuron–principal neuron pairs in 50 ms time windows in different states. Synchrony index was calculated as the difference between the mean spike counts across bins in [−25, +25] ms and that in [−500, −25] and [+25, +500] ms in cross-correlograms divided by the sum (see Material and methods). Only three regions are shown but similar patterns were observed in the dentate gyrus, EC3 and EC5. See also the electronic supplementary material, figure S6–S9. (Online version in colour.)
The state-dependent correlations of firing patterns were qualitatively similar in all temporal windows examined (10–100 ms) but differed across brain states. The largest positive correlations occurred during SWS, likely reflecting co-firing of pyramidal neurons during sharp wave ripples [31,34] (figure 3b,c). Negatively correlated neuron pairs were rare during SWS and IMM. By contrast, negatively correlated principal neuron–principal neuron pairs were frequent during RUN and REM (figure 3b,c and the electronic supplementary material, figures S6–S9).
4. Discussion
We found that temporal synchrony of principal neurons in the hippocampus was weakest during behaviours associated with theta oscillations. How do theta oscillations decrease spiking synchrony of the population? We hypothesize that theta oscillations have a dual function, temporally binding the spikes of a small minority of neurons (i.e. cell assemblies of neurons with overlapping place fields), while maintaining a decorrelation among the assemblies with non-overlapping fields through inhibitory competition.
Theta oscillation and theta-phase nested gamma oscillations serve to coordinate excitatory postsynaptic currents and inhibitory postsynaptic currents whose effects are balanced within large networks [15,35]. Hippocampal principal neurons have been shown to discharge at progressively earlier phases of the theta cycle as the rat moves through the firing field of the neuron [16,17]. The phase advancement of principal cell spikes is accompanied by a coordinated phase shift of the spikes of putative interneurons [36,37], providing balance between excitation and inhibition at the theta timescale. Experimental observations and modelling work suggest that the theta-nested gamma cycles host the cell assemblies of pyramidal cells and interneurons [38–40]. The assembly-recruited interneurons, in turn, suppress the competing place cell assemblies [36,37]. As a result of the inhibitory competition, multiple cell assemblies can nest within a single theta period in successive gamma cycles [21,39]. The observed positive and negative correlation between principal neurons and interneurons during theta oscillations at the timescale of theta cycle (figures 1 and 2 and the electronic supplementary material, S5–S9) support this view. Experiments have also shown that the within-theta cycle delays of place cell pairs, belonging to neighbouring assemblies, are correlated with the distance representation of the cell pairs, so that the assembly representing the current location of the rat fires at the trough of the theta cycle, whereas cell assemblies of the previously and subsequently visited places discharge on the descending and ascending phases, spanning almost the entire cycle (figure 3) [17,21,33,41]. Therefore, while place cells are temporally coordinated within the theta cycle, they do not discharge synchronously but are separated by orderly delays [17,41], as shown by the large fraction of negatively correlated pyramidal cell pairs in the present experiments (see also [38]). When perisomatic inhibition of pyramidal cells is reduced by optogenetic means, the affected pyramidal neurons show reduced phase distribution and tend to fire in synchrony with other disinhibited place cells [42]. Similar mechanisms may be at work in the EC, where multiple grid cell assemblies may nest within the theta cycle [18]. The fraction of negatively correlated neuron pairs also increases in the neocortex during ‘activated’ (i.e. theta) state and focused attention [1–3,7], implying a general mechanism for cell assembly competition with or without theta time coordination.
According to the above framework, precise temporal coordination and synchrony have different meanings, because sequential but temporally precise activity of neurons is deemed asynchronous or ‘polychronous’ [43–45]. In summary, brain states with theta oscillations serve to counter synchrony among neurons and distribute cell assemblies within the theta cycle.
Acknowledgements
We thank K. Diba and E. Pastalkova for sharing their data, and Asohan Amarasingham, Kenneth Harris, Christof Koch, Adrien Peyrache, Alex Reyes and Eric Schomburg for valuable comments, and Alfonso Renart for helpful discussion.
All protocols were approved by the Institutional Animal Care and Use Committee of Rutgers University and New York University.
Funding statement
Supported by National Institutes of Health (NS034994; MH54671; NS074015), National Science Foundation, the J. D. McDonnell Foundation, Uehara Memorial Foundation (K.M.), Astellas Foundation for Research on Metabolic Disorders (K.M.) and the Japan Society of Promotion for Sciences (K.M.).
References
- 1.Cohen MR, Maunsell JH. 2009. Attention improves performance primarily by reducing interneuronal correlations. Nat. Neurosci. 12, 1594–600. ( 10.1038/nn.2439) [DOI] [PMC free article] [PubMed] [Google Scholar]
- 2.Mitchell JF, Sundberg KA, Reynolds JH. 2009. Spatial attention decorrelates intrinsic activity fluctuations in macaque area V4. Neuron 63, 879–888. ( 10.1016/j.neuron.2009.09.013) [DOI] [PMC free article] [PubMed] [Google Scholar]
- 3.Gutnisky DA, Dragoi V. 2008. Adaptive coding of visual information in neural populations. Nature 452, 220–224. ( 10.1038/nature06563) [DOI] [PubMed] [Google Scholar]
- 4.Zohary E, Shadlen MN, Newsome WT. 1994. Correlated neuronal discharge rate and its implications for psychophysical performance. Nature 370, 140–143. ( 10.1038/370140a0) [DOI] [PubMed] [Google Scholar]
- 5.Abbott LF, Dayan P. 1999. The effect of correlated variability on the accuracy of a population code. Neural Comput. 11, 91–101. ( 10.1162/089976699300016827) [DOI] [PubMed] [Google Scholar]
- 6.Ecker AS, Berens P, Keliris GA, Bethge M, Logothetis NK, Tolias AS. 2010. Decorrelated neuronal firing in cortical microcircuits. Science 327, 584–587. ( 10.1126/science.1179867) [DOI] [PubMed] [Google Scholar]
- 7.Renart A, de la Rocha J, Bartho P, Hollender L, Parga N, Reyes A, Harris KD. 2010. The asynchronous state in cortical circuits. Science 327, 587–590. ( 10.1126/science.1179850) [DOI] [PMC free article] [PubMed] [Google Scholar]
- 8.Averbeck BB, Latham PE, Pouget A. 2006. Neural correlations, population coding and computation. Nat. Rev. Neurosci. 7, 358–366. ( 10.1038/nrn1888) [DOI] [PubMed] [Google Scholar]
- 9.Varela F, Lachaux JP, Rodriguez E, Martinerie J. 2001. The brainweb: phase synchronization and large-scale integration. Nat. Rev. Neurosci. 2, 229–239. ( 10.1038/35067550) [DOI] [PubMed] [Google Scholar]
- 10.Engel AK, Fries P, Singer W. 2001. Dynamic predictions: oscillations and synchrony in top-down processing. Nat. Rev. Neurosci. 2, 704–716. ( 10.1038/35094565) [DOI] [PubMed] [Google Scholar]
- 11.Fries P. 2009. Neuronal gamma-band synchronization as a fundamental process in cortical computation. Annu. Rev. Neurosci. 32, 209–224. ( 10.1146/annurev.neuro.051508.135603) [DOI] [PubMed] [Google Scholar]
- 12.Shadlen MN, Newsome WT. 1998. The variable discharge of cortical neurons: implications for connectivity, computation, and information coding. J. Neurosci. 18, 3870–3896. [DOI] [PMC free article] [PubMed] [Google Scholar]
- 13.Shadlen MN, Movshon JA. 1999. Synchrony unbound: a critical evaluation of the temporal binding hypothesis. Neuron 24, 67–77. ( 10.1016/S0896-6273(00)80822-3) [DOI] [PubMed] [Google Scholar]
- 14.Steriade M. 2006. Grouping of brain rhythms in corticothalamic systems. Neuroscience 137, 1087–1106. ( 10.1016/j.neuroscience.2005.10.029) [DOI] [PubMed] [Google Scholar]
- 15.Buzsaki G. 2002. Theta oscillations in the hippocampus. Neuron 33, 325–340. ( 10.1016/S0896-6273(02)00586-X) [DOI] [PubMed] [Google Scholar]
- 16.O'Keefe J, Recce ML. 1993. Phase relationship between hippocampal place units and the EEG theta rhythm. Hippocampus 3, 317–330. ( 10.1002/hipo.450030307) [DOI] [PubMed] [Google Scholar]
- 17.Skaggs WE, McNaughton BL, Wilson MA, Barnes CA. 1996. Theta phase precession in hippocampal neuronal populations and the compression of temporal sequences. Hippocampus 6, 149–172. () [DOI] [PubMed] [Google Scholar]
- 18.Moser EI, Kropff E, Moser MB. 2008. Place cells, grid cells, and the brain's spatial representation system. Annu. Rev. Neurosci. 31, 69–89. ( 10.1146/annurev.neuro.31.061307.090723) [DOI] [PubMed] [Google Scholar]
- 19.Buzsaki G, Moser EI. 2013. Memory, navigation and theta rhythm in the hippocampal-entorhinal system. Nat. Neurosci. 16, 130–138. ( 10.1038/nn.3304) [DOI] [PMC free article] [PubMed] [Google Scholar]
- 20.Mizuseki K, Sirota A, Pastalkova E, Buzsaki G. 2009. Theta oscillations provide temporal windows for local circuit computation in the entorhinal-hippocampal loop. Neuron 64, 267–280. ( 10.1016/j.neuron.2009.08.037) [DOI] [PMC free article] [PubMed] [Google Scholar]
- 21.Diba K, Buzsaki G. 2008. Hippocampal network dynamics constrain the time lag between pyramidal cells across modified environments. J. Neurosci. 28, 13 448–13 456. ( 10.1523/JNEUROSCI.3824-08.2008) [DOI] [PMC free article] [PubMed] [Google Scholar]
- 22.Mizuseki K, Diba K, Pastalkova E, Buzsaki G. 2011. Hippocampal CA1 pyramidal cells form functionally distinct sublayers. Nat. Neurosci. 14, 1174–1181. ( 10.1038/nn.2894) [DOI] [PMC free article] [PubMed] [Google Scholar]
- 23.Mizuseki K, Royer S, Diba K, Buzsaki G. 2012. Activity dynamics and behavioral correlates of CA3 and CA1 hippocampal pyramidal neurons. Hippocampus 22, 1659–1680. ( 10.1002/hipo.22002) [DOI] [PMC free article] [PubMed] [Google Scholar]
- 24.Thompson LT, Best PJ. 1989. Place cells and silent cells in the hippocampus of freely-behaving rats. J. Neurosci. 9, 2382–2390. [DOI] [PMC free article] [PubMed] [Google Scholar]
- 25.Harris KD, Henze DA, Csicsvari J, Hirase H, Buzsaki G. 2000. Accuracy of tetrode spike separation as determined by simultaneous intracellular and extracellular measurements. J. Neurophysiol. 84, 401–414. [DOI] [PubMed] [Google Scholar]
- 26.Hazan L, Zugaro M, Buzsaki G. 2006. Klusters, NeuroScope, NDManager: a free software suite for neurophysiological data processing and visualization. J. Neurosci. Methods 155, 207–216. ( 10.1016/j.jneumeth.2006.01.017) [DOI] [PubMed] [Google Scholar]
- 27.Harris KD, Hirase H, Leinekugel X, Henze DA, Buzsaki G. 2001. Temporal interaction between single spikes and complex spike bursts in hippocampal pyramidal cells. Neuron 32, 141–149. ( 10.1016/S0896-6273(01)00447-0) [DOI] [PubMed] [Google Scholar]
- 28.Mizuseki K, Buzsaki G. 2013. Preconfigured, skewed distribution of firing rates in the hippocampus and entorhinal cortex. Cell Rep. 4, 1010–1021. ( 10.1016/j.celrep.2013.07.039) [DOI] [PMC free article] [PubMed] [Google Scholar]
- 29.Fujisawa S, Amarasingham A, Harrison MT, Buzsaki G. 2008. Behavior-dependent short-term assembly dynamics in the medial prefrontal cortex. Nat. Neurosci. 11, 823–833. ( 10.1038/nn.2134) [DOI] [PMC free article] [PubMed] [Google Scholar]
- 30.Pastalkova E, Itskov V, Amarasingham A, Buzsaki G. 2008. Internally generated cell assembly sequences in the rat hippocampus. Science 321, 1322–1327. ( 10.1126/science.1159775) [DOI] [PMC free article] [PubMed] [Google Scholar]
- 31.Wilson MA, McNaughton BL. 1994. Reactivation of hippocampal ensemble memories during sleep. Science 265, 676–679. ( 10.1126/science.8036517) [DOI] [PubMed] [Google Scholar]
- 32.de la Rocha J, Doiron B, Shea-Brown E, Josic K, Reyes A. 2007. Correlation between neural spike trains increases with firing rate. Nature 448, 802–806. ( 10.1038/nature06028) [DOI] [PubMed] [Google Scholar]
- 33.Dragoi G, Buzsaki G. 2006. Temporal encoding of place sequences by hippocampal cell assemblies. Neuron 50, 145–157. ( 10.1016/j.neuron.2006.02.023) [DOI] [PubMed] [Google Scholar]
- 34.Buzsaki G, Horvath Z, Urioste R, Hetke J, Wise K. 1992. High-frequency network oscillation in the hippocampus. Science 256, 1025–1027. ( 10.1126/science.1589772) [DOI] [PubMed] [Google Scholar]
- 35.Bragin A, Jando G, Nadasdy Z, Hetke J, Wise K, Buzsaki G. 1995. Gamma (40–100 Hz) oscillation in the hippocampus of the behaving rat. J. Neurosci. 15, 47–60. [DOI] [PMC free article] [PubMed] [Google Scholar]
- 36.Maurer AP, Cowen SL, Burke SN, Barnes CA, McNaughton BL. 2006. Phase precession in hippocampal interneurons showing strong functional coupling to individual pyramidal cells. J. Neurosci. 26, 13 485–13 492. ( 10.1523/JNEUROSCI.2882-06.2006) [DOI] [PMC free article] [PubMed] [Google Scholar]
- 37.Geisler C, Robbe D, Zugaro M, Sirota A, Buzsaki G. 2007. Hippocampal place cell assemblies are speed-controlled oscillators. Proc. Natl Acad. Sci. USA 104, 8149–8154. ( 10.1073/pnas.0610121104) [DOI] [PMC free article] [PubMed] [Google Scholar]
- 38.Harris KD, Csicsvari J, Hirase H, Dragoi G, Buzsaki G. 2003. Organization of cell assemblies in the hippocampus. Nature 424, 552–556. ( 10.1038/nature01834) [DOI] [PubMed] [Google Scholar]
- 39.Jensen O, Lisman JE. 1996. Novel lists of 7 ± 2 known items can be reliably stored in an oscillatory short-term memory network: interaction with long-term memory. Learn. Mem. 3, 257–263. ( 10.1101/lm.3.2-3.257) [DOI] [PubMed] [Google Scholar]
- 40.Buzsaki G. 2010. Neural syntax: cell assemblies, synapsembles, and readers. Neuron 68, 362–385. ( 10.1016/j.neuron.2010.09.023) [DOI] [PMC free article] [PubMed] [Google Scholar]
- 41.Geisler C, Diba K, Pastalkova E, Mizuseki K, Royer S, Buzsaki G. 2010. Temporal delays among place cells determine the frequency of population theta oscillations in the hippocampus. Proc. Natl Acad. Sci. USA 107, 7957–7962. ( 10.1073/pnas.0912478107) [DOI] [PMC free article] [PubMed] [Google Scholar]
- 42.Royer S, Zemelman BV, Losonczy A, Kim J, Chance F, Magee JC, Buzsaki G. 2012. Control of timing, rate and bursts of hippocampal place cells by dendritic and somatic inhibition. Nat. Neurosci. 15, 769–775. ( 10.1038/nn.3077) [DOI] [PMC free article] [PubMed] [Google Scholar]
- 43.Szatmary B, Izhikevich EM. 2010. Spike-timing theory of working memory. PLoS Comput. Biol. 6, e1000879 ( 10.1371/journal.pcbi.1000879) [DOI] [PMC free article] [PubMed] [Google Scholar]
- 44.Harris KD, Thiele A. 2011. Cortical state and attention. Nat. Rev. Neurosci. 12, 509–523. ( 10.1038/nrn3084) [DOI] [PMC free article] [PubMed] [Google Scholar]
- 45.Chance FS, Abbott LF, Reyes AD. 2002. Gain modulation from background synaptic input. Neuron 35, 773–782. ( 10.1016/S0896-6273(02)00820-6) [DOI] [PubMed] [Google Scholar]