Abstract
Sensory integration of touch and sight is crucial to perceiving and navigating the environment. While recent evidence from other sensory modality combinations suggests that low-level sensory areas integrate multisensory information at early processing stages, little is known about how the brain combines visual and tactile information. We investigated the dynamics of multisensory integration between vision and touch using the high spatial and temporal resolution of intracranial electrocorticography in humans. We present a novel, two-step metric for defining multisensory integration. The first step compares the sum of the unisensory responses to the bimodal response as multisensory responses. The second step eliminates the possibility that double addition of sensory responses could be misinterpreted as interactions. Using these criteria, averaged local field potentials and high-gamma-band power demonstrate a functional processing cascade whereby sensory integration occurs late, both anatomically and temporally, in the temporo–parieto–occipital junction (TPOJ) and dorsolateral prefrontal cortex. Results further suggest two neurophysiologically distinct and temporally separated integration mechanisms in TPOJ, while providing direct evidence for local suppression as a dominant mechanism for synthesizing visual and tactile input. These results tend to support earlier concepts of multisensory integration as relatively late and centered in tertiary multimodal association cortices.
Introduction
Behavioral studies demonstrate that multisensory integration can significantly improve detection, discrimination, and response speed (Welch and Warren, 1986). However, the neural mechanisms underlying multisensory integration remain unsolved. Studies of multisensory processing have focused on audio–visual integration. Less is known about the neurophysiological and spatiotemporal mechanisms that fuse visual and tactile modalities to help us navigate the environment and create our sense of peripersonal space (Rizzolatti et al., 1981).
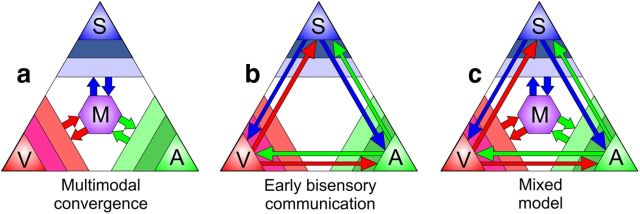
Classically, multisensory integration occurs in higher-order temporo–parieto–occipital and prefrontal hubs after extensive unisensory processing (Jones and Powell, 1970; Fig. 1a). Recent primate work challenges this view, with electrophysiology and neuroimaging evidence for early multisensory responses in low-level sensory cortices (Kayser and Logothetis, 2007; Fig. 1b). In humans, visuo-tactile neuroimaging studies have identified multisensory responses in intraparietal, premotor, and inferior post-central cortices (Schürmann et al., 2002), as well as cross-modal interactions in ventral premotor (Cardini et al., 2011a), somatosensory (Cardini et al., 2011b), and occipital cortices (Macaluso et al., 2000), providing candidate areas for early visuo–tactile integration.
Figure 1.
Models of multisensory processing. The three points of the largest triangle represent the somatosensory (S), visual (V), and auditory (A) streams. Color slices in the corner indicate primary, secondary, and tertiary unimodal areas. Hierarchical multisensory processing is represented by the purple hexagon (M). Arrows indicate flow of sensory information. a, Traditional, hierarchical views of multisensory processing posit that streams are integrated after initial unisensory processing. b, Recent research has also supported the model of early direct interactions between primary sensory cortices. c, The mixed model of multisensory processing combines these two views to describe how early unisensory processing can be modulated by other sensory inputs, and later sensory streams can be integrated into spatially precise higher-order multisensory representations.
Functional MRI studies of cross-modal integration (Bremmer et al., 2001; Driver and Noesselt, 2008; Gentile et al., 2011) lack the temporal resolution to determine whether multisensory responses in unisensory areas precede those in supramodal hubs. Averaged EEG [event-related potentials (ERPs); Schürmann et al., 2002] and MEG [event-related fields (ERFs); Kida et al., 2007; Bauer et al., 2009] reveal the temporal dynamics of multisensory integration. However, the cortical sources underlying these effects cannot be localized with certainty, preventing localization of multisensory effects to primary versus associative cortices. To overcome these limitations, we directly recorded local field potentials (LFPs) from subdural electrodes implanted in patients with intractable epilepsy, which provides exquisite temporal and spatial resolution. We analyzed the averaged LFPs (aLFPs), or intracranial ERPs, which correspond to the generators of ERPs/ERFs. In addition, we investigated high gamma power (HGP), a relatively direct measure of local high-frequency synaptic and spiking activity (Manning et al., 2009; Miller et al., 2009).
Subjects were presented with a high number of spatially and temporally coincident visual and tactile stimuli to the hand while performing a simple reaction time (RT) task that elicited early integration responses in other modality combinations (Molholm et al., 2002; Foxe and Schroeder, 2005). We introduce a novel, two-step criterion for defining multisensory integration that controls for false-positive results due to double addition of nonspecific responses, a potential confound previously discussed but rarely tested. Using this criterion, we observed the first dominant multisensory integration HGP responses in supramarginal gyrus (SMG) at 157–260 ms, and then in middle frontal gyrus (MFG) at 280 ms. All HGP multisensory integration responses showed strong bimodal response suppression. In addition, HGP responses occurred later than aLFP responses in the supramarginal gyrus. Despite broad electrode coverage over regions with strong unimodal responses, and a large number of trials, we found no evidence for multisensory integration before 150 ms in primary sensory areas. These results tend to support earlier concepts of multisensory integration as relatively late and centered in tertiary multimodal association cortices.
Materials and Methods
Ethics statement
All procedures were approved by the Institutional Review Boards at the New York University Langone Medical Center in accordance with National Institutes of Health guidelines. Written informed consent was obtained from all patients before their participation.
Participants
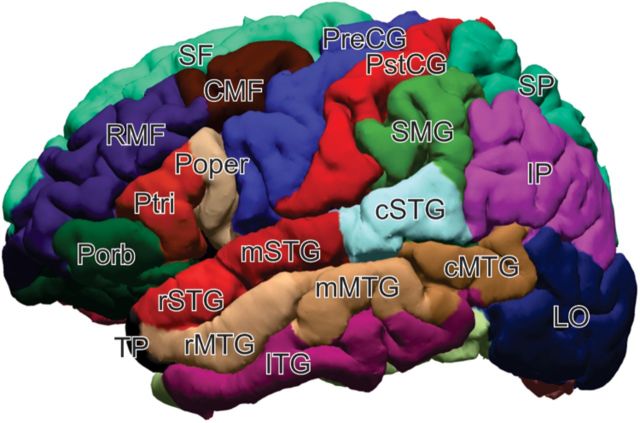
Five patients (three females) with intractable epilepsy underwent invasive monitoring to localize the epileptogenic zone before its surgical removal (Table 1). Each patient was implanted with an array of subdural platinum-iridium electrodes embedded in SILASTIC sheets (2.3 mm exposed diameter, 10 mm center-to-center spacing; Ad-Tech Medical Instrument) placed directly on the cortical surface across multiple brain regions distant from the seizure focus. Before implantation, each patient underwent high-resolution T1-weighted MRI. Subsequent to implantation, the patients underwent postoperative MRI. Electrode coordinates obtained from postoperative scans were coregistered with preoperative MRI and overlaid onto the patient's reconstructed cortical surface using Freesurfer (Fischl et al., 1999). A spatial optimization algorithm was used to integrate additional information from the known array geometry and intraoperative photos to achieve high spatial accuracy of the electrode locations in relation to the cortical MRI surface created during FreeSurfer reconstruction (Yang et al., 2012). Electrode coordinates were projected onto the FreeSurfer average brain using a spherical registration between the individual's cortical surface and that of the FreeSurfer average template. The cortex was automatically parcellated into 36 regions using FreeSurfer methods (Desikan et al., 2006) and was used to group electrodes by the region of cortex from which they were sampled (for reference image, see Fig. 2).
Table 1.
Characteristics of patients in the study
| Patient | Sex | Age (years) | Electrodes implanted | VCI | POI | WMI | PSI | AMI | VMI | Implant hemisphere |
|---|---|---|---|---|---|---|---|---|---|---|
| A | F | 44.9 | 142 | 86 | 76 | N/A | N/A | N/A | N/A | Left |
| B | F | 17 | 156 | 94 | N/A | N/A | N/A | N/A | N/A | Left, right |
| C | M | 26.2 | 144 | 100 | 142 | 105 | 114 | 71 | 78 | Left |
| D | M | 42.4 | 145 | 109 | 125 | 121 | 93 | 77 | 105 | Right |
| E | F | 22.4 | 30 | 96 | 95 | 108 | 81 | – | – | Right |
Five patients participated in this study. Neuropsychological assessments are shown above for Verbal Comprehension Index (VCI), Perceptual Organization Index (POI), Working Memory Index (WMI), Processing Speed Index (PSI), Auditory Memory Index (AMI), and Visual Memory Index (VMI). Two patients had right hemisphere implants, two patients had left hemisphere implants, and one patient had bilateral implants (the majority of which were on the left hemisphere). F, Female; M, male; N/A, not applicable.
Figure 2.
Lateral view of the parcellation map used to automatically identify regions of cortex. Abbreviations are defined for each of the four main lobes. Frontal lobe: Porb, pars orbitalis; Ptri, pars triangularis; Poper, pars opercularis; SF, superior frontal; RMF, rostral middle frontal; CMF, caudal middle frontal; PreCG, precentral gyrus. Parietal lobe; PstCG, post-central gyrus; SMG, supramarginal gyrus; SP, superior parietal; IP, inferior parietal. Occipital lobe: LO, lateral occipital. Temporal lobe: TP, temporal pole; rSTG, rostral superior temporal gyrus; mSTG, mid-superior temporal; cSTG, caudal superior temporal; rMTG, rostral middle temporal gyrus; mMTG, mid-middle temporal; cMTG, caudal middle temporal; ITG, inferior temporal gyrus.
Stimuli and procedure
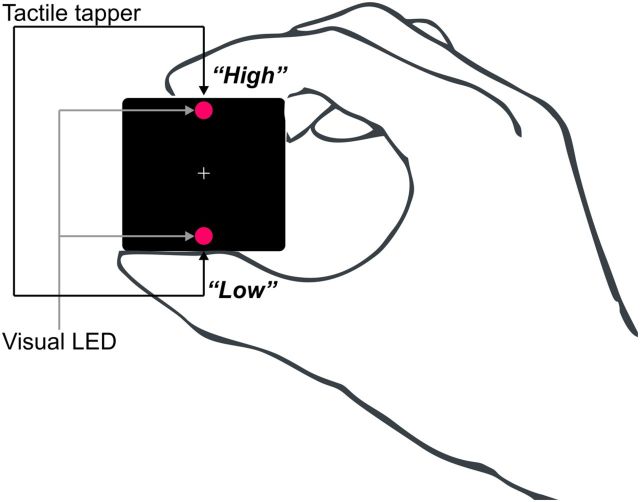
Stimuli consisted of a single tactile tap from a solenoid tapper, a brief flash of light from a light-emitting diode (LED), or a simultaneously presented tap and flash (duration, 10 ms), delivered to the index finger and thumb of the hand contralateral to the implant side. Stimuli were delivered from a handheld device, shown in Figure 3. The patients were instructed to make quick detection responses to stimuli of a target modality—either visual or tactile—and to ignore stimuli in the other modality. The results of the present analysis were collapsed across attention conditions. The bimodal stimuli were presented as congruent, from the same position (i.e., both at index finger or both at thumb), or incongruent, from opposite positions (Fig. 3, list of the stimulation conditions). The interstimulus interval was randomized between 1000 and 1200 ms. Three hundred trials were conducted per condition, organized into four separate 8 min blocks with the target modality alternating between blocks.
Figure 3.
Schematic illustration showing the device and how it was held with the hand contralateral to the implant side. Participants used their ipsilateral hand to respond with a button press. The visual stimuli consisted of two red LEDs, positioned at the top and bottom of the handheld device. Solenoid tactile tappers were embedded in the top and bottom surfaces of the device adjacent to LEDs on the facing surface.
Data acquisition
The five patients were implanted with 30–156 clinical electrode contacts each in the form of grid, strip, and/or depth arrays. The placement of electrodes was based entirely on clinical considerations for the identification of seizure foci, as well as eloquent cortex for functional stimulation mapping. Consequently, a wide range of brain areas was covered, with coverage extending widely into nonepiletogenic regions. EEG activity was recorded from 0.1 to 230 Hz (3 dB down) using Nicolet clinical amplifiers, and the data were digitized at 400 Hz and referenced to a screw bolted to the skull.
Data preprocessing
Intracranial EEG data and harmonics were notch filtered at 60 Hz using zero-phase shift finite impulse response filters and epoched. Independent component analysis using the runica algorithm (Bell and Sejnowski, 1995) was performed on the epoched data. Components dominated by large artifacts—from movement, eye blinks, or electrical interference—were identified and removed by inspection. The component data were then back-projected to remove the artifacts from the original data.
High-gamma band processing
Epochs were transformed from the time domain to the time–frequency domain using the complex Morlet wavelet transform. Constant temporal and frequency resolution across target frequencies were obtained by adjusting the wavelet widths according to the target frequency. The wavelet widths increase linearly from 14 to 38 as frequency increases from 70 to 190 Hz, resulting in a constant temporal resolution (σt) of 16 ms and frequency resolution (σf) of 10 Hz. For each epoch, spectral power was calculated from the wavelet spectra, normalized by the inverse square frequency to adjust for the rapid drop-off in the EEG power spectrum with frequency, and averaged from 70 to 190 Hz, excluding line noise harmonics. Visual inspection of the resulting high-gamma power waveforms revealed additional artifacts not apparent in the time domain signals, which were excluded from the analysis.
Statistical analysis
Active from baseline.
To evaluate and select electrodes for later testing between conditions effects, we used a two-tailed unpaired t test (p < 0.001) to identify electrodes showing a significant response across the poststimulus time window relative to baseline before stimulus onset.
Between conditions.
A modified version of the cluster-based, nonparametric statistical procedure outlined by Maris and Oostenveld (2007) was used to test for the effects of stimulus type on high gamma power. An unpaired two-sample t test was used as the sample-level (an individual time point within a single channel) statistic to evaluate possible between-condition effects. Continuous, statistically significant (defined as p < 0.01) samples within a single electrode were used to identify the cluster-level statistic, which was then computed by summing the sample-level statistics within a cluster. Statistical significance at the cluster level was determined by computing a Monte Carlo estimate of the permutation distribution of cluster statistics using 1200 resamples of the original data. The estimate of the permutation distribution was performed by 1200 resamples of the condition labels associated with each level in the factor. Within a single electrode, a cluster was taken to be significant if it fell outside the 95% confidence interval of the permutation distribution for that electrode. The determination of significant clusters was performed independently for each electrode. This method controlled the overall false-alarm rate within an electrode across time points.
Habituation effects.
We examined responses for habituation effects by taking the peak amplitude in both the HGP and the aLFP, and calculating the Pearson r correlation coefficient between the response amplitude and trial number. Separate calculations were performed for unimodal visual stimulation (V), unimodal tactile stimulation (T), and bimodal stimulation (VT) trials.
Spatial congruency effects
Before we established which electrodes showed multisensory integration, we explicitly tested whether any electrodes showed significant differences in high gamma power between the congruent with incongruent bimodal conditions. We used the statistical methods described above to test response differences between the congruent VT (VTc) and incongruent VT (VTi) conditions. Across all electrodes, the high-gamma responses showed no differences in magnitude between congruent and incongruent conditions of visuo-tactile stimulation; so hereafter, we pooled together the responses to create a spatially nonspecific VT condition.
Results
Behavioral results
Visual stimuli were LEDs located next to either the thumb or forefinger on a small box held between them; tactile stimuli were vibrations of the thumb or forefinger (Table 2; see Fig. 10). Bimodal stimuli could be either congruent (e.g., LED next to the stimulated digit) or incongruent (e.g., thumb vibration at the same time as LED next to the forefinger). Overall, participants had high detection accuracy (87.2%), which did not differ across experimental conditions (all p > 0.05). In contrast, clear differences between experimental conditions were observed for the RTs. The mean RT across patients was 295 ms (SEM, 35 ms) for VT, 307 ms for V (SEM, 33 ms), and 331 ms (SEM, 33 ms) for T. RT to VT was significantly shorter than to T (t(4) = 3.93, p < 0.008) and RT to VT was faster compared with V (t(4) = 2.22, p = 0.045).
Table 2.
Stimulus condition used in the study
| Stimulus conditions | Combinations |
|---|---|
| Vlo | V |
| Vhi | |
| Thi | T |
| Tlo | |
| VTc_hi | VTc |
| VTc_lo | |
| VTi_Tlo | VTi |
| VTi_Vlo |
The participants were presented with eight basic different stimulus conditions (see column 1), which were further reduced to a total of four experimental conditions (column 2). Vlo, Visual low; Vhi, visual high; Thi, tactile high; Tlo, tactile low; VTC_hi, visual high and tactile high; VTc_lo, visual low and tactile low; VTi_Tlo, tactile low and visual high; VTi_Vlo, visual low and tactile high.
Figure 10.
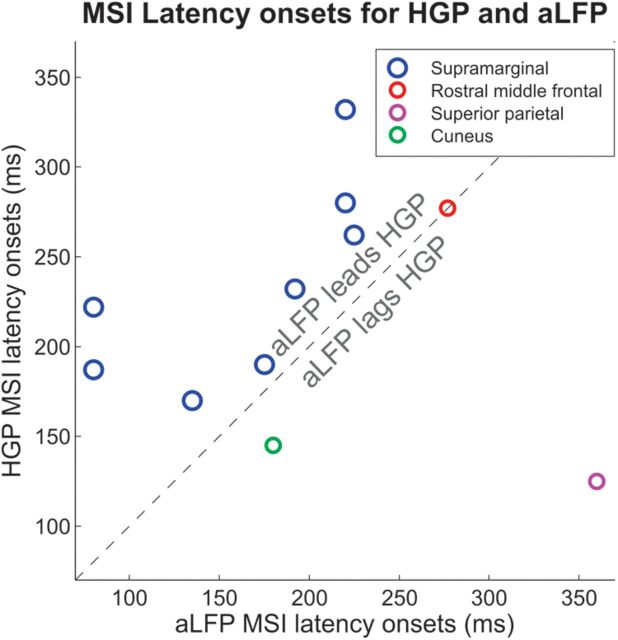
Latency of multisensory integration effects in the aLFP (x-axis) plotted against the latency of multisensory integration effects in the high gamma band (y-axis) for different brain areas. In the supramarginal gyrus, aLFP multisensory effects occur consistently earlier than high gamma effects.
Criteria for identifying multisensory integration responses
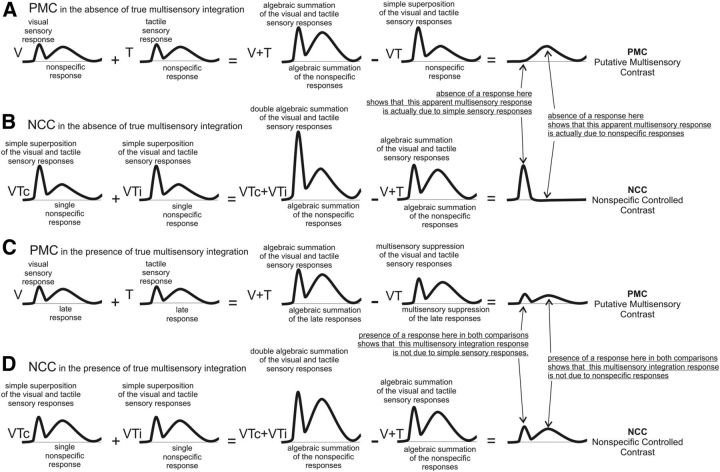
When recording from a single neuron, multisensory integration has been classified based on direct comparisons of firing rates in response to bimodal and unimodal stimuli (Stein et al., 1993; Avillac et al., 2007) as additive, subadditive, or superadditive (for review, see Stein et al., 2009). Human neuroimaging studies have used similar and other less stringent criteria adapted from the single-unit literature (Calvert and Thesen, 2004; Beauchamp, 2005). While no firm consensus has been reached as to how to define integrative responses, a metric must always be considered in relation to the recording modality, and the use of several metrics to describe a dataset have been proposed (Stein et al., 2009). At the local neural population level, measured in our study, we classified electrode recording sites first as “putatively multisensory” when the HGP or aLFP was subadditive or superadditive using the following criterion: VT ≠ V + T (Stein et al., 1993). The assumption of this procedure is that any difference between the response to bimodal stimulation, and the sum of the responses to the two unimodal stimulations, represents integrative processes between the two modalities. We term this the “putative multisensory contrast” (PMC). However, this criterion will yield false positives if there is a nonspecific response common to all three stimulus conditions (V, T, and VT) that is not related to multisensory integration per se, but to processes such as orienting, target identification, response organization, decision, self-monitoring, and stimulus expectancy. Such responses would occur equally often to each of the three types of stimulus events (T, V, and VT), appearing only once in the VT conditions, but twice in the sum (V + T) condition. Thus, this imbalance would appear in the subtraction, creating an effect that might be falsely mistaken for a true visuo-tactile interaction.
A specific example of how expectancy can introduce such a confound was provided by Teder-Sälejärvi et al. (2002). In typical sensory experiments, such as the present one, the regular and relatively short interstimulus intervals result in the subject developing a time-locked expectancy before the arrival of stimuli, which is manifest in the EEG as the final segment of the “contingent negative variation” (CNV). The CNV overlaps with the arrival of all stimuli, and, in the context of a bimodal sensory integration experiment, the metric (V + T) − VT would thus lead to an unequal subtraction, even in the absence of any true multisensory integration. Specifically, in this case, the standard subtraction procedure would be nonzero due to double addition of the CNV (e.g., [V + CNV] + [T + CNV] − [VT + CNV] = V-V − T-T − 2 × CNV − CNV = CNV). Thus, a CNV present in all trials would be mistakenly interpreted as an integration effect (Fig. 4, simulated waveforms and additions).
Figure 4.
Illustration showing how the conjunction of contrasts allows multisensory integration to be identified without nonspecific confounds. Idealized waveforms are shown in response to V, T, VTc, VTi, and all VT waveforms. Also shown are constructed sums of these waveforms as indicated (V + T, VTc + VTi), as well as the PMC calculated using the formula (V + T) − VT, and the NCC, calculated as (VTc + VTi) − (V + T). A, PMC allows nonspecific responses to be mistaken for multisensory integration responses. B, NCC is useful to detect nonspecific responses mistakenly detected by PMC, but itself is sensitive to mistaking sensory responses for multisensory integration. C, D, The combination of PMC and NCC allows responses reflecting multisensory integration to be distinguished from those due to nonspecific activation associated with all stimuli, as well as simple independent sensory responses. Only effects that fulfill both PMC and NCC criteria are indicative of sensory integration.
Such nonspecific activation when an observer is expecting the delivery of a stimulus, and the consequent potential confound, is not just a theoretical possibility. In fact, the few studies that have controlled for preparatory state (Busse et al., 2005; Talsma and Woldorff, 2005) only reported late effects at ∼180 ms rather than the early effects at ∼30–60 ms, which are reported in studies that did not control for these potential artifacts. Thus, the use of the (V + T) − VT criterion may lead to early effects that are, in fact, not multisensory integration responses but are stimulus expectancy effects masked as such due to a metric that does not control for nonspecific effects.
Similar confounds can arise due to other nonspecific responses, such as orienting (Sokolov, 1963). Incoming stimuli in all modalities send collaterals to the ascending reticular system, and these evoke orienting responses, which are manifested in the multiphasic P3a complex. This complex is generated in attentional circuits centered on the anterior cingulate gyrus, intraparietal sulcus, and principal sulcus, beginning at ∼150 ms (Baudena et al., 1995; Halgren et al., 1995a,b).
To detect and disregard those artifactual multisensory responses that may actually reflect nonspecific responses, we applied an additional criterion. We also tested whether the sites with significant PMC also showed significant differences in a contrast where the number of waveforms being averaged together, and thus the nonspecific effects, were matched. To do this, we first verified that there was no effect of spatial congruency present in any electrode (see Materials and Methods), and then took the arithmetical sum of the VTc and the VTi trials, comparing them to the arithmetical sum of V and T trials, in configurations that mimic the congruent and incongruent states. We term this the “nonspecific controlled contrast” (NCC). A difference between these sums would not reflect nonspecific effects (since they occur equally in each sum) but could reflect either simple sensory effects or multisensory integration effects (since they both occur twice in the VTc + VTi sum compared with the V + T sum). In contrast, the PMC procedure could not reflect simple sensory effects because they are exactly balanced between the minuend and the subtrahend. Consequently, in order for a response to be termed “reflecting multisensory integration” (MSI), we required that significant differences be simultaneously present in both the PMC and NCC comparisons. We thus report here only those sites that were significant using both the PMC and NCC criteria, and call these effects MSI (Fig. 4, schematic representation).
Note that summing the VTc and VTi condition was possible in this case because there were no significant differences between these conditions in any electrode/time point. Designs lacking such an incongruent condition, or where incongruence produces significant effects, can substitute by multiplying the bimodal congruent condition by a factor of two. Thus, this metric is applicable to most standard multisensory integration experiments.
Distribution of electrodes
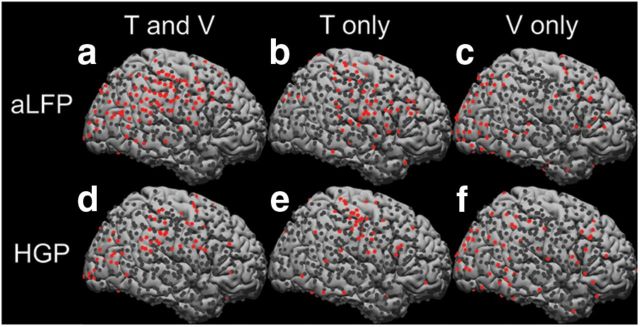
Intracranial neurophysiological responses were recorded from a total of 646 implanted electrodes in five patients. Figure 5 shows the distribution of electrodes covering a large number of brain areas, mostly on the lateral cortex of the parietal, temporal, occipital, and frontal lobes. From the total of 646 electrodes implanted, a large proportion (381, 58%) showed significant aLFP responses, and 260 (40%) showed significant HGP responses to visual, tactile, and/or visual-tactile stimulation. Areas showing the highest percentage of overall active electrodes included the lateral occipital cortex and post-central gyrus. There was an overall trend for HGP responses to be more focal than aLFP, especially in post-central gyrus, and in the same electrodes for HGP to have better retinotopic and somatotopic differentiation compared with aLFP (Figs. 6, 7).
Figure 5.
Coverage of all sampled brain areas. Individual patient MRIs and electrode coordinates were coregistered to the MNI template. Left hemisphere electrodes were projected onto the right hemisphere. Electrodes are displayed on a reconstructed brain surface in MNI template space. Not shown are depth electrodes, which penetrated the cortical surface and targeted subcortical or medial sites. Active electrodes, defined by significant responses from baseline (p < 0.001) from stimulus presentation until 220 ms are shown in red. a–c, The top row shows the active aLFP electrodes to both tactile and visual stimuli (a), to only tactile stimuli (b), and to only visual stimuli (c). d–f, The bottom row shows the active electrodes, measured by HGP, to both tactile and visual (d), only tactile stimuli (e), and only visual stimuli (f).
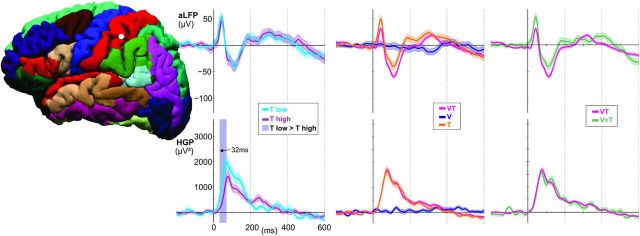
Figure 6.
Sample electrode in post-central gyrus. The electrode displayed early (32 ms) somatotopic responses (i.e., greater HGP response to tactile stimulation of thumb compared with index finger, p < 0.01), indicating its location over primary somatosensory cortex. No significant response differences observed in PMC for aLFP or HGP. Therefore, a response indicative of multisensory integration was not observed.
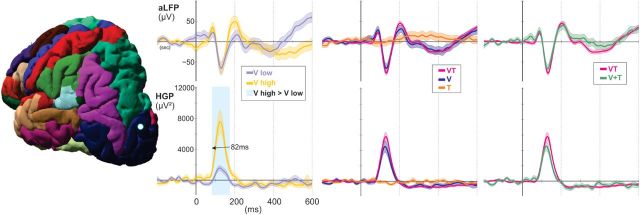
Figure 7.
Example electrode in the lateral occipital cortex. aLFP waveforms on the top row correspond to HGP waveforms on the bottom row. This electrode displayed early retinotopic HGP responses at 82 ms, where responses to visual stimuli in the high position were greater than stimuli in the low position (p < 0.01). No putative multisensory characteristics are observed at this site.
Location of responses and multisensory effects
In visual/lateral occipital cortex, the PMC criterion produced significant effects in the aLFP in 8 electrodes (32% of all responsive electrodes), with an earliest effect at 147 ms, and for HGP in 12 electrodes (48%), with an earliest effect at 95 ms. The mean onset of these putative multisensory responses was 317 ms in the aLFP and 177 ms in the HGP. However, when controlling for nonspecific effects with the NCC criterion, no electrodes show significant evidence for multisensory integration processes.
Similarly, in the precentral and post-central gyri, integration responses were observed in 18 (56%, earliest effect at 65 ms) and 18 (49%, earliest effect at 78 ms) electrodes for aLFP, and in 11 (41%, earliest effect at 160 ms) and 7 (20%, earliest effect at 102 ms) electrodes in HGP, respectively. In precentral gyrus, putative multisensory effects had a mean onset of 222 ms in aLFP and 161 ms in HGP. In post-central gyrus, these effects had a mean onset of 216 ms in aLFP and 195 ms in HGP. But when applying the NCC criterion, only four aLFP electrodes and one HGP electrode survived this correction. This shows that, without correcting for nonspecific effects, multisensory integration responses in low-level sensory areas appear to occur relatively frequently, and misinterpretation as true sensory integration effects is likely to occur. Multisensory integration responses also tended to occur earlier (e.g., at 78 ms in post-central gyrus) than MSI effects. However, when appropriately corrected, evidence for multisensory integration in these areas became rare or nonexistent, and tended to occur later. It should also be noted that the average of the surviving effects in the three cortical areas fell between 280 and 330 ms, with an earliest response in SMG at 157 ms, and are thus occurring “late.”
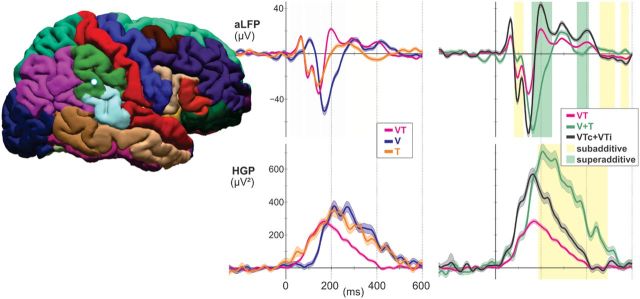
In the temporal-parietal junction/supramarginal gyrus, the PMC criterion produced significant effects in the aLFP in 21 electrodes (62% of all responsive electrodes), and in the HGP in 17 electrodes (59%). When controlling for nonspecific effects with the NCC criterion, 8 electrodes (38% of PMC significant) are observed in aLFPs, and in 10 electrodes (59%) in HGP. All HGP responses satisfying both criteria showed subadditive, or suppressive, responses to bimodal stimuli compared with the sum of unimodal visual and tactile responses. Subadditive responses in HGP occurred with a mean onset of 260 ms. The aLFP responses satisfying both criteria showed both superadditive (mean onset, 226 ms) and subadditive (mean onset, 170 ms) responses to bimodal stimuli.
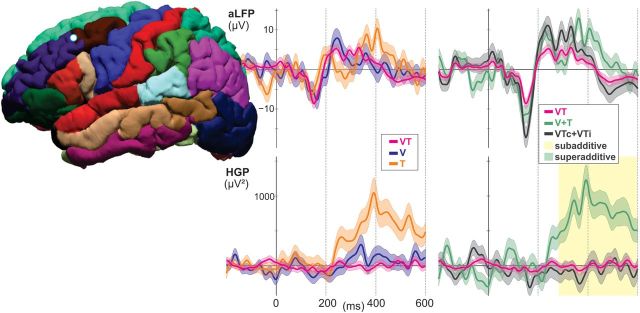
In the rostral middle frontal gyrus, the PMC criterion produced significant effects in the aLFP for two electrodes (15% of active), and in the HGP for four electrodes (31%). After applying the NCC criterion, an effect in one electrode (25% of PMC significant) was observed in aLFPs, and in two electrodes (50%) were observed in the HGP responses. Both HGP responses that survived were subadditive and began at 280 ms post-stimulus onset. A summary of multisensory integration findings is presented in Table 3.
Table 3.
Summary of electrode activity by region of cortex
| Region | Electrodes | Active electrodes | PMC significant electrodes | Earliest PMC onset (ms) | MSI-subadditive responses (% PMC) | Mean MSI-subadditive onset (ms) | MSI-superadditive responses (% PMC) | Mean MSI-superadditive onset (ms) |
|---|---|---|---|---|---|---|---|---|
| Supramarginal gyrus | 34 | 29 (85) | 17 (59) | 115 | 10 (59) | 260 | 0 | — |
| 34 (100) | 21 (62) | 70 | 8 (38) | 170 | 8 (38) | 226 | ||
| 8 overlap | ||||||||
| Superior parietal | 16 | 8 (50) | 4 (50) | 125 | 0 | — | 1(25) | 125 |
| 8 (50) | 7 (88) | 80 | 3 (43) | 213 | 0 | — | ||
| Rostral middle frontal | 23 | 13 (57) | 4 (31) | 101 | 2 (50) | 280 | 0 | — |
| 13 (57) | 2 (15) | 170 | 0 | — | 1 (50) | 277 | ||
| Inferior parietal | 38 | 18 (47) | 9 (50) | 150 | 1 (11) | 150 | 0 | — |
| 29 (76) | 18 (62) | 167 | 3 (17) | 167 | 6 (33) | 283 | ||
| 0 overlap | ||||||||
| Lateral occipital | 29 | 25 (86) | 12 (48) | 95 | 0 | — | 0 | — |
| 25 (86) | 8 (32) | 147 | 0 | — | 0 | — | ||
| Precentral gyrus | 32 | 27 (84) | 11 (41) | 160 | 0 | — | 0 | — |
| 32 (100) | 18 (56) | 65 | 1 (5) | 330 | 0 | — | ||
| Postcentral gyrus | 42 | 35 (83) | 7 (20) | 102 | 1 (14) | 280 | 0 | — |
| 37 (88) | 18 (49) | 78 | 3 (17) | 327 | 0 | — | ||
| 1 overlap | ||||||||
| Caudal middle temporal | 22 | 14 (64) | 6 (43) | 245 | 1 (17) | 245 | 0 | — |
| 15 (68) | 9 (60) | 180 | 2 (22) | 378 | 4 (44) | 262 | ||
| 1 overlap | ||||||||
| Caudal middle frontal | 14 | 9 (64) | 2 (22) | 317 | 0 | — | 0 | — |
| 10 (71) | 4 (40) | 102 | 0 | — | 1 (25) | 287 | ||
| Cuneus | 10 | 10 (100) | 3 (30) | 140 | 1 (33) | 145 | 0 | — |
| 10 (100) | 6 (60) | 175 | 1 (17) | 180 | 1 (17) | 330 | ||
| 1 overlap | ||||||||
| Fusiform | 18 | 7 (39) | 3 (43) | 187 | 1 (33) | 313 | 0 | — |
| 12 (66) | 4 (33) | 145 | 0 | — | 2 (50) | 170 | ||
| Inferior temporal | 34 | 11 (32) | 7 (64) | 162 | 0 | — | 0 | — |
| 15 (44) | 3 (20) | 150 | 1 (33) | 235 | 0 | — | ||
| Lateral orbitofrontal | 12 | 6 (50) | 2 (33) | 305 | 0 | — | 0 | — |
| 10 (83) | 0 | — | 0 | — | 0 | — | ||
| Lingual | 12 | 7 (58) | 2 (29) | 185 | 0 | — | 0 | — |
| 8 (66) | 6 (75) | 125 | 1 (17) | 280 | 1 (17) | 325 | ||
| Mid-middle temporal | 22 | 8 (36) | 1 (13) | 88 | 0 | — | 0 | — |
| 14 (63) | 4 (29) | 100 | 0 | — | 0 | — | ||
| Rostral middle temporal | 21 | 6 (29) | 0 | — | 0 | — | 0 | — |
| 9 (42) | 1 (11) | 170 | 0 | — | 0 | — | ||
| Pars opercularis | 10 | 8 (80) | 3 (38) | 140 | 0 | — | 0 | — |
| 9 (90) | 5 (55) | 170 | 0 | — | 0 | — | ||
| Pars triangularis | 12 | 6 (50) | 3 (50) | 85 | 0 | — | 0 | — |
| 9 (75) | 1 (11) | 107 | 1 (100) | 385 | 1 (100) | 275 | ||
| Superior frontal | 23 | 13 (57) | 3 (23) | 198 | 0 | — | 0 | — |
| 17 (74) | 5 (29) | 217 | 1 (20) | 255 | 1 (20) | 245 | ||
| Total | 424 | 260 (61) | 99 (38) | 17 (17) | 1 (1) | |||
| 316 (74) | 140 (44) | 25 (18) | 26 (19) | |||||
| 11 overlap |
Value are given as number (%), unless otherwise stated. Numbers in bold indicate values for HGP responses, and numbers in italics indicate values for the aLFP waveforms. Cortical regions are defined by an automated cortical parcellation method (Desikan et al., 2006) from FreeSurfer software.
Unisensory responses in post-central gyrus
The earliest tactile responses were observed in the post-central gyrus starting at 22 ms in electrodes with a primary sensory somatotopic response profile (Fig. 6). These sites responded exclusively to tactile input and showed a strong spatial selectivity differentiating between stimulation of the thumb and index finger. In the aLFP, seven electrodes (20%) met the PMC, and in the HGP seven electrodes (20%) met the PMC. Of that subset of PMC electrodes, three electrodes (17% of PMC) survived the additional NCC criterion in aLFP and were subadditive, with a mean onset latency of 327 ms. Only one electrode survived the NCC criterion in HGP, with a subadditive onset of 280 ms. In conclusion, while some electrodes did satisfy both criteria, there were no observed multisensory effects before 280 ms in post-central gyrus.
Unisensory responses in lateral occipital cortex
The earliest visual responses were observed in the lateral occipital cortex starting at 62 ms in electrodes with a primary sensory retinotopic response profile. These sites responded only to visual input and showed spatial selectivity for visual stimuli presented at the thumb versus index finger. Of the 29 electrodes in the lateral occipital cortex, 12 (48%) in HGP and 8 (32%) in aLFP showed an effect in PMC, but none of these were validated through the NCC. The mean onset of these PMC effects was 317 ms (SEM, 39 ms) in aLFP and 177 ms (SEM, 31 ms) in the HGP. Thus, no evidence for multisensory integration was found in the lateral occipital cortex.
Integration responses in supramarginal gyrus
Electrodes over supramarginal gyrus responded strongly to unisensory input from both modalities, with different latencies for each input stream in the aLFP (mean V, 95 ± 35 ms; mean T, 40 ± 15 ms; t = 7, p = 0.013), but not in the HGP. The fastest responses in SMG were observed in response to VT with a mean aLFP onset latency of 34 ms and a mean HGP latency of 96 ms, followed by T (LFP onset, 40 ms; HGP onset, 137 ms) and V (LFP onset, 95 ms; mean peak, 150 ms). This area was also highly integrative, with 61% of sites showing significant multisensory integrative responses (in both PMC and NCC) occurring as early as 157 ms. All integration responses were suppressive in that they showed subadditive responses in HGP (Fig. 8).
Figure 8.
Representative supramarginal recording site. Subadditive (yellow shading, VT < V + T and VTc + VTi < V + T; p < 0.01 corrected) and superadditive (green shading, VT > V + T and VTc + VTi > V + T; p < 0.01 corrected) components are observed in the aLFPs, while HGP responses to bimodal stimuli are subadditive.
Integration responses in rostral middle frontal cortex
Of the 23 recordings sites, 13 showed an HGP response to the stimuli; 4 of these sites showed putative multisensory responses, with 2 being confirmed with NCC, and both were subadditive. In the aLFP responses, 13 sites were active from baseline, and while two satisfied the PMC, none satisfied the NCC. A representative rostral middle-frontal cortical electrode that showed an effect for multisensory integration is shown in Figure 9. Both multisensory electrodes in this region showed suppression of high-gamma band power in the VT response compared with T response at a mean onset of 280 ms.
Figure 9.
Representative rostral middle frontal recording site. No subadditive or superadditive components are observed in the aLFPs, while HGP responses to bimodal stimuli are subadditive (VT < V + T and VTc + VTi < V + T; p < 0.01 corrected) beginning at 280 ms.
Timing of integration responses
Multisensory integration sites in SMG showed differential latencies of the integration effect for aLFP and HGP (t(7) = 4.23, p < 0.01), with earlier effects seen in the aLFP (mean, 165 ms; SD, 61 ms), and later effects in the high gamma band (mean, 234 ms; SD, 54 ms). This trend can be observed in Figure 10, where the latencies for each of the sites where both aLFP and HGP showed multisensory integration are highlighted.
Habituation of responses
To examine whether habituation could have played a role in the integrative responses, we tested for integrative multisensory responses separately in the first half versus the second half of all trials. As is shown in Figure 11, the integrative response in the SMG contact was comparable in the early and late trials (i.e., no effect of habituation could be observed). The integrative response in the MFG contact for all trials had a latency of ∼220 ms in LFP and ∼400 s in HGP. The only part of these effects that was maintained was the HGP for the late trials. However, the integrative responses were weak even when all trials were considered, and the lack of responses in the split halves were likely due to low signal-to-noise ratio. Only two of the locations showing integrative multisensory responses also showed habituation. One such contact was in SMG, and the other was in MFG. To examine whether habituation could have played a role in the integrative responses at these contacts, we tested for integrative multisensory responses separately in the first half versus the second half of all trials. As is shown in Figure 11, the integrative response at the SMG contact was comparable in the early and late trials (i.e., no effect of habituation could be observed).
Figure 11.
Analysis of habituation effects. Same electrode as shown in Figure 8. a, d, aLFPs and HGP, respectively, are plotted for unimodal T (orange), unimodal visual (blue), bimodal (magenta), and all conditions (black). The dashed red vertical line marks the peak of the aLFP across all conditions. b, e, Plotted in each of the three plots is the mean of a 10 ms window centered on the peak from a for each trial in the corresponding condition. The slope of the line from a robust regression is shown, as well as the Pearson's correlation of trial number and peak amplitude. c, f, Data were split in half, based on trial number, and reanalyzed to determine whether the habituation effect could have been a factor in the analysis, and whether the effect changed over time. In both splits, the significant effects remained.
Discussion
We found that multisensory integration of visual and tactile stimuli occurred at moderately long latencies in association cortical areas in the parietal and frontal lobes, but not at short latencies in visual or tactile sensory cortices. Our use of subdural electrophysiological measures during a visuo-tactile detection task and analysis metrics ensured high temporal and spatial resolution while controlling for artifactual effects from nonspecific summation. Although multisensory responses, as measured by aLFPs and HGP, coincided spatially, they differed in their exact spatial distribution, timing, and direction of modulation, suggesting that they perform different computations.
We did not observe any integrative effects from bimodal visuo-tactile stimuli in lower levels, traditionally unisensory cortices, despite prior evidence of anatomical connections in primates (Falchier et al., 2002; Rockland and Ojima, 2003; Cappe and Barone, 2005) as well as apparent multimodal interactions in human neuroimaging studies in other sensory modality combination (for review, see Driver and Noesselt, 2008). In humans, cross-modal hemodynamic responses were reported in primary sensory cortices (Calvert et al., 2001; Sathian, 2005), but recent studies failed to replicate these findings (Beauchamp, 2005; Laurienti et al., 2005). Previous MEG and scalp EEG studies also found early multisensory responses (Giard and Peronnet, 1999; Molholm et al., 2002), but the majority of these failed to control for nonspecific effects (Foxe et al., 2000; Teder-Sälejärvi et al., 2002). The few studies that avoided this confound (Busse et al., 2005; Talsma and Woldorff, 2005) showed that multisensory effects did not occur until relatively long latencies, ∼180 ms after stimulus onset. Teder-Sälejärvi et al. (2002) have explicitly tested the possibility that early expectancy effects may be misinterpreted as integration responses and demonstrated that the presence of a CNV (indexing expectation) could indeed lead to spurious “multisensory effects” on early ERP components. The present analysis controls for this and other potential nonspecific effects (which are very common in ERP literature). In general though, intracranial EEG, and especially at HGP, is less prone to such spurious effects than scalp EEG because of much more localized responses and the fact that intracranial EEG is less influenced by volume conduction, and thus the mingling of signals from functionally different brain areas (e.g., where “expectancy” responses are generated) is greatly reduced.
While our results, based on high trial counts and stringent integration criteria, did not show early effects in sensory cortices, it is not possible to rule out the existence of such effects. First, our measures, all at the population level, may lack sufficient resolution to observe effects that occur in a small proportion of cells within a population, an effort that may require single-unit recordings. However, note that this is even more applicable to MEG and scalp EEG studies. It is also possible that multisensory effects in retinotopic or somatotopic cortices are localized to particular specialized areas, which were not sampled in this study, such as the deep folds of the calcarine and central gyri. In addition, the stimuli were very simple and the task was easy to perform, which may explain why no early integration responses were observed.
Electrodes in the supramarginal gyrus showed strong multisensory effects in both the aLFP and HGP. However, these effects occurred at different time periods during stimulus processing, suggesting that evoked potentials represent two distinct processing operations underlying visual–tactile integration. The supramarginal gyrus receives input from the pulvinar nucleus of the thalamus, which synapses in layer 1, with broad tangential spread. The above analysis suggests that the consequent broad synchronous activity network may be responsible for the multisensory aLFP effects observed in the SMG. Further, the pulvinar nuclei are thought to be involved in visual salience, and the most rostral nucleus, the oral pulvinar, is heavily connected with somatosensory and parietal areas (Grieve et al., 2000).
We observed visuo-tactile integration responses in the middle frontal gyrus, around Brodmann areas 9 and 46 of the dorsolateral prefrontal cortex (DLPFC), generally at a longer latency than in the SMG. Indeed, the DLPFC and SMG form an integrated system with multiple reciprocal anatomical connections (Goldman-Rakic, 1988). Like SMG, DLPFC receives input from second-order association areas in the visual, tactile, and auditory areas (Mesulam, 1998). Our findings are consistent with PET-measured regional cerebral blood flow increases during visual–tactile matching compared with a unimodal visual matching task (Banati et al., 2000). This area matches a region identified in an fMRI adaptation experiment of the visuo-tactile object-related network (Tal and Amedi, 2009). It contains a map of mnemonic space (Funahashi et al., 1989), with neurons sensitive to a particular region of space in a working memory task. Thus, the current results are consistent with models wherein the SMG and DLPFC work together to construct representations of space using information from multiple sensory modalities.
A striking important characteristic of the current results is that multisensory integration invariably resulted in subadditive responses in HGP, which indicates decreased neural activity during sensory integration. This implies that sensory integration, at least under the present circumstances, proceeds mainly through local neuronal inhibition. In contrast, multisensory effects could either augment or diminish aLFPs, but, as we note above, this does not have any simple implications for the level of underlying neuronal firing or excitatory synaptic activity. Previous studies in animals have generally found that superadditivity is restricted to a narrow range of weak stimuli, whereas clearly supraliminal stimuli, as in our study, produce either additive (Stanford et al., 2005) or subadditive (Perrault et al., 2005) responses. Our findings of subadditivity are also consistent with the usual response of the somatosensory system to multiple inputs, especially when stimuli are well above the detection threshold. For example, the evoked potential amplitude from stimulation of multiple digits is lower than the sum of potentials evoked by the stimulation of each digit separately (Gandevia et al., 1983). A recent investigation of neural responses in auditory cortex demonstrated that weak auditory responses were enhanced by a visual stimulus, whereas strong auditory responses were reduced (Kayser et al., 2010). While we did not find any multisensory effects in early sensory areas, our results suggest that inhibitory activity in SMG and DLPFC plays a crucial role in synthesizing visual and tactile inputs. HGP (70–109 Hz) has only been reliably recorded intracranially, and its close relation to multiunit activity makes it a very valuable measure from which to make inferences about the firing of local neuronal populations. Indeed, multisensory depression in aggregate neuronal firing would be predicted based single-unit findings showing that visual–tactile integration neurons within a given area show heterogeneous integration responses where subadditive neurons are more frequent in number compared with superadditive neurons (Avillac et al., 2007).
The localization of unambiguous multisensory responses to tertiary parietal and prefrontal association areas, as well as their long latencies, is consistent with such responses, reflecting higher-order processes that require the convergence of visual and tactile information. Indeed, the supramarginal region has previously been shown to be concerned with body image and agency (Blanke et al., 2005). This area, at the temporal–parietal–occipital junction, receives inputs from the visual, somatosensory, and auditory modalities (Jones and Powell, 1970). It is located close to the superior temporal and intraparietal sulci, both of which have previously been described as multisensory (Duhamel et al., 1998). Lesions of this area can produce hemi-neglect for stimuli in multiple modalities (Sarri et al., 2006), while electrical stimulation of this area can elicit out-of-body experiences (Blanke et al., 2002). The timing of the integration effects in supramarginal gyrus confirms earlier scalp EEG research (Schürmann et al., 2002), which showed maximal effects between bimodal and summed unimodal responses at 225–275 ms. Finally, the SMG is hemodynamically activated by hand actions directed toward goals in perihand space (Brozzoli et al., 2011), further supporting a role for this area in the integration of visual stimuli with and somatic signals from the hand.
Together, the spatiotemporal profile of visual–tactile stimuli activity in the current study was supportive of the late-integration model of multisensory processing (Fig. 1a). This model postulates initial unisensory processing in low-level sensory areas before convergence processes occurring in higher association areas. The current results further support prior findings in nonhuman primates that binding of visual–tactile input occurs largely through subadditive nonlinear mechanisms evidencing neuronal inhibition in parietal and prefrontal association areas.
Footnotes
This research was supported by grants from National Institutes of Health (Grant NS18741) and Finding a Cure for Epilepsy & Seizures (FACES). We thank Mark Blumberg and Amy Trongnetrpunya for help with data collection.
The authors declare no financial conflicts of interest.
References
- Avillac M, Ben Hamed S, Duhamel JR. Multisensory integration in the ventral intraparietal area of the macaque monkey. J Neurosci. 2007;27:1922–1932. doi: 10.1523/JNEUROSCI.2646-06.2007. [DOI] [PMC free article] [PubMed] [Google Scholar]
- Banati RB, Goerres GW, Tjoa C, Aggleton JP, Grasby P. The functional anatomy of visual-tactile integration in man: a study using positron emission tomography. Neuropsychologia. 2000;38:115–124. doi: 10.1016/S0028-3932(99)00074-3. [DOI] [PubMed] [Google Scholar]
- Baudena P, Halgren E, Heit G, Clarke JM. Intracerebral potentials to rare target and distractor auditory and visual stimuli. III. Frontal cortex. Electroencephalogr Clin Neurophysiol. 1995;94:251–264. doi: 10.1016/0013-4694(95)98476-O. [DOI] [PubMed] [Google Scholar]
- Bauer M, Oostenveld R, Fries P. Tactile stimulation accelerates behavioral responses to visual stimuli through enhancement of occipital gamma-band activity. Vision Res. 2009;49:931–942. doi: 10.1016/j.visres.2009.03.014. [DOI] [PubMed] [Google Scholar]
- Beauchamp MS. Statistical criteria in FMRI studies of multisensory integration. Neuroinformatics. 2005;3:93–113. doi: 10.1385/NI:3:2:093. [DOI] [PMC free article] [PubMed] [Google Scholar]
- Bell AJ, Sejnowski TJ. An information-maximization approach to blind separation and blind deconvolution. Neural Comput. 1995;7:1129–1159. doi: 10.1162/neco.1995.7.6.1129. [DOI] [PubMed] [Google Scholar]
- Blanke O, Ortigue S, Landis T, Seeck M. Stimulating illusory own-body perceptions. Nature. 2002;419:269–270. doi: 10.1038/419269a. [DOI] [PubMed] [Google Scholar]
- Blanke O, Mohr C, Michel CM, Pascual-Leone A, Brugger P, Seeck M, Landis T, Thut G. Linking out-of-body experience and self processing to mental own-body imagery at the temporoparietal junction. J Neurosci. 2005;25:550–557. doi: 10.1523/JNEUROSCI.2612-04.2005. [DOI] [PMC free article] [PubMed] [Google Scholar]
- Bremmer F, Schlack A, Shah NJ, Zafiris O, Kubischik M, Hoffmann K, Zilles K, Fink GR. Polymodal motion processing in posterior parietal and premotor cortex: a human fMRI study strongly implies equivalencies between humans and monkeys. Neuron. 2001;29:287–296. doi: 10.1016/S0896-6273(01)00198-2. [DOI] [PubMed] [Google Scholar]
- Brozzoli C, Gentile G, Petkova VI, Ehrsson HH. fMRI adaptation reveals a cortical mechanism for the coding of space near the hand. J Neurosci. 2011;31:9023–9031. doi: 10.1523/JNEUROSCI.1172-11.2011. [DOI] [PMC free article] [PubMed] [Google Scholar]
- Busse L, Roberts KC, Crist RE, Weissman DH, Woldorff MG. The spread of attention across modalities and space in a multisensory object. Proc Natl Acad Sci U S A. 2005;102:18751–18756. doi: 10.1073/pnas.0507704102. [DOI] [PMC free article] [PubMed] [Google Scholar]
- Calvert GA, Thesen T. Multisensory integration: methodological approaches and emerging principles in the human brain. J Physiol Paris. 2004;98:191–205. doi: 10.1016/j.jphysparis.2004.03.018. [DOI] [PubMed] [Google Scholar]
- Calvert GA, Hansen PC, Iversen SD, Brammer MJ. Detection of audio-visual integration sites in humans by application of electrophysiological criteria to the BOLD effect. Neuroimage. 2001;14:427–438. doi: 10.1006/nimg.2001.0812. [DOI] [PubMed] [Google Scholar]
- Cappe C, Barone P. Heteromodal connections supporting multisensory integration at low levels of cortical processing in the monkey. Eur J Neurosci. 2005;22:2886–2902. doi: 10.1111/j.1460-9568.2005.04462.x. [DOI] [PubMed] [Google Scholar]
- Cardini F, Costantini M, Galati G, Romani GL, Làdavas E, Serino A. Viewing one's own face being touched modulates tactile perception: an fMRI study. J Cogn Neurosci. 2011a;23:503–513. doi: 10.1162/jocn.2010.21484. [DOI] [PubMed] [Google Scholar]
- Cardini F, Longo MR, Haggard P. Vision of the body modulates somatosensory intracortical inhibition. Cereb Cortex. 2011b;21:2014–2022. doi: 10.1093/cercor/bhq267. [DOI] [PubMed] [Google Scholar]
- Desikan RS, Ségonne F, Fischl B, Quinn BT, Dickerson BC, Blacker D, Buckner RL, Dale AM, Maguire RP, Hyman BT, Albert MS, Killiany RJ. An automated labeling system for subdividing the human cerebral cortex on MRI scans into gyral based regions of interest. Neuroimage. 2006;31:968–980. doi: 10.1016/j.neuroimage.2006.01.021. [DOI] [PubMed] [Google Scholar]
- Driver J, Noesselt T. Multisensory interplay reveals crossmodal influences on “sensory-specific” brain regions, neural responses, and judgments. Neuron. 2008;57:11–23. doi: 10.1016/j.neuron.2007.12.013. [DOI] [PMC free article] [PubMed] [Google Scholar]
- Duhamel JR, Colby CL, Goldberg ME. Ventral intraparietal area of the macaque: congruent visual and somatic response properties. J Neurophysiol. 1998;79:126–136. doi: 10.1152/jn.1998.79.1.126. [DOI] [PubMed] [Google Scholar]
- Falchier A, Clavagnier S, Barone P, Kennedy H. Anatomical evidence of multimodal integration in primate striate cortex. J Neurosci. 2002;22:5749–5759. doi: 10.1523/JNEUROSCI.22-13-05749.2002. [DOI] [PMC free article] [PubMed] [Google Scholar]
- Fischl B, Sereno MI, Tootell RB, Dale AM. High-resolution intersubject averaging and a coordinate system for the cortical surface. Hum Brain Mapp. 1999;8:272–284. doi: 10.1002/(SICI)1097-0193(1999)8:4<272::AID-HBM10>3.0.CO%3B2-4. [DOI] [PMC free article] [PubMed] [Google Scholar]
- Foxe JJ, Schroeder CE. The case for feedforward multisensory convergence during early cortical processing. Neuroreport. 2005;16:419–423. doi: 10.1097/00001756-200504040-00001. [DOI] [PubMed] [Google Scholar]
- Foxe JJ, Morocz IA, Murray MM, Higgins BA, Javitt DC, Schroeder CE. Multisensory auditory-somatosensory interactions in early cortical processing revealed by high-density electrical mapping. Brain Res Cogn Brain Res. 2000;10:77–83. doi: 10.1016/S0926-6410(00)00024-0. [DOI] [PubMed] [Google Scholar]
- Funahashi S, Bruce CJ, Goldman-Rakic PS. Mnemonic coding of visual space in the monkey's dorsolateral prefrontal cortex. J Neurophysiol. 1989;61:331–349. doi: 10.1152/jn.1989.61.2.331. [DOI] [PubMed] [Google Scholar]
- Gandevia SC, Burke D, McKeon BB. Convergence in the somatosensory pathway between cutaneous afferents from the index and middle fingers in man. Exp Brain Res. 1983;50:415–425. doi: 10.1007/BF00239208. [DOI] [PubMed] [Google Scholar]
- Gentile G, Petkova VI, Ehrsson HH. Integration of visual and tactile signals from the hand in the human brain: an FMRI study. J Neurophysiol. 2011;105:910–922. doi: 10.1152/jn.00840.2010. [DOI] [PMC free article] [PubMed] [Google Scholar]
- Giard MH, Peronnet F. Auditory-visual integration during multimodal object recognition in humans: a behavioral and electrophysiological study. J Cogn Neurosci. 1999;11:473–490. doi: 10.1162/089892999563544. [DOI] [PubMed] [Google Scholar]
- Goldman-Rakic PS. Topography of cognition: parallel distributed networks in primate association cortex. Annu Rev Neurosci. 1988;11:137–156. doi: 10.1146/annurev.ne.11.030188.001033. [DOI] [PubMed] [Google Scholar]
- Grieve KL, Acuña C, Cudeiro J. The primate pulvinar nuclei: vision and action. Trends Neurosci. 2000;23:35–39. doi: 10.1016/S0166-2236(99)01482-4. [DOI] [PubMed] [Google Scholar]
- Halgren E, Baudena P, Clarke JM, Heit G, Liégeois C, Chauvel P, Musolino A. Intracerebral potentials to rare target and distractor auditory and visual stimuli. I. Superior temporal plane and parietal lobe. Electroencephalogr Clin Neurophysiol. 1995a;94:191–220. doi: 10.1016/0013-4694(94)00259-N. [DOI] [PubMed] [Google Scholar]
- Halgren E, Baudena P, Clarke JM, Heit G, Marinkovic K, Devaux B, Vignal JP, Biraben A. Intracerebral potentials to rare target and distractor auditory and visual stimuli. II. Medial, lateral and posterior temporal lobe. Electroencephalogr Clin Neurophysiol. 1995b;94:229–250. doi: 10.1016/0013-4694(95)98475-N. [DOI] [PubMed] [Google Scholar]
- Jones EG, Powell TP. An anatomical study of converging sensory pathways within the cerebral cortex of the monkey. Brain. 1970;93:793–820. doi: 10.1093/brain/93.4.793. [DOI] [PubMed] [Google Scholar]
- Kayser C, Logothetis NK. Do early sensory cortices integrate cross-modal information? Brain Struct Funct. 2007;212:121–132. doi: 10.1007/s00429-007-0154-0. [DOI] [PubMed] [Google Scholar]
- Kayser C, Logothetis NK, Panzeri S. Visual enhancement of the information representation in auditory cortex. Curr Biol. 2010;20:19–24. doi: 10.1016/j.cub.2009.10.068. [DOI] [PubMed] [Google Scholar]
- Kida T, Inui K, Wasaka T, Akatsuka K, Tanaka E, Kakigi R. Time-varying cortical activations related to visual-tactile cross-modal links in spatial selective attention. J Neurophysiol. 2007;97:3585–3596. doi: 10.1152/jn.00007.2007. [DOI] [PubMed] [Google Scholar]
- Laurienti PJ, Perrault TJ, Stanford TR, Wallace MT, Stein BE. On the use of superadditivity as a metric for characterizing multisensory integration in functional neuroimaging studies. Exp Brain Res. 2005;166:289–297. doi: 10.1007/s00221-005-2370-2. [DOI] [PubMed] [Google Scholar]
- Macaluso E, Frith CD, Driver J. Modulation of human visual cortex by crossmodal spatial attention. Science. 2000;289:1206–1208. doi: 10.1126/science.289.5482.1206. [DOI] [PubMed] [Google Scholar]
- Manning JR, Jacobs J, Fried I, Kahana MJ. Broadband shifts in local field potential power spectra are correlated with single-neuron spiking in humans. J Neurosci. 2009;29:13613–13620. doi: 10.1523/JNEUROSCI.2041-09.2009. [DOI] [PMC free article] [PubMed] [Google Scholar]
- Maris E, Oostenveld R. Nonparametric statistical testing of EEG- and MEG-data. J Neurosci Methods. 2007;164:177–190. doi: 10.1016/j.jneumeth.2007.03.024. [DOI] [PubMed] [Google Scholar]
- Mesulam MM. From sensation to cognition. Brain. 1998;121:1013–1052. doi: 10.1093/brain/121.6.1013. [DOI] [PubMed] [Google Scholar]
- Miller KJ. Broadband spectral change: evidence for a macroscale correlate of population firing rate? J Neurosci. 2010;30:6477–6479. doi: 10.1523/JNEUROSCI.6401-09.2010. [DOI] [PMC free article] [PubMed] [Google Scholar]
- Miller KJ, Zanos S, Fetz EE, den Nijs M, Ojemann JG. Decoupling the cortical power spectrum reveals real-time representation of individual finger movements in humans. J Neurosci. 2009;29:3132–3137. doi: 10.1523/JNEUROSCI.5506-08.2009. [DOI] [PMC free article] [PubMed] [Google Scholar]
- Molholm S, Ritter W, Murray MM, Javitt DC, Schroeder CE, Foxe JJ. Multisensory auditory-visual interactions during early sensory processing in humans: a high-density electrical mapping study. Brain Res Cogn Brain Res. 2002;14:115–128. doi: 10.1016/S0926-6410(02)00066-6. [DOI] [PubMed] [Google Scholar]
- Perrault TJ, Jr, Vaughan JW, Stein BE, Wallace MT. Superior colliculus neurons use distinct operational modes in the integration of multisensory stimuli. J Neurophysiol. 2005;93:2575–2586. doi: 10.1152/jn.00926.2004. [DOI] [PubMed] [Google Scholar]
- Ray S, Maunsell JH. Different origins of gamma rhythm and high-gamma activity in macaque visual cortex. PLoS Biol. 2011;9:e1000610. doi: 10.1371/journal.pbio.1000610. [DOI] [PMC free article] [PubMed] [Google Scholar]
- Rizzolatti G, Scandolara C, Matelli M, Gentilucci M. Afferent properties of periarcuate neurons in macaque monkeys. II. Visual responses. Behav Brain Res. 1981;2:147–163. doi: 10.1016/0166-4328(81)90053-X. [DOI] [PubMed] [Google Scholar]
- Rockland KS, Ojima H. Multisensory convergence in calcarine visual areas in macaque monkey. Int J Psychophysiol. 2003;50:19–26. doi: 10.1016/S0167-8760(03)00121-1. [DOI] [PubMed] [Google Scholar]
- Sarri M, Blankenburg F, Driver J. Neural correlates of crossmodal visual-tactile extinction and of tactile awareness revealed by fMRI in a right-hemisphere stroke patient. Neuropsychologia. 2006;44:2398–2410. doi: 10.1016/j.neuropsychologia.2006.04.032. [DOI] [PubMed] [Google Scholar]
- Sathian K. Visual cortical activity during tactile perception in the sighted and the visually deprived. Dev Psychobiol. 2005;46:279–286. doi: 10.1002/dev.20056. [DOI] [PubMed] [Google Scholar]
- Schürmann M, Kolev V, Menzel K, Yordanova J. Spatial coincidence modulates interaction between visual and somatosensory evoked potentials. Neuroreport. 2002;13:779–783. doi: 10.1097/00001756-200205070-00009. [DOI] [PubMed] [Google Scholar]
- Sokolov EN. Higher nervous functions; the orienting reflex. Annu Rev Physiol. 1963;25:545–580. doi: 10.1146/annurev.ph.25.030163.002553. [DOI] [PubMed] [Google Scholar]
- Stanford TR, Quessy S, Stein BE. Evaluating the operations underlying multisensory integration in the cat superior colliculus. J Neurosci. 2005;25:6499–6508. doi: 10.1523/JNEUROSCI.5095-04.2005. [DOI] [PMC free article] [PubMed] [Google Scholar]
- Stein BE, Meredith MA, Wallace MT. The visually responsive neuron and beyond: multisensory integration in cat and monkey. Prog Brain Res. 1993;95:79–90. doi: 10.1016/S0079-6123(08)60359-3. [DOI] [PubMed] [Google Scholar]
- Stein BE, Stanford TR, Ramachandran R, Perrault TJ, Jr, Rowland BA. Challenges in quantifying multisensory integration: alternative criteria, models, and inverse effectiveness. Exp Brain Res. 2009;198:113–126. doi: 10.1007/s00221-009-1880-8. [DOI] [PMC free article] [PubMed] [Google Scholar]
- Tal N, Amedi A. Multisensory visual-tactile object related network in humans: insights gained using a novel crossmodal adaptation approach. Exp Brain Res. 2009;198:165–182. doi: 10.1007/s00221-009-1949-4. [DOI] [PMC free article] [PubMed] [Google Scholar]
- Talsma D, Woldorff MG. Selective attention and multisensory integration: multiple phases of effects on the evoked brain activity. J Cogn Neurosci. 2005;17:1098–1114. doi: 10.1162/0898929054475172. [DOI] [PubMed] [Google Scholar]
- Teder-Sälejärvi WA, McDonald JJ, Di Russo F, Hillyard SA. An analysis of audio-visual crossmodal integration by means of event-related potential (ERP) recordings. Brain Res Cogn Brain Res. 2002;14:106–114. doi: 10.1016/S0926-6410(02)00065-4. [DOI] [PubMed] [Google Scholar]
- Welch RB, Warren DH. Intersensory interactions. In: Boff KR, Kaufman L, Thomas JP, editors. Handbook of perception and human performance. New York: Wiley-Interscience; 1986. pp. 25-1–25-36. [Google Scholar]
- Yang AI, Wang X, Doyle WK, Halgren E, Carlson C, Belcher TL, Cash SS, Devinsky O, Thesen T. Localization of dense intracranial electrode arrays using magnetic resonance imaging. Neuroimage. 2012;63:157–165. doi: 10.1016/j.neuroimage.2012.06.039. [DOI] [PMC free article] [PubMed] [Google Scholar]


