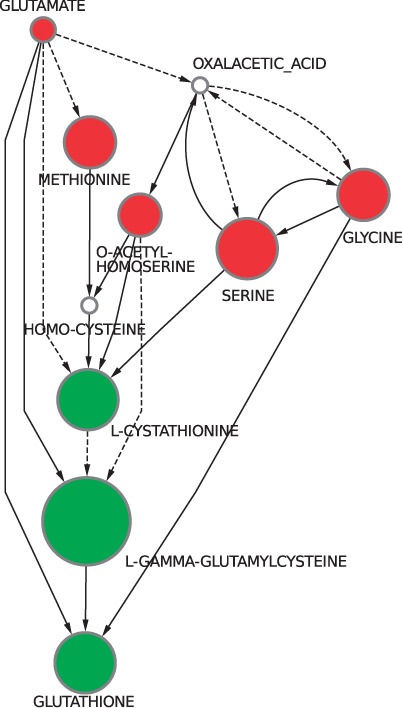
Fig. 4.

The anthology combining the six maximal stories obtained with the enzyme-activation-first score function. Notice that the anthology preserves the flow of matter observed in the pathway known to be involved in cadmium detoxification by the yeast. Once more, green nodes are the ones whose concentration significantly increased in the presence of cadmium, whereas the red are the ones whose concentration significantly decreased. The diameter of the nodes is proportional to the magnitude of the concentration change as measured by the intensity ratio of the compound. Solid arcs represent single reactions connecting the two compounds, whereas dashed ones correspond to a chain of at least two reactions
