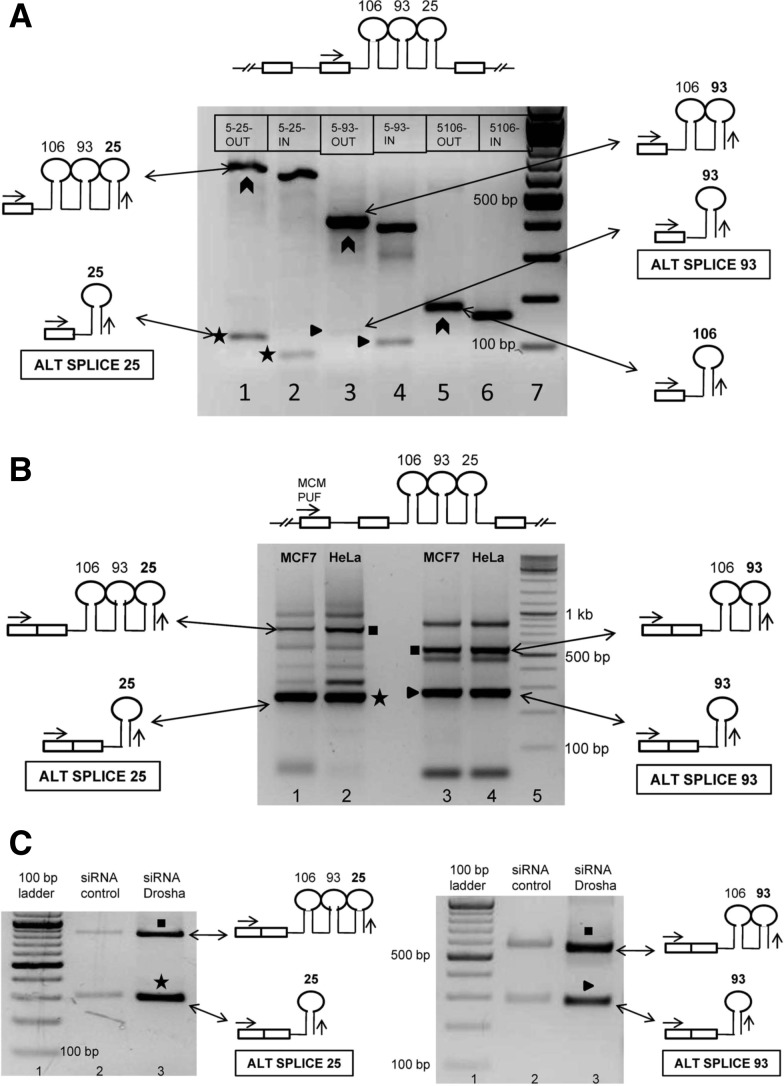
FIGURE 3.
Identification of novel alternatively spliced pri-miRNAs encoding intronic miRNAs. (A) Identification of novel alternatively spliced transcripts corresponding to intronic miRNAs 106b–93–25. RT-PCR performed with oligo dT primed MCF7 cDNA as template. The common forward primer (MCM EXON FWD) is represented by the arrow in the schematic shown above the gel image. Lane 1 represents the PCR performed with 5-25-OUT as reverse primer, while lane 2 represents the PCR performed with 5-25-IN as reverse primer (refer to Supplemental Fig. 2E for primer design). Lanes 3 and 4 correspond to PCRs performed with 5′ RACE OUT and IN primers of miR 93, while lanes 5 and 6 correspond to miR 106b 5′ RACE OUT and IN primers. Boxes within the gel image represent the reverse primers used in the PCR. The chevrons represent the amplicons corresponding to the host gene hnRNA. The stars (*) represent the alternatively spliced transcript ALT SPLICE 25, while triangles (▸) represent ALT SPLICE 93. (B) Confirmation of inclusion of upstream MCM7 exon in the novel alternatively spliced transcripts. Forward primer (MCM PUF) is common to all the PCRs. (Lanes 1,2) PCRs performed with 5-25 OUT as reverse primer using oligo dT primed cDNA of MCF7 and HeLa. (Lanes 3,4) PCRs performed with 5-93 OUT as reverse primer. Star (*) represents ALT SPLICE 25. The schematic representation shows inclusion of the upstream exon of its host gene. The triangle (▸) represents ALT SPLICE 93. The squares (▪) represent amplicons corresponding to the partially spliced host gene mRNA. The other bands could not be sequenced and probably represent nonspecific amplicons and primer dimers. The sequences of the ALT SPLICE 25 and ALT SPLICE 93 are shown in Supplemental Figure 3B,C. (C) Confirmation of novel transcripts ALT SPLICE 25 and ALT SPLICE 93 as pri-miRNAs. RT-PCR was performed as shown in B. The agarose gel electrophoresis images show accumulation of the novel transcripts ALT SPLICE 25 (marked by a star, *) and ALT SPLICE 93 (marked by a triangle, ▸) upon Drosha knockdown in MCF7 cells. The figure also shows accumulation of partially spliced host gene mRNA (marked by squares, ▪) upon Drosha knockdown. PPIA was used as loading control (shown in Fig. 2C).

