

Abstract
Green fluorescent protein (GFP) is the most commonly used reporter of expression in cell biology despite evidence that it affects the cell physiology. The molecular mechanism of GFP-associated modifications has been largely unexplored. In this paper we investigated the proteome modifications following stable expression of GFP in breast cancer cells (MDA-MB-231). A combination of three different proteome analysis methods (2-DE, iTRAQ, label-free) was used to maximise proteome coverage. We found that GFP expression induces changes in expression of proteins that are associated with protein folding, cytoskeletal organisation and cellular immune response. In view of these findings, the use of GFP as a cell reporter should be carefully monitored.
Keywords: GFP expression, Proteomic change, Unfolded protein response, Cytoskeleton modifications, Cellular immune response
Introduction
Green fluorescent protein (GFP) is responsible for the green bioluminescence of the jellyfish Aequorea victoria. This single-chain 238 amino acid polypeptide emits green fluorescence under 488 nm light. Because of this property GFP has been increasingly used to facilitate experiments in cell biology. It is commonly used as a reporter gene or a fusion tag with a particular protein (for review, see [1]). However, a number of cellular side effects resulting from GFP expression have been reported. For example, apoptosis has been reported in several cell lines when stable expression of GFP was attempted [2]. In muscle cells, overexpression of GFP has been linked to impairment of contraction in experimental models both in vitro and in vivo [3-6]. In neurons, expression of fluorescent proteins (eGFP and YFP) appears to alter cellular mechanisms and molecular characteristics [7,8].
In light of these findings, it is surprising that relatively few studies report on the molecular consequences of GFP expression. In endothelial cells, GFP has been shown to induce a marked increase of HSP70 at both mRNA and protein levels in a dose dependent manner. This upregulation leads to an increased expression of cyclooxygenase-2 (COX-2) followed by increased prostaglandin E2 (PGE2) production [9]. In 2006, Baens et al. [10] reported a defect in polyubiquitination, a post-translational modification that affects a wide range of cellular processes. Finally, in an attempt to provide a more comprehensive view of the influence of GFP expression in cardiac myocytes, Badrian and Bogoyevitch [11], conducted a DNA microarray analysis which revealed changes in the expression of 212 genes and therefore suggested caution in the interpretation of experimental results where GFP-expressing cells are used as controls. In this study, we used a breast cancer cell line as a model system to analyse proteome changes associated with stable GFP expression.
Materials and methods
Cell culture
Parental MDA-MB-231 breast cancer cells (referred to as wild-type (WT) cells form hereon) were cultured in DMEM supplemented with 10% fetal bovine serum, sodium pyruvate and antibiotics at 37 °C and 5% CO2. Stable MDA-MB-231 clones expressing GFP were generated using the plasmid pEGFP-C3 and the X-tremeGENE HP DNA transfection reagent (Roche Applied Science, Australia) according to the manufacturer’s instructions. Selection of the stable clones (expression of GFP was confirmed by fluorescence microscopy) and subsequent subcultures of one stable clone (used in the following experiments) were performed in the above conditions and with regular growth media supplemented with 1 mg mL−1 G418.
Protein extraction and quantification
For protein extraction, cells grown to 90% confluence in 175 cm2 culture flasks were washed twice with PBS and detached from the flask by 5 min incubation at 37 °C in citric saline solution (1.35 M KCl, 0.15 M sodium citrate).
For protein analysis by two-dimensional electrophoresis (2-DE), cells were pelleted by centrifugation, resuspended in IEF buffer (7 M urea, 2 M thiourea, 4% (w/v) CHAPS, 0.5% IPG buffer (pH 4–7) (GE Healthcare), 1% DTT, 0.001% bromophenol blue) and proteins were extracted with glass beads using a mini bead beater (4 × 20 s interspersed with 5 min cooling on ice). Samples were then centrifuged at 15,000g (15 min, 20 °C).
For the iTRAQ and MS-label free experiments, a total cell lysate was obtained by extracting the cell pellet in 10 volumes of ice-cold RIPA Buffer (Pierce, Sydney, Australia) using the mini bead beater as described above. Samples were then centrifuged at 15,000g (1 h, 4 °C).
Total protein concentration in the supernatant was determined using the 2-D Quant kit (GE Healthcare), using BSA as the reference standard.
Two-dimensional electrophoresis, protein visualization and image analysis
2-DE was performed essentially as previously described by Coumans et al. [12]. In summary, rehydrated 18 cm IPG strips pH 4–7 (GE Healthcare) were loaded with protein (300 μg for analytical gels or 400 μg for preparative gels) and IEF was carried out on the IPGphor II (GE Healthcare Life Science) at 20 °C with a current limit of 50 μA/strip to a total volt–hour-product of 30 kVh (analytical gels) or 45 kVh (preparative gels). Second dimension separation was achieved on Protean II XL Cell (Bio-Rad) with home cast 1.5 mm SDS polyacrylamide gels (12%) at 8 mA/gel until the bromophenol blue dye front reached the anodic end of the SDS-gel. Staining of the gels was performed using colloidal Coomassie Brilliant Blue G-250 [13] for analytical study and by Coomassie blue staining (50% methanol, 0.15% Coomassie blue R-250, 0.75% acetic acid) for preparative 2-DE. Image capture was performed as previously described by Coumans et al. [14]. Three biological samples and two technical replicates were grouped and analysed with PDQuest advanced 2-D analysis software (Bio-Rad). For comparison of expression data, the Student’s t-test function in the PDQuest software was used and a p-value≤0.05 was considered to be statistically significant.
Sample preparation and iTRAQ labeling
100 μg of whole cell protein extract from either WT or GFP-expressing MDA-MB-231 cells was precipitated with 9 volumes of ice-cold acetone for 1 h at −20 °C. The protein precipitate was recovered by centrifugation, air dried (ca. 2–3 min) and dissolved in 50 mM sodium bicarbonate containing 0.1% SDS. Probe sonication was used to assist dissolution. Protein samples were then reduced using tris(2-carboxyethyl)phosphine (2.5 mM, 60 °C, 60 min) and alkylated with iodoacetamide (2 mM, 20 °C, 10 min), digested with trypsin (0.5 μg/50 μg protein) (Promega, Madison, WI) for 16 h at 37 °C and then labeled with the iTRAQ reagents according to the manufacturer’s instructions [15].
Excess unbound iTRAQ labels, trypsin, SDS and solvents were removed by strong cation exchange (ICAT SCX cartridge, ABSciex, MA), solid phase extraction (SPE) using an Applied Biosystems Opti-Lynx cartridge holder and a syringe pump (KD Scientific, Holliston, MA) at a flow rate of 9.5 mL/h. The eluted peptide solutions were vacuum-dried, and resuspended in 500 μL of 0.2% heptafluorobutyric acid (HFBA) prior to a further SPE step using reverse phase (RP) chromatography on a C18 RP peptide macrotrap cartridge (Microm Bioresources, Auburn, CA). Briefly, the macrotrap was primed with 1 mL CH3CN, then 1 mL 50% CH3CN/0.1% formic acid, and equilibrated using 1 mL of 0.2% HFBA. The resuspended peptides were loaded, the macrotrap washed with 1 mL of 0.2% HFBA and the peptides eluted with 500 μL 50% CH3CN/0.1% formic acid, followed by 200 μL neat CH3CN. The eluants were then pooled and vacuum-dried. The pellet was dissolved in 25 μL 1% formic acid, 0.05% HFBA and analysed using 2D-LC–MS/MS. All labeling experiments were run twice (2 separate injections), to provide the two technical replicates and statistical significance was determined using the Student’s t-test (Microsoft Exel).
Sample preparation for label-free LC–MS quantification
Whole cell protein extracts (100 μg) from WT and GFP-expressing MDA-MB-231 cells were treated and trypsin digested as described in the sample preparation for iTRAQ labeling.
Following trypsin digestion, the peptide samples were purified using SCX StageTips and C18 StageTips (Thermo Scientific) following the manufacturer’s instructions.
Mass spectrometry and database search
For protein identification from 2-DE, relevant protein spots from preparative gels were manually excised, destained and digested as previously described [14]. Peptides were separated using a nanoLC 1D plus system (Eksigent). Samples (2–7 μL) were concentrated and desalted on a ChromXPC18 pre-column (350 μm × 0.5 mm, Eksigent) with H2O:CH3CN (98:2, 0.1% formic acid). After a 4 min wash the pre-column was automatically switched into line with a 3C18-CL-120 nano-column (75 μm × ~15 cm), Eksigent. Peptides were eluted using a linear gradient of H2O:CH3CN (95:5, 0.1% formic acid) to H2O:CH3CN (60:40, 0.1% formic acid) at ~300 nL/min over 30 min. The pre-column was connected via a fused silica capillary (10 cm, 25 μm) to a PicoTip emitter (New Objective) where HV (2300 V) was applied and the column tip positioned ~1 cm from the Z-spray inlet of an TripleTOF 5600 mass spectrometer (ABSciex). Positive ions were generated by electrospray and the TripleTof operated in information dependent acquisition mode (IDA). A Tof MS survey scan was acquired (m/z 350–1500, 0.25 s) and the multiply charged ions (2+ to 5+) in the 400–1250 m/z range were sequentially selected by Q1 for MS–MS analysis. Nitrogen was used as collision gas and optimum collision energy was chosen (based on charge state and mass). Tandem mass spectra were accumulated for up to 0.05 s (m/z 100–1800). Peak lists were submitted to the database search program Mascot (Matrix Science). Search parameters were precursor and product ion tolerances ±100 ppm and 0.05 Da respectively; Carbamidomethyl (C) and Oxidation (M) were specified as variable modifications, enzyme specificity was trypsin, one missed cleavage was allowed and the SwissProt 2012_10 (538,259 sequences; 191,113,170 residues), taxonomy Homo sapiens searched.
For iTRAQ analysis, solubilized peptides were analysed by 2D-LC–MS/MS (LC Packings autosampler and switchos valves with Dionex Ultimate 3000 pumps, in line to a QStar Elite, ABSciex, Framingham, MA). The procedure was adapted from a previously published approach [16]. Peptides (ca. 5–10 μg total load, 10 μL) were initially captured onto a SCX micro column (0.75 × ~20 mm2, Poros S10, Applied Biosystems) and the eluant from multiple salt elution steps (5, 10, 15, 20, 25, 30, 40, 50, 100, 250, 500 and 1000 mM ammonium acetate) captured and desalted on a C18 precolumn cartridge (300 μm id × 5 mm, packed with 5 μm C18, 100 Å PepMap, Dionex, Sunnyvale, CA). After a 10 min wash the pre-column was switched (Switchos) into line with a fritless analytical column (75 μm × ~12 cm) containing C18 reverse phase packing material (Magic, 5 μ, 200 Å) [17] Peptides were eluted using a linear gradient of buffer A (0.1% formic acid) to buffer B (20:80, H2O:CH3CN containing 0.1% formic acid) at ~300 nL/min over 90 min. High voltage (2300 V) was applied through a low volume tee (Upchurch Scientific) at the column inlet and the outlet positioned ~1 cm from the orifice of a QStar Elite mass spectrometer (ABSciex, Framingham, MA). Positive ions were generated by electrospray and the QStar operated in information dependent acquisition mode (IDA). A Tof MS survey scan was acquired (m/z 350–1700, 0.75 s) and the 3 largest multiply charged ions (count > 20, charge state ≥2 and ≤4) sequentially selected by Q1 for MS–MS analysis. Nitrogen was used as collision gas and an optimum collision energy automatically chosen (based on charge state and mass). Tandem mass spectra were accumulated for up to 2.5 s (m/z 65–2000) with 2 repeats. The WIFF files were submitted to ProteinPilot v4.0 and both ipi.Human v3.58 and NCBInr_24/8/12 databases used for data processing. ProteinPilot v4 search parameters were thorough ID search effort, biological modifications focus, quantification and bias correction used for data processing; cys-carboxyamidomethylation and iTRAQ 8-plex reagents used, enzyme specificity was trypsin. A minimum protein unused score of 1.3 was accepted for all reported proteins (minimum 95% confidence in correct sequence assignment) and a p value of ≤0.05 was used as the cutoff for accepting statistically significant changes in protein expression level.
For label-free quantification, solubilised peptides were analysed using a linear ion trap-Orbitrap (LTQ-Orbitrap). Peptides were reconstituted in 10 μL of 0.1% formic acid and were separated by nano-LC using an Ultimate 3000 HPLC and autosampler (Dionex, Amsterdam, Netherlands). 0.2 μL (ca. 2 μg total load) was loaded onto a micro C18 precolumn (500 μm × 2 mm, Michrom Bioresources, Auburn, CA, USA) with Buffer C (98% H2O, 2% CH3CN, 0.1% TFA) at 10 μL min−1. After a 4-min wash the pre-column was switched (Valco 10 port valve, Dionex) into line with a fritless nano column (75 μm id × 10 cm) containing reverse phase C18 media (5 μm, 200 Å Magic, Michrom Bioresources). Peptides were eluted using a linear gradient of Buffer C (98% H2O, 0.1% TFA) to Buffer D (98% CH3CN, 2% H2O, 0.1% formic acid) at 250 nL min−1 over 60 min. High voltage (2000 V) was applied to a low volume tee (Upchurch Scientific, Oak Harbor, WA, USA) and the column tip positioned ~0.5 cm from the heated capillary (T=280 °C) of an Orbitrap Velos (Thermo Electron, Bremen, Germany) mass spectrometer. Positive ions were generated by electrospray and the Orbitrap operated in data-dependent acquisition mode. A survey scan m/z 350–1750 was acquired in the Orbitrap (Resolution=30,000 at m/z 400, with an accumulation target value of 1,000,000 ions) with lockmass enabled. Up to the 10 most abundant ions (>5000 counts) with charge states +2 to +4 were sequentially isolated and fragmented within the linear ion trap using collisionally induced dissociation with an activation q=0.25 and activation time of 30 ms at a target value of 30,000 ions. m/z ratios selected for MS/MS were dynamically excluded for 30 s.
MS peak intensities were analysed using Progenesis LC–MS data analysis software v4 (Nonlinear Dynamics, Newcastle upon Tyne, UK). Ion intensity maps from each run were aligned to a reference sample and ion feature matching was achieved by aligning consistent ion m/z and retention times. The peptide intensities were normalized against total intensity (sample specific log-scale abundance ratio scaling factor) and compared between groups by oneway analysis of variance (ANOVA, p≤0.05 for statistical significance) and post-hoc multiple comparison procedures. Type I errors were controlled for by False Discovery Rate (FDR) with q value significance set at 0.01 [18,19]. MS/MS spectra were searched against the Swiss-Prot database 24_8_12 (536,789 sequences, 190,518,892 residues) using database search program MASCOT (Matrix Science, London, UK, 〈www.matrixscience.com〉). Parent and fragment ions were searched with tolerances of ±6 ppm and ±0.6 Da, respectively. Searched peptide charge states were limited to +2 to +4. ‘No enzyme’ and H. sapiens for the taxonomy were specified. Only peptides with a high ion score >25 and above were considered for protein identification. Statistical proteome modifications between WT and GFP-expressing cells were assessed by Student’s t-test analysis (Microsoft Exel).
Data analysis
To determine the possible biological consequences following stable GFP expression in MDA cells, protein classification analysis of the down- and up-regulated proteins was performed using the PANTHER classification system (〈http://www.pantherdb.org〉) [20,21] which allows sorting of protein lists into molecular function, biological process, cellular component, protein class and pathway. Moreover, an analysis of the predicted protein–protein interactions was performed using STRINGv9.05 analysis tool (〈http://string-db.org〉) using a high confidence score (0.7) and Kmeans clustering [22].
Results
The objective of this study was to characterise the proteome changes occurring following stable expression of GFP in human breast cancer cells. Following fluorescence microscopy to confirm GFP expression (data not shown), proteins were extracted and analysed using a combination of three different proteome analysis methods (2-DE, iTRAQ, label-free).
Determination of false protein quantification rates using replicates within MDA and MDA-GFP expressing cells
Analytical variability is inherent in quantitative proteomic studies. 2-DE analysis requires a lot of manual work and expertise, and while careful optimization of sample processing reduces experimental variability and increases 2-D gel reproducibility, experimental and software-related post-experimental variability still occurs (for review, see [23]). Discovery based proteomics approaches provide a fast method of screening complex protein sample mixtures for relative expression changes. Several studies have recently reported detailed comparisons between different types of MS-based quantification approaches [24-26]. Label-free quantification provides identification and quantification of proteins with minimal manipulation and avoids the costly process of introducing stable isotopes into samples. However, because samples are prepared and measured separately, so quantification performance in terms of accuracy, precision, and reproducibility is limited [27]. The iTRAQ approach generally offers better precision but underestimation or “ratio compression” arising from contamination during precursor ion selection specific to MS/MS quantification in complex samples occurs [28]. Therefore, to reduce false positive protein identification and quantification, Wang et al. [26] have proposed a strategy to determine experimentally the arbitrary fold change cutoff to apply. We applied a similar strategy to determine the fold change cutoff to consider for the three proteomic methods that we used. Briefly, because the expected ratio for all proteins identified should be equal to 1 (between replicates and assuming equal protein loading), we calculated the ratio between our technical average for WT and GFP expressers of MDA-MB-231. We found that significant differences (p≤0.05) occur from one biological replicate to another. In 2-DE analysis, a total of 30 (5%) and 29 (5.7%) proteins for WT and GFP expressers of MDA-MB-231 respectively showed a significant change. Using a minimum of 3 peptides per protein for quantification, our iTRAQ and label-free analyses showed, a total of 26 (4%) and 67 (25%), respectively for WT cells and a total of 18 (2.6%) and 64 (24.5%) proteins respectively, for GFP-expressers which showed a significant fold-change. We then analysed the distribution of the protein quantification ratios and determined the percentage of proteins below these ratios. The combined ratios for MDA and MDA-GFP and up- and down-regulated proteins are presented in Fig. 1. With a p value of ≤0.05, in iTRAQ analysis an arbitrary cutoff of 1.2 will lead to only 2.8% of false positive quantified proteins between biological replicates, in 2-DE analysis an arbitrary cutoff value of 1.5 will lead to less than 2% of false positive quantified proteins while in label-free analysis this percentage is obtained with an arbitrary cutoff value of 1.6. These ratio cutoffs which are in agreement with the recommendation of Millioni et al. [23] for 2-DE analysis and within the range of previous published data for iTRAQ and label-free analysis [26,29] were used in further analyses.
Fig. 1.
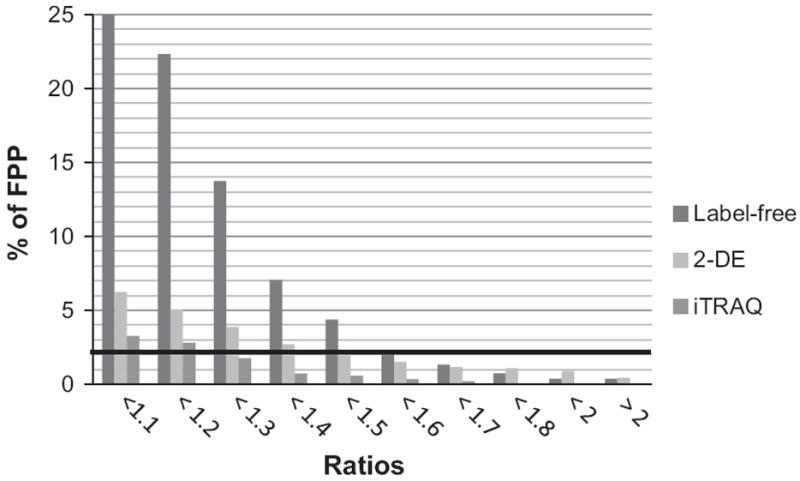
Distribution of the combined protein ratios with significant changes (p≤0.05) within the biological replicates of MDA and MDA-GFP for 2-DE, iTRAQ and label-free proteomics approaches. The percent of false positive proteins (FPP) with ratios ranging from 1 to >2 is reported.
2-DE analysis of MDA-MB-231 expressing GFP
By 2-DE, an average of 705 protein spots (MW 15–150 kDa, pH 4–7) was detected and further quantified using the PDQuest software. To reduce operator-related variability, we used only high quality gels with reproducible protein patterns between sample replicates and between independent experiments (average inter-assay CV=22%). In total, 45 protein spots were found to be differentially expressed (fold change > 1.5, p≤0.05). Two protein spots could only be detected in MDA control cells and one in MDA cells expressing GFP. 19 protein spots were down-regulated while 24 were up-regulated in MDA-GFP cells when compared to MDA control cells. LC–MS/MS analysis of these protein spots returned 23 identifications (Fig. 2, Table 1 and Supplemental data). The remaining spots were either not excised confidently or invisible after Coomassie blue R-250 staining.
Fig. 2.
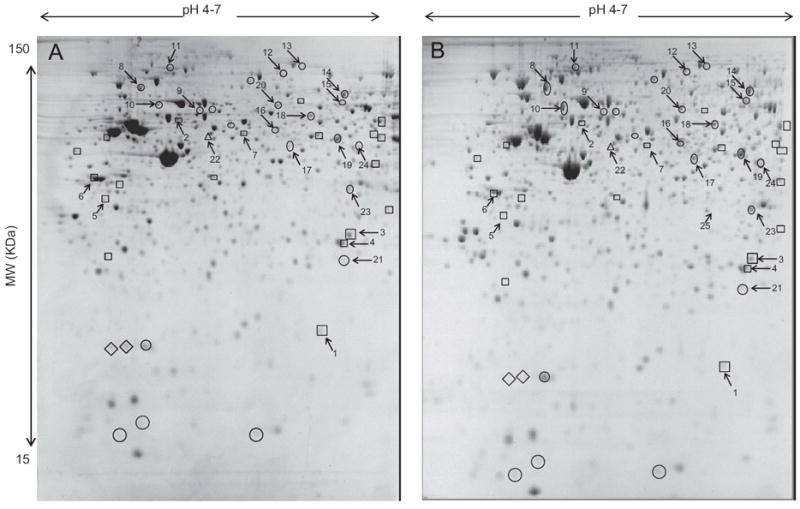
2-DE protein profiles of WT cells (A) GFP expressers (B) of MDA-231 cells. Spots highlighted presented at least a 1.5-fold expression change in MDA-GFP when compared to MDA protein spots. Spots highlighted with ◇ are only detected in MDA cells, while the spot highlighted with Δ is only detected in GFP expressers of MDA-231 cells. Protein spots labeled with ○ are over-expressed while protein spots labeled with □ are under-expressed in GFP expressers of MDA-231 cells. Spot numbers reflect identifications as reported in Table 1 and in the Supplemental data.
Table 1.
List of the identified proteins. Fold change and p value reported in italics are given as a supplemental comparison when proteins were quantified but not found differentially expressed according to our selection criteria.
| Expression in MDA-GFP cells compared to MDA cells | Protein name | Gene symbol | Uniprot acc. no. | E.C. number | Fold change
|
||
|---|---|---|---|---|---|---|---|
| 2-DE | iTRAQ | Label-free | |||||
| ↓ | Cofilin-1 | CFL1 | P23528 | −2.01 (spot 1) | −1.18 (0.27) | ||
| ↓ | Ubiquitin carboxyl-terminal hydrolase 14 | USP14 | P54578 | 3.4.19.12 | −2.09 (spot 2) | ||
| ↓ | Protein disulfide-isomerase | P4HB | P07237 | 5.3.4.1 | −2.09 (spot 2) | 1.28 (0.031) | |
| ↓ | Phosphoglycerate mutase 1 | PGAM1 | P18669 | 3.3.3.13, 5.4.2.1, 5.4.2.4 | −2.05 (spot 3) | ||
| ↓ | Proteasome subunit alpha type-6 | PSMA6 | P60900 | 3.4.25.1 | −1.78 (spot 4) | ||
| ↓ | Elongation factor 1-delta | EEF1D | P29692 | −1.54 (spot 5) | |||
| ↓ | Nucleophosmin | NPM1 | P06748 | −1.53 (spot 6) | −1.43 (0.059) | −2.45 (0.101) | |
| Conflicting data | Hepatoma-derived growth factor | HDGF | P51858 | −1.53 (spot 6) | 1.28 | ||
| ↓ | V-type proton ATPase subunit d 1 | ATP6V0D1 | P61421 | −1.53 (spot 6) | −1.53 | ||
| ↓ | Ribosome biogenesis protein WDR12 | WDR12 | Q9GZL7 | −1.63 (spot 7) | |||
| ↓ | 26S protease regulatory subunit 8 | PSMC5 | P62195 | −1.25 | |||
| ↓ | 40S ribosomal protein S19 | RSP19 | P39019 | −1.20 | |||
| ↓ | 40S ribosomal protein S2 | RSP2 | P15880 | −1.29 | −1.26 (0.043) | ||
| ↓ | 40S ribosomal protein S20 isoform 2 | RSP20 | P60866 | −1.23 | |||
| ↓ | 40S ribosomal protein S23 | RSP23 | P62266 | −1.59 | |||
| ↓ | 40S ribosomal protein S3 isoform 2 | RSP3 | P23396 | −1.23 | |||
| ↓ | 40S ribosomal protein S3a | RSPS3A | P61247 | −1.28 | |||
| ↓ | 40S ribosomal protein S9 | RPS9 | P46781 | −1.27 | |||
| ↓ | 4F2 cell-surface antigen heavy chain | SLC3A2 | P08195 | −1.63 | |||
| ↓ | 60S acidic ribosomal protein P0 | RPLP0 | P05388 | −1.29 | |||
| ↓ | 60S ribosomal protein L10a | RPL10A | P62906 | −1.27 | |||
| ↓ | 60S ribosomal protein L11 | RPL11 | P62913 | −1.37 | |||
| ↓ | 60S ribosomal protein L17 | RPL17 | P18621 | −1.23 | |||
| ↓ | 60S ribosomal protein L5 | RLP5 | P46777 | −1.20 | |||
| ↓ | Actin, cytoplasmic 2 | ACTG1 | P63261 | −1.23 | |||
| ↓ | Actin-related protein 2/3 complex subunit 2 | ARPC2 | O15144 | −1.39 | |||
| ↓ | Actin-related protein 3 | ACTR3 | P61158 | −1.22 | |||
| ↓ | Aspartate–tRNA ligase, cytoplasmic | DARS | P14868 | 6.1.1.12 | −1.32 | ||
| ↓ | ATP synthase subunit alpha, mitochondrial | ATP5A1 | P25705 | −1.47 | |||
| ↓ | ATP synthase subunit beta, mitochondrial | ATP5B | P06576 | −1.52 | −1.41 (0.008) | ||
| ↓ | Bifunctional purine biosynthesis protein PURH | ATIC | P31939 | 2.1.2.3 | −1.35 | ||
| ↓ | Caprin-1 | CAPRIN1 | Q14444 | −1.26 | |||
| ↓ | Coronin-1C | CORO1C | Q9ULV4 | −1.29 | |||
| ↓ | DNA replication licensing factor MCM2 | MCM2 | P49736 | 3.6.4.12 | −1.31 | ||
| ↓ | DNAJ homolog subfamily A member 1 | DNAJA1 | P31689 | −1.30 | |||
| ↓ | Elongation factor 1-beta | EEF1B2 | P24534 | −1.79 | |||
| ↓ | Eukaryotic initiation factor 4A-I | EIF4A1 | P60842 | 3.6.4.13 | −1.21 | −1.73 | |
| ↓ | Eukaryotic initiation factor 4A-III | EIF4A3 | P38919 | 3.6.4.13 | −1.25 | −2.05 | |
| ↓ | Eukaryotic translation initiation factor 3 subunit F | EIF3F | O00303 | 3.4.19.12 | −1.49 | −1.5 (0.018) | |
| ↓ | Eukaryotic translation initiation factor 4 gamma 1 | EIF4G1 | Q04637 | −1.31 | −1.15 (0.18) | ||
| ↓ | Glutathione S-transferase omega-1 | GSTO1 | P78417 | 2.5.1.18, 1.8.5.1, 1.20.4.2 | −1.99 | ||
| ↓ | Glutathione S-transferase P | GSTP1 | P09211 | 2.5.1.18 | −1.26 | ||
| ↓ | Guanine nucleotide-binding protein subunit beta-2-like 1 | GNB2L1 | P63244 | −1.55 | |||
| ↓ | Heterogeneous nuclear ribonucleoprotein Q | SYNCRIP | O60506 | −1.28 | −1.3 (0.031) | ||
| ↓ | Importin subunit alpha-2 | KPNA2 | P52292 | −1.95 | |||
| ↓ | Importin subunit beta-1 | KPNB1 | Q14974 | −1.35 | −1.33 (0.28) | ||
| ↓ | Inosine-5’-monophosphate dehydrogenase 2 | IMPDH2 | P12268 | 1.1.1.205 | −1.47 | ||
| ↓ | Interleukin enhancer-binding factor 2 | ILF2 | Q12905 | −1.23 | |||
| ↓ | Nucleolar and coiled-body phosphoprotein 1 | NOLC1 | Q14978 | −1.25 | |||
| ↓ | Nucleolar RNA helicase 2 isoform 1 | DDX21 | Q9NR30 | 3.6.4.16 | −1.33 | ||
| ↓ | Phosphate carrier protein, mitochondrial | SLC25A3 | Q00325 | −1.37 | |||
| ↓ | Polyadenylate-binding protein 1 | PABPC1 | P11940 | −1.30 | −1.11 (0.063) | ||
| ↓ | Probable ATP-dependent RNA helicase DDX5 | DDX5 | P17844 | 3.6.4.13 | −1.27 | ||
| ↓ | Proliferating cell nuclear antigen | PCNA | P12004 | −1.32 | −2.68 | ||
| ↓ | Proteasome subunit alpha type-5 | PSMA5 | P28066 | 3.4.25.1 | −1.32 | ||
| ↓ | Protein-L-isoaspartate(D-aspartate) O-methyltransferase | PCMT1 | P22061 | 2.1.1.77 | −1.25 | ||
| ↓ | Putative RNA-binding protein 3 | RBM3 | P98179 | −1.46 | |||
| ↓ | Ras GTPase-activating protein-binding protein 1 | G3BP1 | Q13283 | 3.6.4.12 | −1.47 | ||
| ↓ | Ras-related C3 botulinum toxin substrate 2 | RAC2 | P15153 | −1.23 | |||
| ↓ | Ribosome maturation protein SBDS | SBDS | Q9Y3A5 | −1.26 | |||
| ↓ | RNA-binding protein FUS | FUS | P35637 | −1.29 | −1.64 (0.118) | ||
| ↓ | rRNA 2’-O-methyltransferase fibrillarin | FBL | P22087 | 2.1.1.- | −1.23 | ||
| ↓ | Scaffold attachment factor B2 | SAFB2 | Q14151 | −1.26 | |||
| ↓ | Signal recognition particle 9 kDa protein | SRP9 | P49458 | −1.22 | |||
| ↓ | Small nuclear ribonucleoprotein Sm D2 | SNRPD2 | P62316 | −1.26 | |||
| ↓ | SUMO-activating enzyme subunit 1 | SAE1 | Q9UBE0 | −1.29 | |||
| ↓ | T-complex protein 1 subunit alpha | TCP1 | P17987 | −1.29 | |||
| ↓ | T-complex protein 1 subunit delta | CCT4 | P50991 | −1.20 | |||
| ↓ | T-complex protein 1 subunit eta | CCT7 | Q99832 | −1.24 | −1.43 (0.082) | ||
| ↓ | T-complex protein 1 subunit theta | CCT8 | P50990 | −1.24 | |||
| ↓ | X-ray repair cross-complementing protein 5 | XRCC5 | P13010 | 3.6.4.- | −2.16 | ||
| ↓ | X-ray repair cross-complementing protein 6 | XRCC6 | P12956 | 3.6.4.- | −1.41 | −1.49 (0.078) | |
| Only detected in GFP cell | RuvB-like 2 | RUVBL2 | Q9Y230 | (spot 22) | |||
| ↑ | Protein–glutamine gamma-glutamyltransferase 2 | TGM2 | P21980 | 2.3.2.13 | 1.51 (spot 8) | 1.36 | 2.23 |
| ↑ | Geranylgeranyl transferase type-2 subunit alpha | RABGGTA | Q92696 | 2.5.1.60 | 1.54 (spot 9) | ||
| ↑ | Plastin-2 | LCP1 | P13796 | 2.59 (spot 10) | 1.77 | 2.68 | |
| ↑ | Heat shock protein 105 kDa | HSPH1 | Q92598 | 1.74 (spot 11) | |||
| ↑ | Methionine–tRNA ligase | MARS | P56192 | 6.1.1.10 | 1.75 (spot 12) | ||
| ↑ | Insulin-degrading enzyme | IDE | P14735 | 3.4.24.56 | 1.72 (spot 13) | ||
| ↑ | Endoplasmic reticulum aminopeptidase | ERAP1 | Q9NZ08 | 3.4.11.- | 1.72 (spot 13) | ||
| ↑ | Moesin | MSN | P26038 | 1.72 (spot 14) | 1.11 (0.12) | ||
| ↑ | Prelamin-A/C | LMNA | P02554 | 1.72 (spot 14) | 1.21 (0.026) | ||
| ↑ | Succinate dehydrogenase | SDHA | P31040 | 1.3.5.1 | 1.93 (spot 15) | ||
| ↑ | Heterogeneous nuclear ribonucleoprotein H | HNRNPH1 | P31943 | 1.61 (spot 16) | 1.09 (0.46) | −1.3 (0.039) | |
| ↑ | Sorting nexin-6 | SNX6 | Q9UNH7 | 1.61 (spot 16) | |||
| ↑ | Synaptic vesicle membrane protein VAT-1 homolog | VAT1 | Q99536 | 2.35 (spot 17) | 1.3 (0.25) | ||
| ↑ | Thioredoxin reductase 1 | TXNRD1 | Q16881 | 1.8.1.9 | 1.56 (spot 18) | 1.44 (0.017) | |
| Conflicting data | S-adenosylmethionine synthase isoform type-2 | MAT2A | P31153 | 2.5.1.6 | 1.53 (spot 19) | −1.53 | |
| ↑ | Elongation factor 1-gamma | EEF1G | P26641 | 1.53 (spot 19) | 1.13 (0.080) | ||
| ↑ | Leukotriene A-4 hydrolase | LTA4H | P09960 | 3.3.2.6 | 1.61 (spot 20) | ||
| ↑ | BAG family molecular chaperone regulator 2 | BAG2 | O95816 | 2.12 (spot 21) | |||
| ↑ | Aldose reductase | AKR1B1 | P15121 | 1.1.1.21 | 1.56 (spot 23) | 1.36 | 1.4 (0.181) |
| ↑ | LIM and SH3 domain protein 1 | LASP1 | Q14847 | 1.56 (spot 23) | 1.56 (0.051) | 1.88 (0.065) | |
| ↑ | Heat shock protein beta-1 | HSPB1 | P04792 | 1.73 (spot 24) | 1.64 | ||
| ↑ | 10 kDa Heat shock protein, mitochondrial | HSPE1 | P61604 | 2.11 | |||
| ↑ | 60 kDa Heat shock protein, mitochondrial | HSPD1 | P10809 | 1.02 (0.41) | 1.61 | ||
| ↑ | 78 kDa Glucose-regulated protein | HSPA5 | P11021 | 1.17 (0.042) | 1.89 | ||
| ↑ | Activated RNA polymerase II transcriptional coactivator p15 | SUB1 | P53999 | 1.21 | |||
| ↑ | Annexin A1 | ANXA1 | P04083 | 1.66 | |||
| ↑ | AP-2 complex subunit beta | AP2B1 | P63010 | 1.35 | |||
| ↑ | ATP-citrate synthase | ACLY | P53396 | 2.3.3.8 | 1.09 (0.002) | 1.69 | |
| ↑ | B-cell receptor-associated protein 31 | BCAP31 | P51572 | 1.23 | |||
| ↑ | Calmodulin | CALM1 | P62158 | 2.03 | |||
| ↑ | Calpain small subunit 1 | CAPNS1 | P04632 | 1.18 (0.034) | 2.06 | ||
| ↑ | Calpastatin | CAST | P20810 | 1.55 | |||
| ↑ | Calponin-3 | CNN3 | Q15417 | 1.46 | 2.11 | ||
| ↑ | Calreticulin | CALR | P27797 | 1.25 | 1.24 (0.298) | ||
| ↑ | Cathepsin D | CTSD | P07339 | 3.4.23.5 | 1.80 | 3.16 | |
| ↑ | Clathrin light chain A | CLTA | P09496 | 1.28 | |||
| ↑ | Copine-1 | CPNE1 | Q99829 | 1.61 | |||
| ↑ | Cystatin-B | CSTB | P04080 | 1.39 | |||
| ↑ | Extended synaptotagmin-1 | ESYT1 | Q9BSJ8 | 1.71 | |||
| ↑ | F-actin-capping protein subunit alpha-1 | CAPZA1 | P52907 | 2.03 | |||
| ↑ | Far upstream element-binding protein 1 | FUBP1 | Q96AE4 | 1.42 | |||
| ↑ | Galectin-1 | LGALS1 | P09382 | 1.29 (0.388) | 1.67 | ||
| ↑ | Galectin-3 | LGALS3 | P17931 | 1.30 | |||
| ↑ | Galectin-3-binding protein precursor | LGALS3BP | Q08380 | 1.21 | |||
| ↑ | Gamma-enolase | ENO2 | P09104 | 4.2.1.11 | 1.32 | 1.33 (0.13) | |
| ↑ | Glucose-6-phosphate 1-dehydrogenase | G6PD | P11413 | 1.1.1.49 | 1.23 | ||
| ↑ | Glucosidase 2 subunit beta | PRKCSH | P14314 | 1.23 | 1.87 (0.076) | ||
| ↑ | HLA class I histocompatibility antigen, A-2 alpha chain | HLA-A | P01892 | 1.03 (0.101) | 2.01 | ||
| ↑ | HLA class I histocompatibility antigen, A-2 alpha chain | HLA-A | P01892 | 2.01 | |||
| ↑ | Hydroxyacyl-coenzyme A dehydrogenase, mitochondrial | HADH | Q16836 | 1.1.1.35 | 1.69 | ||
| ↑ | Importin-9 | IPO9 | Q96P70 | 1.39 | |||
| ↑ | Inhibitor of nuclear factor kappa-B kinase-interacting protein | IKBIP | Q70UQ0 | 1.85 | |||
| ↑ | Leukocyte elastase inhibitor | SERPINB1 | P30740 | 1.29 | |||
| ↑ | Macrophage migration inhibitory factor | MIF | P14174 | 5.3.2.1 | 1.12 (0.628) | 2.49 | |
| ↑ | Malate dehydrogenase, mitochondrial | MDH2 | P40926 | 1.1.1.37 | 1.38 | 1.91 | |
| ↑ | Non-histone chromosomal protein HMG-17 | HMGN2 | P05204 | 1.33 | |||
| ↑ | Nuclear ubiquitous casein and cyclin-dependent kinase substrate 1 | NUCKS1 | Q9H1E3 | 1.62 | |||
| ↑ | PDZ and LIM domain protein 1 | PDLIM1 | O00151 | 1.32 | |||
| ↑ | Peptidyl–prolyl cis–trans isomerase FKBP1A | FKBP1A | P62942 | 5.2.1.8 | 2.64 | ||
| ↑ | Peptidyl–prolyl cis–trans isomerase FKBP3 | FKBP3 | Q00688 | 5.2.1.8 | 1.31 | ||
| ↑ | Peroxiredoxin-1 | PRDX1 | Q06830 | 1.11.1.15 | 1.14 (0.221) | 1.64 | |
| ↑ | Peroxiredoxin-4 | PRDX4 | Q13162 | 1.11.1.15 | 1.24 | ||
| ↑ | Phosphatidylethanolamine-binding protein 1 | PEBP1 | P30086 | 1.69 | |||
| ↑ | Plastin-3 | PLS3 | P13797 | 1.22 (0.133) | 2.16 | ||
| ↑ | Proteasome subunit alpha type-7 | PSMA7 | O14818 | 3.4.25.1 | 1.60 | ||
| ↑ | Septin-6 | SEPT6 | Q14141 | 1.66 | |||
| ↑ | SH3 domain-binding glutamic acid-rich-like protein 3 | SH3BGRL3 | Q9H299 | 1.77 | |||
| ↑ | Stathmin | STMN1 | P16949 | 1.46 | 1.94 | ||
| ↑ | Superoxide dismutase [Cu–Zn] | SOD1 | P00441 | 1.15.1.1 | 1.87 | ||
| ↑ | Thioredoxin | TXN | P10599 | 1.55 | |||
| ↑ | Thymidylate kinase | DTYMK | P23919 | 2.7.4.9 | 1.37 | ||
| ↑ | Thymosin beta-10 | TMSB10 | P63313 | 2.26 | |||
| ↑ | Thymosin beta-4 | TMSB4X | P62328 | 2.70 | |||
| ↑ | Tropomyosin alpha-4 chain | TPM4 | P67936 | 1.28 | |||
| ↑ | Tubulin-specific chaperone A | TBCA | O75347 | 1.61 | |||
| ↑ | Ubiquitin carboxyl-terminal hydrolase isozyme L3 | UCHL3 | P15374 | 3.4.19.12 | 1.25 (0.128) | 1.60 | |
Protein identification and quantification in iTRAQ and label-free analysis
We used two additional distinct mass spectrometry experimental approaches to profile and quantify the proteome changes occurring following GFP expression in cells. From our iTRAQ experiments (IPI human database, unused score > 1.3 (≥95% confidence)), ProteinPilot identified 6281 proteins before grouping, representing 11,471 distinct peptides (≥95% confidence) and 39,608 spectra. These data collapsed into 1264 proteins after grouping. Combination of the technical replicates brought a common result of 874 proteins. Our label-free experiments identified 130,163 MS/MS spectra. These were searched against the Swiss-Prot database 24_8_12 and 4359 peptides were identified. To increase confidence in protein identification, only peptides with an ion score >25 were selected. After conflict resolution 828 proteins across all replicates (ANOVAs p≤0.05) were identified. When looking at the number of peptides per protein identification, notable differences arise between the iTRAQ and label-free analysis. For quantification purposes, we chose to consider only proteins identified with at least 3 peptides in both iTRAQ and label-free analysis. Number of proteins identified and quantified with these criteria in both experimental set up as well as the overlap of protein identification is shown in Fig. 3.
Fig. 3.
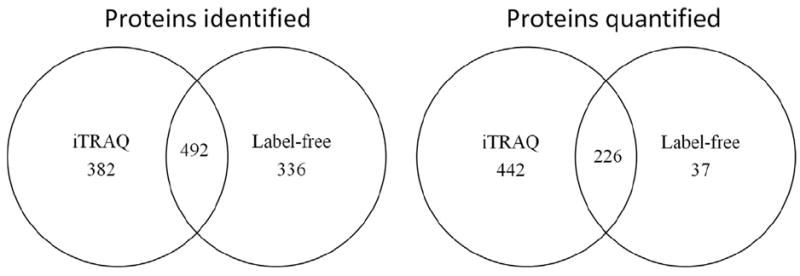
The number of proteins identified (with one peptide) and quantified (with a minimum of three unique peptides) overlapping between the iTRAQ and label-free approaches after running technical and biological replicates.
Protein abundance change in iTRAQ and label-free analysis of MDA-expressing GFP
In iTRAQ analysis, a total of 104 differentially expressed proteins were identified (fold change > 1.2 with p≤0.05), of which 62 were down-regulated and 42 were up-regulated in MDA expressing GFP (Table 1). Five of these proteins were previously identified as differentially expressed using 2-DE. However, between these common identifications conflicting results arise (as for example, HDGF, MAT2A). This might be explained by the fact that LC–MS/MS analysis of individual spots from our 2-DE analysis sometimes revealed several protein identifications which is not uncommon with these types of approaches [30].
In our label-free analysis, a combined analysis of 3 biological replicates and 3 technical replicates of MDA-GFP and MDA cells respectively identified 30 differentially expressed proteins (fold change > 1.6, p≤0.05), 5 being down-regulated and 24 up-regulated in MDA-GFP cells when compared to MDA cells (Table 1). Within these proteins, 7 were also identified as differentially expressed in our 2-DE/iTRAQ experiments.
Protein classification analysis of the differentially expressed proteins following stable GFP expression in MDA cells
Using the PANTHER classification system, we determined the percentage of proteins found in each of the categories identified within molecular function and biological process (Fig. 4). It is also important to mention that many proteins were associated with several Gene Ontology (GO) annotations, for example, the 73 up-regulated proteins were associated with 93 and 167 GO terms in molecular function and biological process respectively.
Fig. 4.
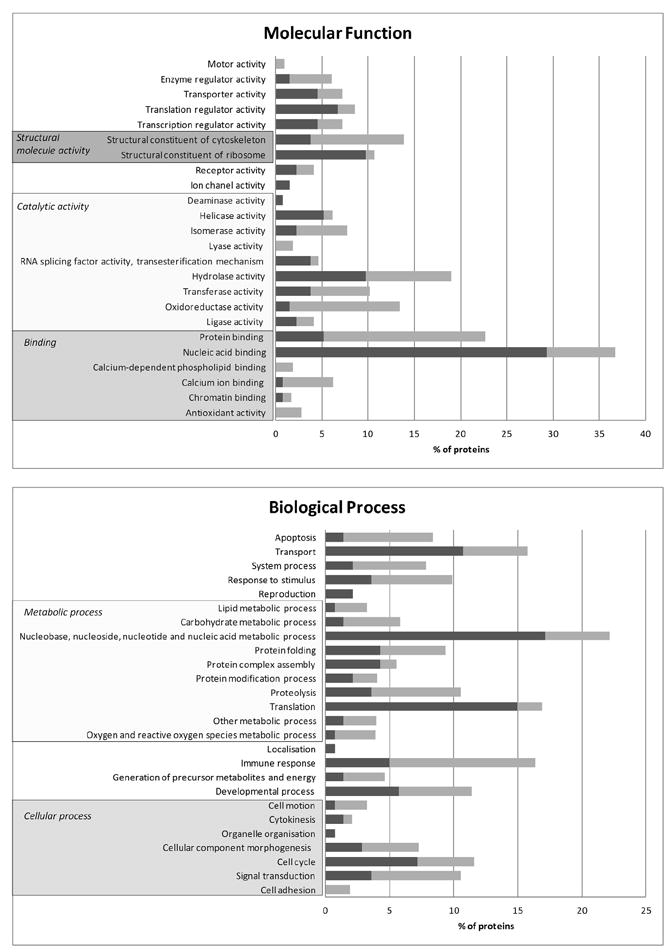
Distribution of the proteins differentially expressed between MDA and MDA-GFP classified following ontology analysis using the PANTHER classification system (〈http://www.pantherdb.org〉). The different categories within molecular function and biological process are reported. Black indicates percent of proteins down-regulated in MDA-GFP, while gray indicates those up-regulated.
The major categories within molecular function were binding, catalytic activity and structural molecule activity encompassing 76.8% and 79.6% function hits for the down- and up-regulated proteins respectively. Within biological process, the three major categories were metabolic process, cellular process and transport (63.1%) for the down-regulated proteins and metabolic process, cellular process and immune response (52.6%) for the up-regulated proteins identified in our combine analysis (Fig. 4).
STRING network analysis of the predicted protein–protein interactions was performed to identify functionally linked proteins. The network is presented under the evidence view, whereby lines represent the existence of evidence (neighborhood, gene fusion, co-occurrence, co-expression, experiments, databases, textmining) used in predicting the association. The gene symbols used in this network are listed in Table 1. Several well defined clusters (Fig. 5) are revealed. The green cluster groups are mostly down-regulated proteins that are constituents of the ribosome, the pink cluster has both down- and up-regulated proteins that correspond to some elongation factors and proteasome subunit, a third cluster shown in red, represents down-regulated proteins involved in the DNA metabolic process while the last major cluster shown in yellow represents up-regulated proteins that bind to unfolded proteins and down-regulated proteins that bind to nucleotides. This suggests the occurrence of some feedback mechanisms.
Fig. 5.
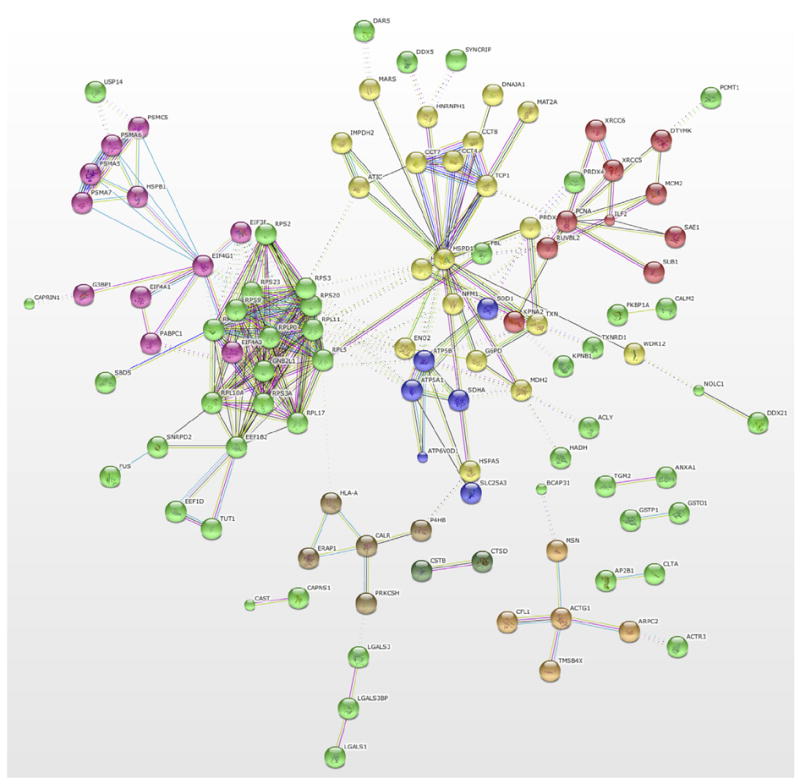
Evidence view of a protein–protein interactions map generated using STRINGv9.05 analysis tools (〈http://string-db.org〉). Settings used to generate this map were high confidence score (0.7) and Kmeans clustering. The gene symbols used are listed in Table 1 and disconnected nodes are hidden.
Discussion
GFP is widely used in cell biology as a reporter of expression. However, GFP expression has been shown to induce molecular changes within the cell and sometimes even toxicity [2,10,11]. Nonetheless, only a few investigations of the molecular changes induced by GFP expression have been published.
Metabolic process changes following stable GFP expression in MDA cells
In both, down- and up-regulated protein groups, the largest category within biological process was metabolic process comprising 40.6% and 27% of the processes respectively (Fig. 4).
Changes in protein expression occur principally within primary metabolic process (94.9% of the down-regulated and 82% of the up-regulated proteins). The majority of these modifications relate to protein metabolism (59.7%, 59.6% respectively), this is followed by the nucleobase, nucleoside, nucleotide and nucleic acid metabolic process (35.8%, 17% respectively), carbohydrate metabolism (3%, 14.9% respectively), and lipid metabolism (1.5%, 8.5% respectively).
Of the 41 down-regulated proteins within the protein metabolic process category, 51.2% are involved in translation, while the 28 are up-regulated proteins within this subcategory, 88.9% are involved in some kind of protein modification (i.e., folding, modification, complex assembly, proteolysis). Furthermore 24 down-regulated proteins are found within the nucleic acid metabolic process while only 8 within this category are up-regulated. This might indicate that stable expression of GFP in MDA-MB-231 cells have the potential to induce a decrease of pre-translation and translation events while increasing the post-translation molecular events.
The endoplasmic reticulum (ER) provides an optimal and unique environment for protein folding, assembly and modifications [31]. It is well known that if accumulation of unfolded or misfolded proteins occurs in the ER, activation of complex cytoplasmic and nuclear signalling pathways lead to a homeostatic cell response, called the “unfolded protein response” (UPR). This adaptive response coordinates translation suppression, and, an increased production of molecular chaperones that amplify the protein folding capacity of the ER and a promotion of ER-associated degradation (ERAD) that clears misfolded proteins (for review, see [32]). A recent microarray study by Dombroski et al. [33] reported on the variation in the ER-stress response by exposing B cells to two standard drugs known to inhibit protein folding and modification in the ER. Interestingly, the expression of 18 proteins identified in this study was also found to be modified in the Dombroski et al. [33] study suggesting that GFP expression induces ER-stress in the cell and possibly UPR. A few of our differentially expressed proteins are classic UPR products (for example, CCT4, CCT7, DNAJA1, HSPH1, HSPA5, HSPE1, HSPB1, USP14). These findings are consistent with the presence of significant amounts of unfolded GFP proteins after overexpression in mammalian cells [34].
Changes in the expression of proteins involved in cellular process following stable GFP expression in MDA cells
The second largest functional category in which both down- and up-regulated proteins sorted is cellular process 11.6% and 13.8% respectively (Fig. 4). Functions such as cell adhesion, cell motion, cell cycle, cellular component organisation (more specifically morphogenesis) and cell communication (Fig. 4) were identified. Interestingly, several differentially expressed proteins are involved in cell adhesion, cell motion and cellular morphogenesis (Fig. 4). Among these proteins, 16 were found to be structural constituents of the cytoskeleton (ACTG1, COF1, SEPT6, GSTO1, CNN3, LMNA, MSN, TPM4, CAPZA1, CORO1C, PLS3, PDLIM1, PLSL, ACTR3, EEF1G, MARS). This suggests that expression of GFP could have a subtle influence on cytoskeletal architecture, cell morphology and motility.
In 2011, Comley et al. [7] reported that expression of YFP in neurons induces morphological changes that are similar to early pathological changes in neurons and additionally they suggested that this could be dose-dependent. Other evidences of the effect of GFP expression on cytoskeletal function have been reported. Huang et al. [4] found that transgenic expression of GFP caused a dilated cardiomyopathy in transgenic mouse lines. Krestel et al. [35] showed that co-expression of eGFP and β-galactosidase in the cytoplasm of forebrain neurons of mice induced growth retardation, weakness, and premature lethality and finally that eGFP expression induced a contractile dysfunction disturbing actin–myosin interactions in muscle cells [3].
Stable GFP expression in MDA cells may lead to altered cellular immune response in vivo
Two other categories of interest within biological process are the immune response and the response to stimulus categories. The category is well represented with 18 up-regulated proteins (MIF, EEF1G, PRDX1, HSPA5, CAPNS1, LGALS3BP, PRDX4, LGALS1, CTSD, LGALS3, FKBP3, TXN, HSPB1, TXNRD1, HLA-A, FKBP1A, MARS, LTA4H), compared to only 7 down-regulated proteins (XRCC5, XRCC6, GSTO1, GSTP1, HSPH1, ILF2, DNAJA1). Within this category we found that 9 up-regulated proteins also belong to the response to stimulus category. These are involved in cellular defense response (HLA-A, FKBP3, CTSD, LGALS3, FKBP1A), response to stress (HSPB1, TXN) and response to toxin (EEF1G, MARS) and suggest an activation of a cell stress response in MDA cells.
Badrian and Bogoyevitch [11] reported on the transcriptional changes associated with GFP-expression in cardiac myocytes, observing that a number of the up-regulated genes coded for protein products involved in the response to stimulus pathways of the cells. Moreover, other in vivo and in vitro experimental data [2,4,7] showed that expression of a fluorescent protein in cells/tissues modifies their molecular composition and that this seems to be independent of the plasmid used. Liu et al. [2] have shown that GFP expression using three different plasmids leads to a similar pro-apoptotic effect.
Influence of the plasmid and selection by the way of the neomycin resistance (neor) gene using G418 has been previously studied in two cell lines (BHK, CHO) by Yallop et al. [36,37]. They reported that while growth and metabolism of both cell lines was affected by the presence of G418 in the culture medium in a manner of increased metabolic load this effect was greatly compensated by addition of serum and glutamine to the culture medium [37]. Moreover, they further elucidated the metabolic changes occurring by measuring the activity and relative expression of key enzymes involved in glucose and glutamine metabolism. They reported that while an increase in enzymatic activity was observed, this was not correlated with an increase in the expression levels of these key enzymes [36]. Nevertheless, stable GFP expression can only be achieved through the transfection of a plasmid containing a selectable marker. Therefore, while we cannot absolutely rule out some changes in the proteome induced by G418 or the process of transfection, particularly relevant for metabolic pathway, the influence might still be minimal in serum-based culture as used in our study.
Taken together, our results and those of others suggest that great care should be taken in the analysis of gene and/or protein expression profile modifications which involve co-expression with GFP as it can induce a variety of molecular changes. Future studies will need to take this into account in regard to experimental design and data interpretation and perform necessary controls to ensure that any results reported are a direct effect of the experimental intervention and not simply a consequence of fluorescent protein expression.
Supplementary Material
Acknowledgments
This work was supported by Grants from the Collaborative Research Network (CRN) on Mental Health and Well-being in Rural and Regional Communities and the University of New England (PM, JC) and National Institute of Health (2R01 CA108607) (PR). Some mass spectrometric results were obtained at the Bioanalytical Mass Spectrometry Facility within the Analytical Centre of the University of New South Wales. Subsidized access to this facility is gratefully acknowledged.
Abbreviations
- GFP
green fluorescence protein
- 2-DE
two-dimensional electrophoresis
- iTRAQ
isobaric tags for relative and absolute quantitation
Footnotes
Appendix A. Supporting information
Supplementary data associated with this article can be found in the online version at http://dx.doi.org/10.1016/j.yexcr.2013.07.019.
References
- 1.Tsien RY. The green fluorescent protein. Annu Rev Biochem. 1998;67:509–544. doi: 10.1146/annurev.biochem.67.1.509. [DOI] [PubMed] [Google Scholar]
- 2.Liu HS, Jan MS, Chou CK, Chen PH, Ke NJ. Is green fluorescent protein toxic to the living cells? Biochem Biophys Res Commun. 1999;260:712–717. doi: 10.1006/bbrc.1999.0954. [DOI] [PubMed] [Google Scholar]
- 3.Agbulut O, Huet A, Niederlander N, Puceat M, Menasche P, Coirault C. Green fluorescent protein impairs actin–myosin interactions by binding to the actin-binding site of myosin. J Biol Chem. 2007;282:10465–10471. doi: 10.1074/jbc.M610418200. [DOI] [PubMed] [Google Scholar]
- 4.Huang WY, Aramburu J, Douglas PS, Izumo S. Transgenic expression of green fluorescence protein can cause dilated cardiomyopathy. Nat Med. 2000;6:482–483. doi: 10.1038/74914. [DOI] [PubMed] [Google Scholar]
- 5.Sekar RB, Kizana E, Smith RR, Barth AS, Zhang Y, Marban E, Tung L. Lentiviral vector-mediated expression of GFP or Kir2.1 alters the electrophysiology of neonatal rat ventricular myocytes without inducing cytotoxicity. Am J Physiol Heart Circ Physiol. 2007;293:H2757–H2770. doi: 10.1152/ajpheart.00477.2007. [DOI] [PubMed] [Google Scholar]
- 6.Nishimura S, Nagai S, Sata M, Katoh M, Yamashita H, Saeki Y, Nagai R, Sugiura S. Expression of green fluorescent protein impairs the force-generating ability of isolated rat ventricular cardiomyocytes. Mol Cell Biochem. 2006;286:59–65. doi: 10.1007/s11010-005-9090-6. [DOI] [PubMed] [Google Scholar]
- 7.Comley LH, Wishart TM, Baxter B, Murray LM, Nimmo A, Thomson D, Parson SH, Gillingwater TH. Induction of cell stress in neurons from transgenic mice expressing yellow fluorescent protein: implications for neurodegeneration research. PloS One. 2011;6:e17639. doi: 10.1371/journal.pone.0017639. [DOI] [PMC free article] [PubMed] [Google Scholar]
- 8.Krestel HE, Mihaljevic AL, Hoffman DA, Schneider A. Neuronal co-expression of EGFP and beta-galactosidase in mice causes neuropathology and premature death. Neurobiol Dis. 2004;17:310–318. doi: 10.1016/j.nbd.2004.05.012. [DOI] [PubMed] [Google Scholar]
- 9.Zhang F, Hackett NR, Lam G, Cheng J, Pergolizzi R, Luo L, Shmelkov SV, Edelberg J, Crystal RG, Rafii S. Green fluorescent protein selectively induces HSP70-mediated up-regulation of COX-2 expression in endothelial cells. Blood. 2003;102:2115–2121. doi: 10.1182/blood-2003-01-0049. [DOI] [PubMed] [Google Scholar]
- 10.Baens M, Noels H, Broeckx V, Hagens S, Fevery S, Billiau AD, Vankelecom H, Marynen P. The dark side of EGFP: defective polyubiquitination. PloS One. 2006;1:e54. doi: 10.1371/journal.pone.0000054. [DOI] [PMC free article] [PubMed] [Google Scholar]
- 11.Badrian B, Bogoyevitch MA. Changes in the transcriptional profile of cardiac myocytes following green fluorescent protein expression. DNA Cell Biol. 2007;26:727–736. doi: 10.1089/dna.2007.0604. [DOI] [PubMed] [Google Scholar]
- 12.Coumans JVF, Harvey J, Backhouse D, Poljak A, Raftery MJ, Nehl D, Katz ME, Pereg L. Proteomic assessment of host-associated microevolution in the fungus Thielaviopsis basicola. Environ Microbiol. 2011;13:576–588. doi: 10.1111/j.1462-2920.2010.02358.x. [DOI] [PubMed] [Google Scholar]
- 13.Neuhoff V, Arold N, Taube D, Ehrhardt W. Improved staining of proteins in polyacrylamide gels including isoelectric focusing gels with clear background at nanogram sensitivity using Coomassie Brilliant Blue G-250 and R-250. Electrophoresis. 1988;9:255–262. doi: 10.1002/elps.1150090603. [DOI] [PubMed] [Google Scholar]
- 14.Coumans JVF, Poljak A, Raftery MJ, Backhouse D, Pereg-Gerk L. Analysis of cotton (Gossypium hirsutum) root proteomes during a compatible interaction with the black root rot fungus Thielaviopsis basicola. Proteomics. 2009;9:335–349. doi: 10.1002/pmic.200800251. [DOI] [PubMed] [Google Scholar]
- 15.Ross PL, Huang YN, Marchese JN, Williamson B, Parker K, Hattan S, Khainovski N, Pillai S, Dey S, Daniels S, Purkayastha S, Juhasz P, Martin S, Bartlet-Jones M, He F, Jacobson A, Pappin DJ. Multiplexed protein quantitation in Saccharomyces cerevisiae using amine-reactive isobaric tagging reagents. Mol Cell Proteomics: MCP. 2004;3:1154–1169. doi: 10.1074/mcp.M400129-MCP200. [DOI] [PubMed] [Google Scholar]
- 16.Lim YA, Rhein V, Baysang G, Meier F, Poljak A, Raftery MJ, Guilhaus M, Ittner LM, Eckert A, Gotz J. Abeta and human amylin share a common toxicity pathway via mitochondrial dysfunction. Proteomics. 2010;10:1621–1633. doi: 10.1002/pmic.200900651. [DOI] [PubMed] [Google Scholar]
- 17.Gatlin CL, Kleemann GR, Hays LG, Link AJ, Yates JR., III Protein identification at the low femtomole level from silver-stained gels using a new fritless electrospray interface for liquid chromatography–microspray and nanospray mass spectrometry. Anal Biochem. 1998;263:93–101. doi: 10.1006/abio.1998.2809. [DOI] [PubMed] [Google Scholar]
- 18.Karp NA, McCormick PS, Russell MR, Lilley KS. Experimental and statistical considerations to avoid false conclusions in proteomics studies using differential in-gel electrophoresis. Mol Cell Proteomics: MCP. 2007;6:1354–1364. doi: 10.1074/mcp.M600274-MCP200. [DOI] [PubMed] [Google Scholar]
- 19.Storey JD, Tibshirani R. Statistical significance for genomewide studies. Proc Natl Acad Sci USA. 2003;100:9440–9445. doi: 10.1073/pnas.1530509100. [DOI] [PMC free article] [PubMed] [Google Scholar]
- 20.Mi H, Lazareva-Ulitsky B, Loo R, Kejariwal A, Vandergriff J, Rabkin S, Guo N, Muruganujan A, Doremieux O, Campbell MJ, Kitano H, Thomas PD. The PANTHER database of protein families, subfamilies, functions and pathways. Nucleic Acids Res. 2005;33:D284–D288. doi: 10.1093/nar/gki078. [DOI] [PMC free article] [PubMed] [Google Scholar]
- 21.Thomas PD, Campbell MJ, Kejariwal A, Mi H, Karlak B, Daverman R, Diemer K, Muruganujan A, Narechania A. PANTHER: a library of protein families and subfamilies indexed by function. Genome Res. 2003;13:2129–2141. doi: 10.1101/gr.772403. [DOI] [PMC free article] [PubMed] [Google Scholar]
- 22.Franceschini A, Szklarczyk D, Frankild S, Kuhn M, Simonovic M, Roth A, Lin J, Minguez P, Bork P, von Mering C, Jensen LJ. STRING v9.1: protein–protein interaction networks, with increased coverage and integration. Nucleic Acids Res. 2013;41:D808–815. doi: 10.1093/nar/gks1094. [DOI] [PMC free article] [PubMed] [Google Scholar]
- 23.Millioni R, Puricelli L, Sbrignadello S, Iori E, Murphy E, Tessari P. Operator- and software-related post-experimental variability and source of error in 2-DE analysis. Amino Acids. 2012;42:1583–1590. doi: 10.1007/s00726-011-0873-7. [DOI] [PubMed] [Google Scholar]
- 24.Li Z, Adams RM, Chourey K, Hurst GB, Hettich RL, Pan C. Systematic comparison of label-free, metabolic labeling, and isobaric chemical labeling for quantitative proteomics on LTQ Orbitrap Velos. J Proteome Res. 2012;11:1582–1590. doi: 10.1021/pr200748h. [DOI] [PubMed] [Google Scholar]
- 25.Mertins P, Udeshi ND, Clauser KR, Mani DR, Patel J, Ong SE, Jaffe JD, Carr SA. iTRAQ labeling is superior to mTRAQ for quantitative global proteomics and phosphoproteomics. Mol Cell Proteomics: MCP. 2012;11 doi: 10.1074/mcp.M111.014423. M111 014423. [DOI] [PMC free article] [PubMed] [Google Scholar]
- 26.Wang H, Alvarez S, Hicks LM. Comprehensive comparison of iTRAQ and label-free LC-based quantitative proteomics approaches using two Chlamydomonas reinhardtii strains of interest for biofuels engineering. J Proteome Res. 2012;11:487–501. doi: 10.1021/pr2008225. [DOI] [PubMed] [Google Scholar]
- 27.Xie F, Liu T, Qian WJ, Petyuk VA, Smith RD. Liquid chromatography–mass spectrometry-based quantitative proteomics. J Biol Chem. 2011;286:25443–25449. doi: 10.1074/jbc.R110.199703. [DOI] [PMC free article] [PubMed] [Google Scholar]
- 28.Ow SY, Salim M, Noirel J, Evans C, Rehman I, Wright PC. iTRAQ underestimation in simple and complex mixtures: “the good, the bad and the ugly”. J Proteome Res. 2009;8:5347–5355. doi: 10.1021/pr900634c. [DOI] [PubMed] [Google Scholar]
- 29.Patel VJ, Thalassinos K, Slade SE, Connolly JB, Crombie A, Murrell JC, Scrivens JH. A comparison of labeling and label-free mass spectrometry-based proteomics approaches. J Proteome Res. 2009;8:3752–3759. doi: 10.1021/pr900080y. [DOI] [PubMed] [Google Scholar]
- 30.Lim H, Eng J, Yates JR, III, Tollaksen SL, Giometti CS, Holden JF, Adams MW, Reich CI, Olsen GJ, Hays LG. Identification of 2D-gel proteins: a comparison of MALDI/TOF peptide mass mapping to mu LC–ESI tandem mass spectrometry. J Am Soc Mass Spectrom. 2003;14:957–970. doi: 10.1016/s1044-0305(03)00144-2. [DOI] [PubMed] [Google Scholar]
- 31.Wei J, Hendershot LM. Protein folding and assembly in the endoplasmic reticulum. EXS. 1996;77:41–55. doi: 10.1007/978-3-0348-9088-5_4. [DOI] [PubMed] [Google Scholar]
- 32.Schroder M, Kaufman RJ. The mammalian unfolded protein response. Annu Rev Biochem. 2005;74:739–789. doi: 10.1146/annurev.biochem.73.011303.074134. [DOI] [PubMed] [Google Scholar]
- 33.Dombroski BA, Nayak RR, Ewens KG, Ankener W, Cheung VG, Spielman RS. Gene expression and genetic variation in response to endoplasmic reticulum stress in human cells. Am J Hum Genet. 2010;86:719–729. doi: 10.1016/j.ajhg.2010.03.017. [DOI] [PMC free article] [PubMed] [Google Scholar]
- 34.Sacchetti A, Cappetti V, Marra P, Dell’Arciprete R, El Sewedy T, Crescenzi C, Alberti S. Green fluorescent protein variants fold differentially in prokaryotic and eukaryotic cells. J Cell Biochem Suppl. 2001;36:117–128. doi: 10.1002/jcb.1091. [DOI] [PubMed] [Google Scholar]
- 35.Krestel HE, Mihaljevic ALA, Hoffman DA, Schneider A. Neuronal co-expression of EGFP and beta-galactosidase in mice causes neuropathology and premature death. Neurobiol Dis. 2004;17:310–318. doi: 10.1016/j.nbd.2004.05.012. [DOI] [PubMed] [Google Scholar]
- 36.Yallop CA, Norby PL, Jensen R, Reinbach H, Svendsen I. Characterisation of G418-induced metabolic load in recombinant CHO and BHK cells: effect on the activity and expression of central metabolic enzymes. Cytotechnology. 2003;42:87–99. doi: 10.1023/B:CYTO.0000009821.82741.8c. [DOI] [PMC free article] [PubMed] [Google Scholar]
- 37.Yallop CA, Svendsen I. The effects of G418 on the growth and metabolism of recombinant mammalian cell lines. Cytotechnology. 2001;35:101–114. doi: 10.1023/A:1017550902771. [DOI] [PMC free article] [PubMed] [Google Scholar]
Associated Data
This section collects any data citations, data availability statements, or supplementary materials included in this article.