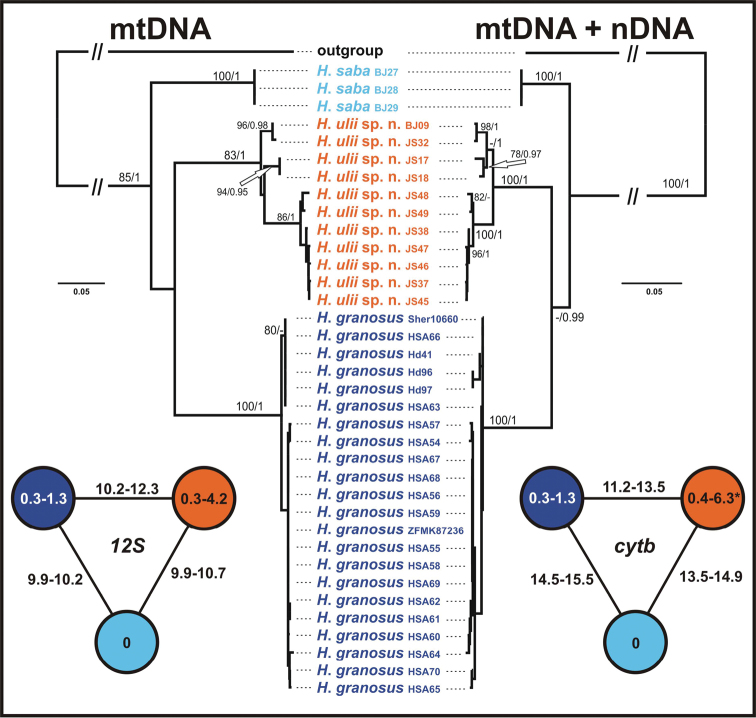
Figure 2.
Maximum likelihood trees of mtDNA and mtDNA + nDNA datasets of the ‘Hemidactylus saba species group’. ML bootstrap values/Bayesian posterior probabilities are indicated by the nodes. Hemidactylus flaviviridis and Hemidactylus angulatus were used as outgroups. At the sides, schematic networks showing intra- and interspecific uncorrected p distances (in %) in the sequences of 12S and cytb. * intraspecific distances within Hemidactylus ulii sp. n. are based on an alignment of 1127 bp, all other values for cytb are calculated for an alignment of 307 bp.

