Abstract
Autism Spectrum Disorders (ASD) are characterized by atypical patterns of behaviors and impairments in social communication. Among the fundamental social impairments in the ASD population are challenges in appropriately recognizing and responding to facial expressions. Traditional intervention approaches often require intensive support and well-trained therapists to address core deficits, with many with ASD having tremendous difficulty accessing such care due to lack of available trained therapists as well as intervention costs. As a result, emerging technology such as virtual reality (VR) has the potential to offer useful technology-enabled intervention systems. In this paper, an innovative VR-based facial emotional expression presentation system was developed that allows monitoring of eye gaze and physiological signals related to emotion identification to explore new efficient therapeutic paradigms. A usability study of this new system involving ten adolescents with ASD and ten typically developing adolescents as a control group was performed. The eye tracking and physiological data were analyzed to determine intragroup and intergroup variations of gaze and physiological patterns. Performance data, eye tracking indices and physiological features indicated that there were differences in the way adolescents with ASD process and recognize emotional faces compared to their typically developing peers. These results will be used in the future for an online adaptive VR-based multimodal social interaction system to improve emotion recognition abilities of individuals with ASD.
Index Terms: 3D Interaction, multimodal interaction, psychology, usability, vr-based response systems
1 Introduction
Autism Spectrum Disorders (ASD) are characterized by atypical patterns of behaviors and impairments in social communication [1]. One in 88 children in the United States has some form of ASD [2] with tremendous familial and societal costs associated with the disorder [3, 4]. As a result, effective identification and treatment of ASD is considered by many to be a public health emergency [5]. Among the fundamental social impairments in the ASD population are challenges appropriately recognizing and responding to nonverbal cues and communication, often taking the form of challenges recognizing and appropriately responding to facial expressions [6, 7]. In particular, individuals with ASD have been shown to have impaired face discrimination, slow and atypical face processing strategies, reduced attention to eyes, and unusual strategies for consolidating information viewed on other’s faces [8].
Studies have found that children with ASD in a controlled environment were able to perform basic facial recognition tasks as well as their control peers, but often failed in identifying more complex expressions [7] as well as required more prompts and more time to respond to facial emotional expression understanding tasks [9]. In general, children with ASD have shown significant impairment in processing and understanding complex and dynamically displayed facial expressions of emotion [10, 11].
There exist traditional intervention paradigms that seek to mitigate these impairments [12]. For example, in a 7-month long behavioral intervention involving social interaction and social emotional understanding, Bauminger showed that children with ASD showed improved social functioning and understanding, and displayed complex emotional expressions [12]. However, traditional behavioral intervention requiring intensive behavioral sessions is not accessible to the vast majority of ASD population due to lack of trained therapists as well as intervention costs. Innovative technology promises alternative or assistive therapeutic paradigms in increasing intervention accessibility, decreasing assessment efforts, promoting intervention, reducing the cost of treatment, and ultimately skill generalization [13]. In this context, emerging technology such as virtual reality (VR) [14–16] has the potential to offer useful technology-enabled therapeutic systems. However, most VR systems applied in the context of autism therapy focus on performance or explicit user feedback as primary means of evaluation and thus lack adaptability [17, 18]. Additionally, existing VR-based systems do not incorporate implicit cues from sensors such as peripheral physiological signals [19, 20] and eye tracking [21] within the VR environment, which may help facilitating individualization and adaptation, and possibly acceleration of learning emotional cues. In this paper, we present a novel VR-based facial expression and emotion generation system that can present controlled levels of facial emotional expressions and gather both eye gaze and peripheral physiological data related to emotion recognition in a synchronous manner. We believe that such ability will provide insight to the emotion recognition process of the children with ASD and eventually help in designing new intervention paradigms to address the emotion recognition vulnerabilities.
The remainder of the paper is organized as follows. Section 2 presents a brief overview of the existing virtual reality systems in autism therapy and outlines the main objectives and scope of this work. Section 3 and Section 4 describe the overall system development, and the methods and procedures followed in the usability study, respectively. Results and their implications are discussed in Section 5. Finally, the overall contributions are summarized in Section 6.
2 Virtual Reality in Autism Therapy
Virtual reality environments offer benefits to children with ASD mainly due to their ability to simulate real world scenarios in a carefully controlled and safe environment [22, 23]. Controlled stimuli presentation, objectivity and consistency, and gaming factors to motivate for task completion are among the primary advantages of using VR-based systems for ASD intervention. While it was shown that these systems can help generalization across contexts [24], generalization to real-world interactions remains an open question.
2.1 VR-based Emotion Expression
Basic VR-based interaction for children with ASD began in 1990s [22]. Various displays including immersive head mounted displays (HMD) were employed in the early phases of virtual interaction of children with ASD. However, HMD were rated as heavy and causing discomfort and as a result, desktop-based VR were preferred to HMD [25]. Basic social skills training and navigating in the VR environment were examined with some success [18]. The use of VR for understanding and interpreting the basic facial emotional expressions were studied and found that children with ASD performed well in VR [26].
2.2 Adaptive VR-based Systems
The vast majority of earlier VR systems as applied to intervention were performance based response systems. However, recent research in VR systems for application of Attention Deficit Hyperactivity Disorders (ADHD), ASD, and cerebral palsy suggest making such VR systems feedback-based may result in increased engagement and individualization [21]. Some of these studies used touchscreens to teach children with ASD skills such as pretend play, turn-taking, and other social skills (e.g., directed eye gaze) using a co-located cooperation enforcing interface, called StoryTable [27, 28]. While haptic feedback can be useful in certain contexts, understanding eye gaze and physiological response during emotion recognition can be critical since both eye gaze and physiology have been shown to convey a tremendous amount of information regarding the emotion recognition process [19, 29].
There are a few recent studies that incorporate peripheral psychophysiological signals [19, 30] and eye gaze monitoring [21] into VR systems as applied to ASD intervention. These systems monitor several channels of physiological signals to determine the underlying affective states of the subject for individualized VR social interactions. The current study employed 4 channels of peripheral psychophysiological signals and eye tracking to determine within and intergroup variations in physiological feature patterns and eye behavioral patterns for future online adaptive individualized social VR-based social interaction.
2.3 Objectives
The major objectives of this work are to: (1) develop an innovative VR-based facial emotional recognition system that allows monitoring of eye gaze and physiological signals, and (2) perform a usability study to demonstrate the benefit of such a system in understanding the fundamental mechanism of emotion recognition. We believe that by precisely controlling emotional expressions in VR and gathering objective individualized eye gaze, physiological responses related to emotion recognition as well as performance data, new efficient intervention paradigms can be developed in the future. The findings in this study may inform future development of affect-sensitive virtual social interaction tasks.
3 System Design
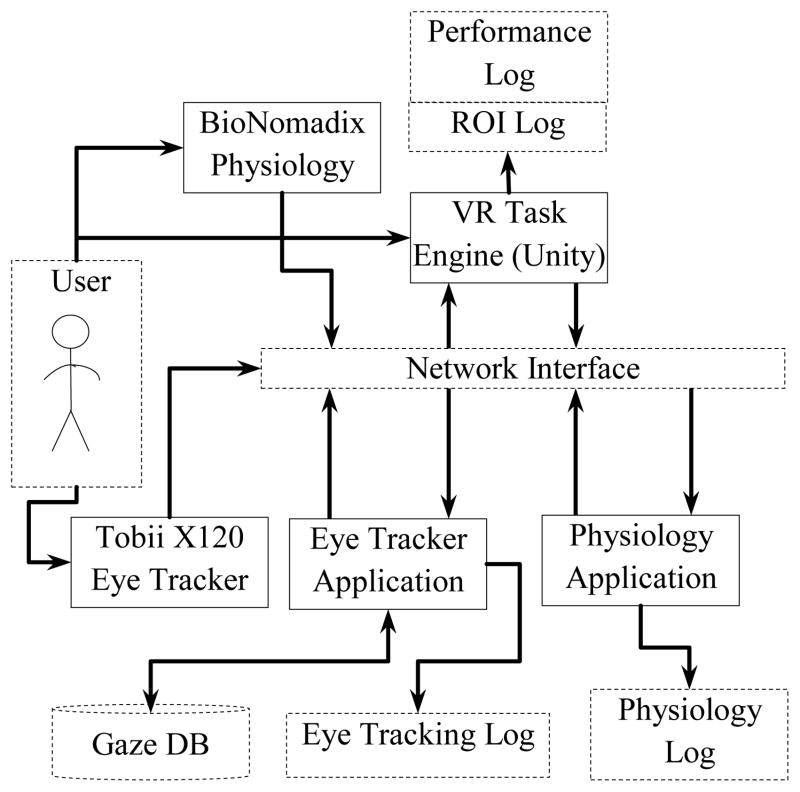
A VR-based facial emotional expressions presentation system, which incorporated eye tracking and peripheral physiological monitoring, was developed to study the fundamental differences in eye gaze and physiological patterns of adolescents with autism while presented with emotional expression stimuli. The system was composed of three major applications running separately while communicating via a network in a distributed fashion. There were two phases of this study: the online phase represents stimuli presentation, and eye tracking and physiological monitoring, while the offline phase consists of offline data processing and analysis.
Fig. 1 shows the online monitoring components of the overall system. The VR task presentation engine used the popular game engine Unity (www.unity3d.com) by Unity Technologies. The peripheral psychophysiological monitoring used wireless BioNomadix physiological signals acquisition device by Biopac Inc. (www.biopac.com). The eye tracker employed in the study was the Tobii X120 remote desktop eye tracker by Tobii Technologies (www.tobii.com). In the online interaction phase of the system, eye tracking, physiological, performance and regions of interest (ROI) data were logged for offline processing and analysis.
Fig. 1.
VR-based facial expressions presentation system.
3.1 The Eye Tracking Application
The eye tracker application was developed using Tobii software development kit (SDK). The remote desktop eye tracker, Tobii X120, was used with 120 Hz frame rate that allows a free head movement of 30 × 22 × 30 cm (width × height × depth) at 70 cm distance. Its firmware runs on a server that serves eye tracking data via UDP (user datagram protocol) network sockets. This makes it easier to stream the eye tracking data to multiple applications.
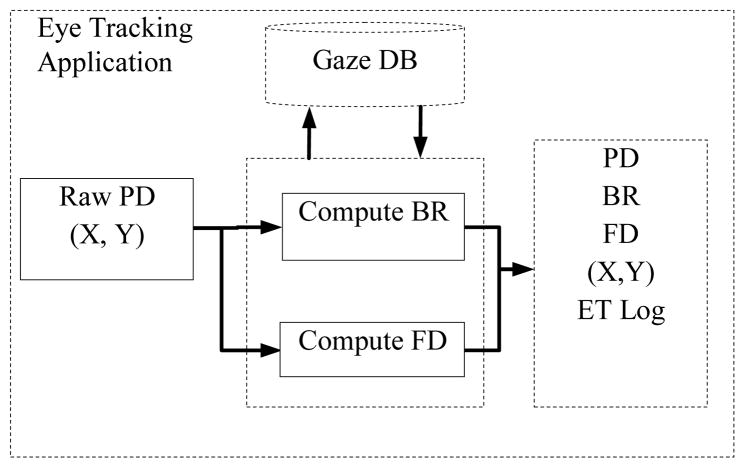
The main eye tracker application computed eye physiological indices (PI) such as pupil diameter (PD) and blink rate (BR) and behavioral indices (BI) [21] such as fixation duration (FD) from raw gaze data. The FD is correlated with attention on a specific region of visual stimuli whereas the eye physiological indices PD and BR are indicative of sensitivity to emotion recognition [21, 31].
For each data point, gaze coordinates (X, Y), PD, BR, and FD were computed and logged together with the whole raw data, trial markers and timestamps. The eye tracker application ran two separate network clients: one to monitor the data visually as the experiment progresses and one to record, pre-process and log the eye tracking data.
Fig. 2 shows details of the eye tracking application and its components in the online recording, pre-processing and logging stage.
Fig. 2.
The Eye tracking application and its components.
The fixation duration computation was based on the velocity threshold identification (I-VT) algorithm [32]. We chose the I-VT algorithm for its robustness and simplicity. The algorithm sets a velocity threshold to classify gaze points into saccade and fixation points. Generally, fixation points are characterized by low velocities (e.g.: < 100 deg/sec) [32]. We used 35 pixels per sample (~60 deg/sec) as our velocity threshold. Spurious fixations processing was not considered in this online interaction phase. Offline postprocessing rejected inadmissible fixations. The blink rate was computed using condition code returned from the eye tracker whereas the pupil diameter was obtained by averaging data from both eyes when both eyes’ data were available, and from only one eye data when the other eye was not in the tracking range.
3.2 The Physiological Monitoring Application
The physiological monitoring application collected 4 channels of physiological data and was developed using the Biopac SDK and BioNomadix wireless physiological acquisition modules with a sampling rate of 1000 Hz. Like the eye tracker application, this application also received trial and session markers from the task presentation application via its embedded client. The physiological signals monitored were: electrocardiogram (ECG), pulse plethesymograph (PPG), skin temperature (SKT), and galvanic skin response (GSR).
Due to the social communication impairments in adolescents with ASD, there are often inherent challenges in having individuals identify, describe, and often display (e.g., nonverbally communicate) specific internal affective states [20]. Physiological signals are, however, not affected by these impairments and can be useful in understanding the internal psychological states of children with ASD [33]. Among the signals we monitored, GSR, PPG, and ECG are directly related to the sympathetic response of the autonomic nervous system (ANS) [34]. When there is increased sympathetic activity due to external factors such as stress, heart rate, blood pressure, and sweating are all elevated [34]. We chose these three signals together with skin temperature to analyze physiological patterns during offline analysis to see pattern differences in the presence of stress. We hypothesised that the children would be subject to less stress when they could identify the emotional expressions correctly as compared to when they misidentify them and consequently would have different physiological responses. We used clustering techniques to investigate if the data from these two sets of trials could be clustered as two separate groups in a feature space and whether they could be labelled with good accuracy when compared to the ground truth. For this particular study, we used clustering as there was no training set available for classification, and also as the primary interest in this study was identifying differences as opposed to classifying each group with actual labels.
3.3 The VR Task Presentation Engine
The development of the virtual reality environment involved a pipeline of design and animation software packages. Characters were customized and rigged in online animation and rigging service, Mixamo (www.mixamo.com), and Autodesk Maya. They were animated in Maya and imported into the Unity game engine for final task presentation.
3.3.1 Character Modeling and Rigging
The characters used in this project were customized in Mixamo to suit the teenage age group targeted for the usability study, i.e., 13–17 years. A total of seven characters including four boys and three girls were selected and customized. Fig. 3 presents three representative characters.
Fig. 3.

Representative characters used in the study.
Each character was rigged with a skeletal structure consisting of 94 bones. Twenty of these bones were involved with the face structure that was used for facial emotional expressions. Since the main focus of this project was displaying facial emotional expressions, greater emphasis was given to the face structure. The face rig was attached to a facial emotional controller using set-driven keys. The rest of the body was controlled by inverse kinematics (IK) controllers, except the fingers in which case direct forward kinematics was employed. Besides the facial rig, due attention was given to the quality of the characters.
3.3.2 Facial Expression Animations and Lip-syncing
Facial emotional expressions and lip-syncing were the major animations of this project. Range of weights were assigned from 0 (no deformation) to 20 (maximum deformation) for each emotional expression. The universally accepted seven emotional expressions proposed by Ekman were used in this project [35]. The expressions are: enjoyment, surprise, contempt, sadness, fear, disgust, and anger. The range of each facial expression had four arousal levels: low, medium, high, and extreme. All the animations were created in Maya using set keys from the set-driven keys because Unity does not currently support any other form of animation import other than set key animations. Each emotional expression was animated from neutral facial expression to the four levels of each emotion. The four levels were chosen by careful evaluation by clinical psychologists involved in this project. Fig. 4 shows two examples of emotional expressions with two arousal levels (medium and high). In addition to these facial expressions, seven phonetic viseme poses were created using the same set-driven key controller technique. The phonemes are L, E, M, A, U, O, and I. These phonemes were used to create lip-synced speech animations for storytelling. The story was used to give context to the emotional expressions as described in section 4. A total of 16 stories were lip-synced for each character.
Fig. 4.
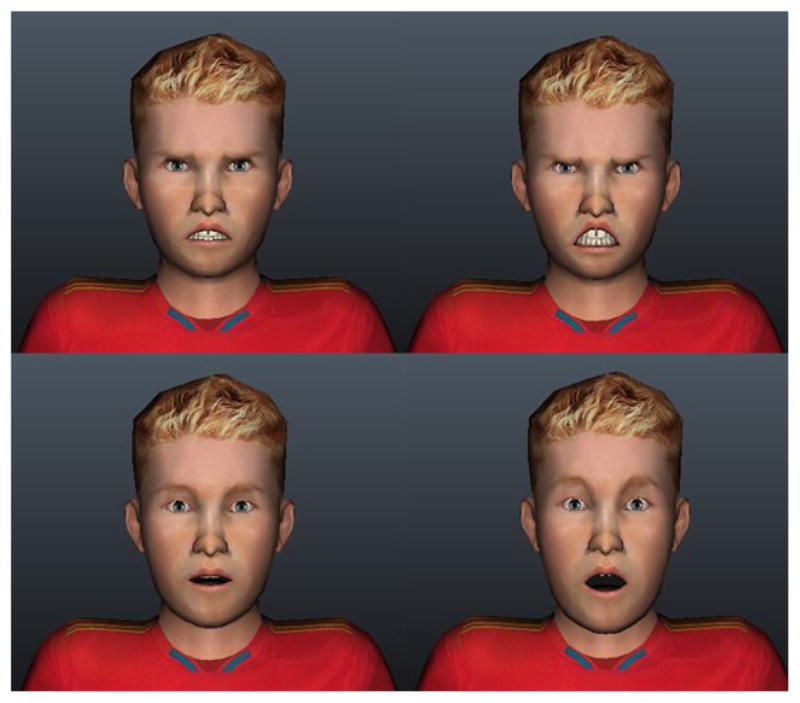
Anger (top) and surprise (bottom) with two arousal levels.
A total of 28 (7 emotional expression × 4 levels of each emotion) animations and 16 story lines lip-synced animations were created. The rigs of each avatar were standardized to make transferring animations easier. All the animations done on one character were then copied to all the remaining characters using attribute copying utility script.
Once all the characters had all the lip-synced animations and all the emotional expression animations resulting in a total of 315 animations, they were batch exported using a utility script into Unity. All the game logic was scripted in Unity as described in Section 4.
3.4 Offline Analysis
The task performance data, the gaze data for each ROI, and the eye tracker and physiology data logs were analyzed offline.
3.4.1 Eye Tracking Data Analysis
The gaze data analysis was performed to determine behavioral viewing patterns of adolescents with ASD as compared to that of their typically developing (TD) peers. The behavioral indices such as where they were looking in terms of screen coordinates were clustered into ROIs defined around the key facial bones. The clustering results were then averaged over trials for each subject and the aggregate results were used to compare where the adolescents with ASD looked on average compared to the TD adolescents. The defined ROIs represented the following regions: forehead, eyes (left and right), nose, and mouth. The face region was modelled by a combination of an ellipsoid and a rectangular forehead region (Fig. 5). Facial regions outside of the 5 defined regions of interest were categorized as “other face regions” while all the background environment regions outside of the face regions were defined as “non-face regions”. This gave a total of seven regions into which all the gaze data points were clustered.
Fig. 5.
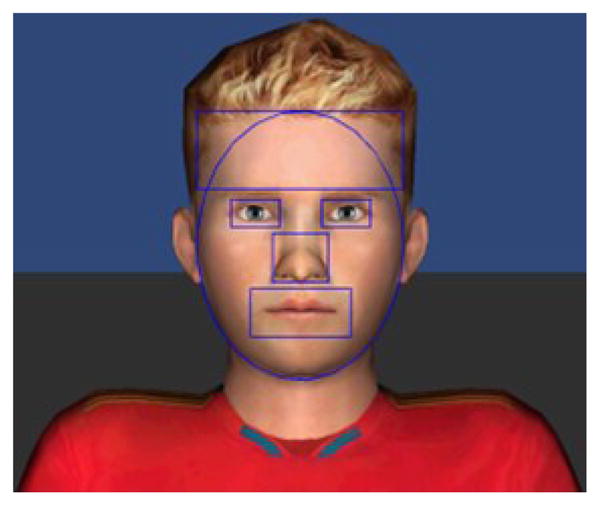
The five facial ROIs defined on the face region.
The other behavioral index considered for analysis was the fixation duration. The raw fixation duration was computed for each gaze point during the online interaction. The raw data was first filtered to remove excessively small and large fixation durations. Typical fixation duration and saccades last between 200 and 600 ms and less than 100 ms, respectively [32]. The filtered fixation duration data was used to compute the average fixation duration (FDave). Another important behavioral eye index associated with fixation duration, called the total sum of fixation counts (SFC), was also computed from the filtered fixation duration data.
The eye physiological indices, i.e., the blink rate and the pupil diameter were also post processed. Missing pupil data due to blinks and presence of noise were filtered from the PD data. The BR data was also filtered based on typical blink ranges. Typical human blinks range between 100 and 200 ms [36]. The PD data were used to reject incorrectly registered blinks at missing data points.
3.4.2 Physiological Pattern Analysis
The collected physiological data was analyzed to decipher any pattern differences between two situations described in Section 3.2, i.e., 1) when the subject correctly identified the emotion, and 2) when he/she did not correctly identify the emotion.
First, the signals were filtered to reject outliers and artifacts and were smoothened. Then, the individual baseline mean was subtracted from the data to remove effects of individual variations. The signals were then standardized to be zero mean and unity standard deviation for further feature extraction. For ECG and PPG, the peaks were detected after baseline wanders removal following the artifact removal.
3.4.3 Feature Extraction
From the four channels of physiological signals collected, i.e., ECG, PPG, SKT and GSR, 16 features were extracted. Table 1 presents all the feature sets used in the physiological analysis. These features were chosen because of their correlation with engagement and emotion recognition process as noted in psychophysiology literature [20, 30, 34]. For example, cardiovascular activities such as inter-bit interval (IBI) represents the rate at which the cardiovascular activity changes and can be used to distinguish arousal levels of an emotion. Electrodermal activity as measured via GSR is indicative of response to external stimuli that might make the subject tense or anxious. The pulse transit time (PTT) is a measure of the time the blood takes to travel from the heart to the finger tips. This specific feature was computed using the peaks of both ECG and PPG signals.
Table 1.
Physiological Feature Sets used in the Study
| Channels | Features | Units |
|---|---|---|
| ECG | Mean IBI | ms |
| SD IBI | N/A | |
|
| ||
| PPG | Mean PTT | ms |
| SD PTT | N/A | |
| Mean IBI | ms | |
| SD IBI | N/A | |
| Mean PPG peak | Micro Volts | |
| Max PPG peak | Micro Volts | |
|
| ||
| GSR | Tonic Mean | Micro Siemens |
| Tonic Slope | Micro Siemens/s | |
| Phasic Response Rate | peaks/s | |
| Phasic Mean Amplitude | Micro Siemens | |
| Phasic Max Amplitude | Micro Siemens | |
|
| ||
| SKT | Mean Temp | Degree Fahrenheit |
| SD Temp | N/A | |
| Temp Slope | Degree Fahrenheit/s | |
IBI: Inter-beat interval
PTT: Pulse transit time
3.4.4 Clustering Analysis
The extracted features were mapped to a lower dimensional space using principal component analysis (PCA). The PCA analysis revealed that only the first 7 components were sufficient to contain 99.9% of the information contained in the original signal and the first 3 projected components constituted more than 90% of the original information contained in the original feature space.
Using the first 2 PCA components, clustering analysis was performed using k-means clustering and Gaussian mixture clustering (GMM). The categories considered were trials when individuals with ASD were correct and when they were incorrect, as well as when TD adolescents were correct and when they were incorrect in identifying the emotions displayed by the avatars. Comparative analysis was performed to see if there was any significant pattern difference between the two sets of trials and two groups, i.e., to see if the physiological pattern of adolescents with ASD was different when they were correctly identifying the emotions compared to when they could not identify the emotions. The same analysis was done for the TD group. The results were compared to the ground truth to determine the accuracy of clustering. Note that these analyses are to show that with the proper choice of learning algorithm, the data set in the feature space could be separable for the two sets of trials within each group as well as across the two groups. This is useful because if the physiological data in the projected space in the presence of external factors (e.g., stress inducing tasks such as the task of identifying emotional faces), they can be used to reduce stress inducing interactions in a future VR task adaptively. For instance, if the subject is feeling stressed interacting with a virtual social peer and the stress can be automatically detected using appropriate learning algorithms, the virtual interaction can be altered in real-time so as to allow the subject to experience less stress.
3.4.5 Objective Performance Metrics
In addition to the eye gaze tracking and physiological data, we also measured objective performance metrics to measure the overall effectiveness of the adolescents in the ASD group in identifying the emotional faces when compared to their typical controls. We measured correctness as percentage of total number of trials, asked how confident they were with their choices and their latency to respond. All these measures were averaged for all trials across subjects and are presented in Section 5.5.
4 Methods and Procedure
A usability study was conducted to validate the system and to study the behavioral and physiological pattern difference of adolescents with ASD and those of typically developing adolescents.
4.1 Experimental Setup
The VR environment ran on Unity. Eye tracking and peripheral physiological monitoring were performed in parallel on separate applications that communicated with the unity-based VR engine via a network interface as described in Section 3. The VR task was presented using a 24″ flat LCD panel monitor. The experiment was performed in a laboratory with two rooms separated by one-way glass windows for caregiver observation. The caregivers sat in the outside room. In the inner room, the subject sat in front of the task computer. A therapist was present in the inner room to monitor the process. The task computer monitor was also routed to the outer room for caregiver observation. The session was video recorded for the whole duration of participation.
4.2 Subjects
A total of 10 high functioning subjects with ASD with average to above average intelligence (Male: n=8, Female: n=2) of ages 13 – 17 (Mean age (M) =14.7, standard deviation (SD) =1.1) and 10 age matched TD controls (Male: n=8, Female: n=2) of ages 13 – 17 y (M=14.6, SD=1.2) were recruited and participated in the usability study. All ASD subjects were recruited through existing clinical research programs and had established clinical diagnosis of ASD. All subjects in the ASD group fell well above the clinical threshold (Table 2). The gold standard in clinical ASD diagnosis, the Autism Diagnostic Observation Schedule-Generic (ADOS-G) current revised algorithm score [37] and the severity score (ADOS-SS), were used to recruit the ASD subjects. IQ of the ASD subjects was obtained from existing clinical research database.
Table 2.
Profile of Subjects in the ASD Group
| Subject (Gender) | Age | ADOS-G (cutoff=7) | ADOS-CSS (cutoff=8) | SRS (cutoff=60) | SCQ (cutoff=15) | IQ |
|---|---|---|---|---|---|---|
| ASD1 (f) | 17 | 9 | 6 | 88 | 23 | 101 |
| ASD2 (m) | 15 | 13 | 8 | 80 | 28 | 115 |
| ASD3 (m) | 14 | 8 | 5 | 80 | 8 | 117 |
| ASD4 (m) | 16 | 15 | 9 | 69 | 25 | 133 |
| ASD5 (m) | 14 | 13 | 8 | 74 | 11 | 121 |
| ASD6 (m) | 13 | 11 | 7 | 82 | 14 | 133 |
| ASD7 (m) | 15 | 13 | 8 | 81 | 16 | 119 |
| ASD8 (f) | 14 | 11 | 7 | 87 | 12 | 125 |
| ASD9 (m) | 14 | 13 | 8 | 77 | 9 | 108 |
| ASD10 (m) | 15 | 14 | 8 | 81 | 26 | 115 |
| Average (SD) | 14.7 (1.1) | 12.0 (2.1) | 7.4 (1.11) | 79.9 (5.34) | 17.78 (7.36) | 118.7 (9.55) |
The control group was recruited from the local community. To ensure control group subjects did not exhibit ASD related symptoms, we asked the parent to complete social responsiveness scale (SRS) [38] and social communication questionnaire (SCQ) [39]. Parents of both groups completed these forms. In addition, the Wechsler Abbreviated Scale of Intelligence (WASI) [40] was used to measure IQ of the TD subjects. The IQ measures were used to potentially screen for intellectual competency to complete the tasks. The profile of the TD subjects is given on Table 3.
Table 3.
Profile of Subjects in the TD Group
| Subject (Gender) | Age | SRS (cutoff=60) | SCQ (cutoff=15) | IQ |
|---|---|---|---|---|
| TD1 (m) | 14 | 41 | 0 | 113 |
| TD2 (m) | 13 | 36 | 0 | 130 |
| TD3 (f) | 17 | 35 | 0 | 110 |
| TD4 (m) | 15 | 39 | 3 | 114 |
| TD5 (m) | 14 | 41 | 6 | 102 |
| TD6 (m) | 14 | 43 | 4 | 90 |
| TD7 (f) | 13 | 36 | 0 | 105 |
| TD8 (m) | 16 | 35 | 3 | 105 |
| TD9 (m) | 15 | 42 | 2 | 115 |
| TD10 (m) | 15 | 45 | 1 | 127 |
| Average (SD) | 14.50 (1.38) | 39.30 (3.44) | 1.90 (1.97) | 111.10 (11.14) |
All the TD subjects were well below the clinical cut-offs for the SRS and the SCQ.
4.3 Tasks
The VR-based facial emotional understanding system presented a total of 28 trials corresponding to the 7 emotional expressions with each expression having 4 levels. Each trial was 30–45 seconds long. For the first 25–40 seconds, the character narrated a lip-synced context story that was linked to the emotional expression that followed for the next 5 seconds. The avatar exhibited a neutral emotional face during storytelling. Subjects were instructed to rate the emotions based on the last 5 seconds of interaction. The story was used to give context to the displayed emotions. The context of the stories ranged from incidents at school to interactions with families and friends that were suitable for the targeted age group.
A typical laboratory visit was approximately one hour long. During the first 15 minutes, a trained therapist read approved assent and consent documents to the subject and the parent, and explained the procedures. Once the subject finished signing the assent document, he/she began the task. While the parent completed the SRS and SCQ forms, the subject wore the wearable physiological sensors with the help of a researcher. Before the task began the eye tracker was calibrated. The calibration was a fast 9 point calibration that took about 10–15 s.
At the start of the task, a welcome screen greeted the subject and described what was about to happen and how the subject was to interact with the system. Immediately after the welcome screen, the trials started. At the end of each trial, questionnaires appeared on screen prompting the subject to label the emotion he/she thought the avatar displayed and how confident he/she was in his/her choice. The total participation time was about 20–25 minutes. The emotional expression presentations were randomized for each subject across trials to avoid ordering effects. To avoid other compounding factors arising from the context of the story, the story was recorded with monotonous tone and there was no facial expression displayed by the avatar during that story telling period.
5 Results
5.1 Gaze Pattern Comparisons
We quantified gaze pattern in percentage as number of gaze points to a specific ROI over total number of gaze points. Comparative analysis was performed to distinguish pattern differences within the ASD and TD groups and across the groups. The pattern difference analysis also compared behavioral gaze pattern differences during the context story telling part of the trial and the last 5 seconds of the trial in which the avatar displayed the facial emotional expressions. We have used statistical significance paired t-test to compare intra group variations and independent two sample unequal variance t-test to compare inter-group variations.
5.1.1 Gaze Comparisons during Emotion Recognition
These results compared the gaze patterns of the ASD group to that of the control group for the last 5 seconds of the trials when the avatar displayed facial emotional expression. Data were averaged across trials for each subject. Statistically significant gaze difference between the two groups was found for the mouth and the forehead ROIs.
The adolescents with ASD looked 11.32% (p<0.05) more towards the forehead area and 12.1% (p<0.05) less to the mouth area than the TD subjects (Fig. 6). Note that both the forehead and the mouth areas were the primarily morphed ROIs in most of the emotional expressions. Adolescents with ASD also looked 5.58% less to the eye area and 1.89% less to the nose area. But these differences were not statistically significant.
Fig. 6.
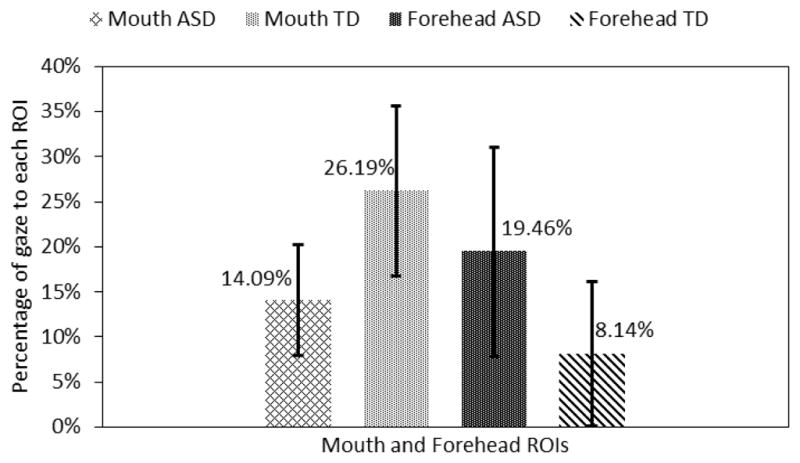
Gaze towards mouth and forehead regions.
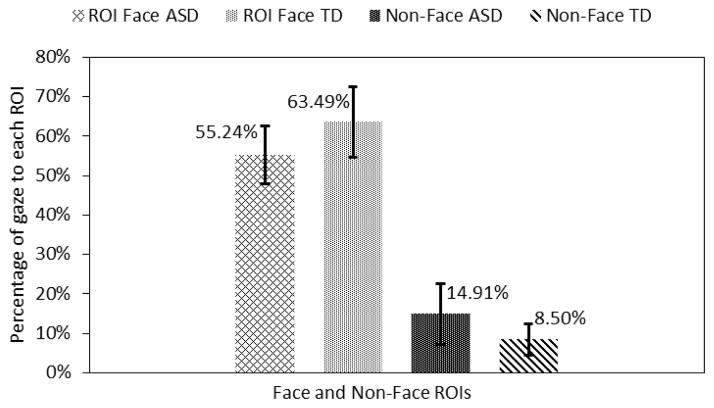
The total face area ROIs (these do not include the face regions that are not marked) were combined and compared with non-face ROIs. Adolescents in the ASD group looked 6.41% (p<0.05) more to the non-face region and they looked 8.25% (p<0.05) less to the combined facial ROIs as compared to the TD control group (Fig. 7).
Fig. 7.
Gaze towards face and non-face regions.
5.1.2 Gaze Comparisons during Story-telling
We also compared the gaze patterns of the ASD group to that of the TD group for the context story telling portion of the trials (Fig. 8). Note that the facial expression of the avatar was neutral during this time. The statistically significant gaze differences between the two groups were found for the mouth and the forehead ROIs.
Fig. 8.
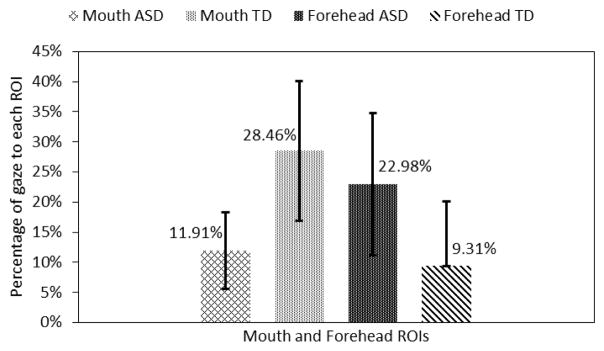
Gaze towards mouth and forehead regions.
The adolescents with ASD looked 13.67% (p<0.05) more towards the forehead area and 16.55% (p<0.05) less to the mouth area than the adolescents in the TD group (Fig. 8). It is interesting to note that similar looking patterns towards the mouth and the forehead area were observed in both emotion recognition and storytelling cases. Adolescents with ASD also looked 1.59% less towards the eyes ROI and 2.39% less to the nose ROI. However, these differences were not statistically significant.
Adolescents in the ASD group looked 6.5% more towards the non-face region and 6.85% less towards the combined facial ROIs as compared to the TD control group (Fig. 9). But, these differences were also not statistically significant.
Fig. 9.
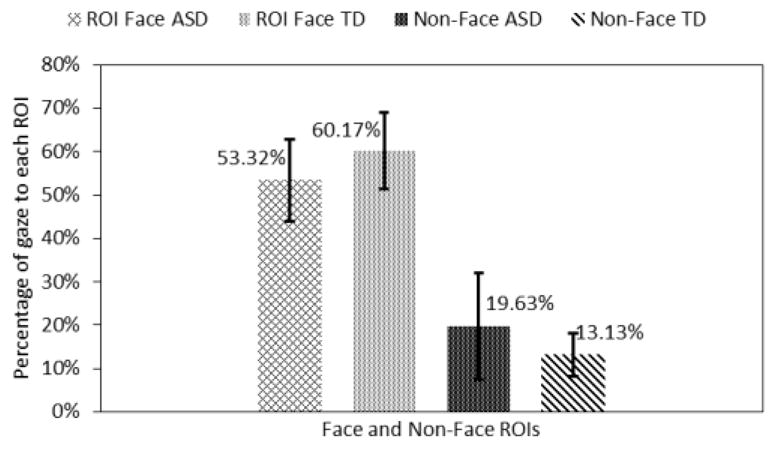
Gaze towards face and non-face regions.
5.1.3 Gaze Comparisons When Subjects Correctly Identified the Emotion
Here we compared the gaze patterns of the ASD group to that of the TD group when both groups correctly identified the emotions displayed by the avatars. Statistically significant gaze difference between the two groups was found only for the mouth ROI. This analysis is performed for the last 5 seconds of the trials when the avatar changed its emotional expression from neutral to a target state.
The adolescents with ASD looked 12.4% more towards the forehead area and 11.6% (p<0.05) less to the mouth area than the adolescents in the TD group (Fig. 10). Further, adolescents with ASD also looked 7.86% less towards the eyes area and 2.51% less to the nose area. But these differences were not statistically significant.
Fig. 10.
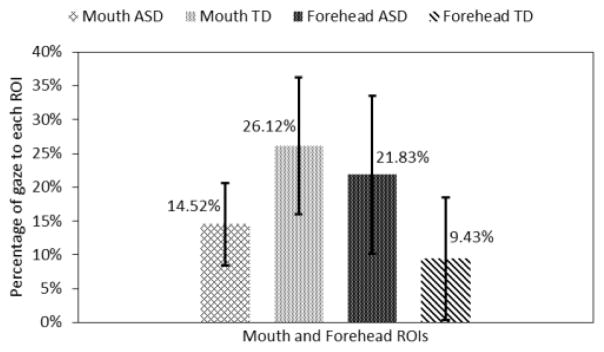
Gaze towards mouth and forehead regions.
Finally, adolescents in the ASD group looked 10.42% (p<0.05) more towards the non-face region and 9.57% (p<0.05) less to the combined facial ROIs as compared to the TD control group (Fig. 11).
Fig. 11.
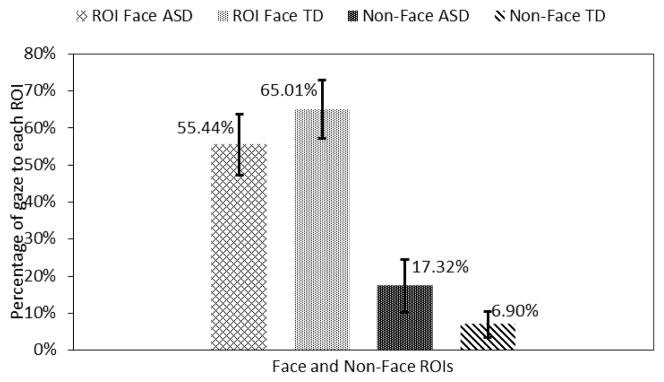
Gaze towards face and non-face regions.
5.1.4 Gaze Comparisons When Subjects Incorrectly Identified the Emotion
Here we compared the gaze patterns of the ASD to that of the TD group when both groups were incorrect in identifying the emotions displayed by the avatars. Statistically significant gaze differences between the two groups were found only for the mouth and forehead ROIs. This analysis is performed for the last 5 seconds of the trials when the avatar changed its emotional expression from neutral to a target state.
The adolescents with ASD looked 10.68% (p<0.05) more towards the forehead area and 13.16% (p<0.05) less towards the mouth area than the adolescents in the TD group (Fig. 12). Further adolescents with ASD also looked 3.2% less towards the eyes area and 1.09% less towards the nose area.
Fig. 12.
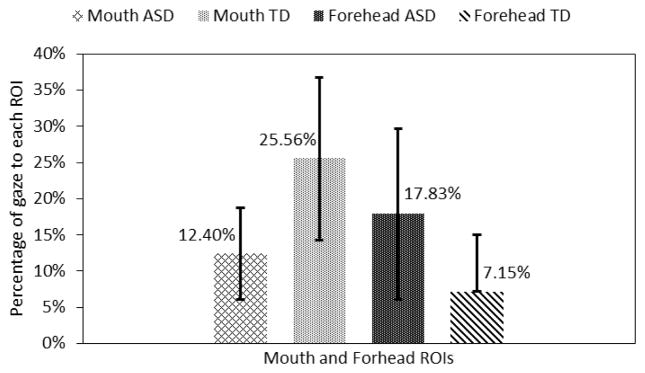
Gaze towards mouth and forehead regions.
Finally, adolescents in the ASD group looked 4.6% more towards the non-face region and 6.76% less towards the combined facial ROIs as compared to the TD control group (Fig. 13). But, these differences were not statistically significant.
Fig. 13.
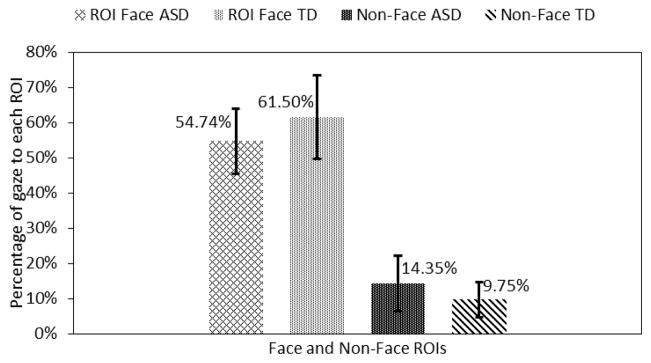
Gaze towards face and non-face regions.
5.1.5 Intra Group Gaze Comparisons
We also performed within group gaze pattern difference analysis for both the ASD and the TD groups between those trials when the adolescents identified the displayed emotion correctly versus those trials when they did not.
The adolescents in the ASD group looked 2.12% (p<0.05) more towards the mouth ROI when they were correct than when they were incorrect while their TD counterparts looked 0.56% more towards the mouth area for same situations. The result of the TD group was not statistically significant. There were variations in other ROIs as well, but none of them were statistically significant.
5.2 Eye Behavioral Indices (BI)
The average fixation duration (FDave) and sum of fixation counts (SFC) are the two measures of behavioral viewing patterns in this study. Section 3.4.1 describes how these indices were computed. These behavioral indices are indicative of engagement to particular stimuli and are correlated with social functioning for individuals with autism [41]. Generally, adolescents in the ASD group had lower FD and SFC than the control group in all the four comparison sections described in section 5.1 (Fig. 14). However, none of them were statistically significant.
Fig. 14.
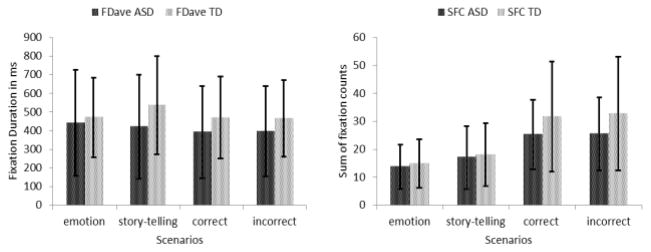
Comparisons of behavioral eye indices.
5.3 Eye Physiological Indices (PI)
The physiological patterns of the eyes of the subjects were represented by the average pupil diameter (PDave) and the average blink rates (BRave). PD is indicative of how engaged a subject is and literature suggests that there are variations of these indices between individuals with ASD and TD individuals [21] given the same stimuli. Individuals with autism were shown to have abnormal eye blink conditioning compared to TD subjects [42]. Generally, adolescents with autism exhibited lower pupil diameter and blink rates in all the four comparison scenarios. Specifically, they had 11.2% (p<0.05) less PD on average than adolescents in the TD group during the emotion display cases. They also showed 57.44% (p<0.05) fewer blinks on average during the story-telling cases and 55.39% (p<0.05) fewer blinks on average when they were incorrectly identifying the emotions compared to their typical counterparts (Fig. 15).
Fig. 15.
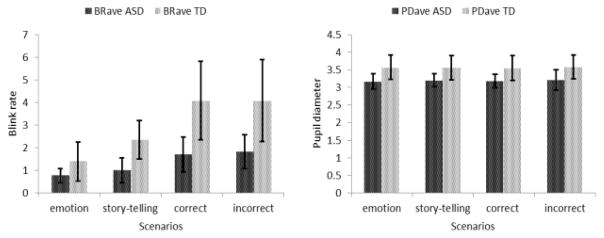
Comparisons of physiological eye indices.
Unlike reported high blink conditioning for individual with ASD in general [42], these low blinks could be attributed to ‘sticky attention’ that this population sometimes exhibits [43].
5.4 Physiological Analysis
As described in Section 3.2, identifying physiological pattern differences when there were external factors such as stress within a social task in which emotion identification is a part, is of particular importance for the development of an affective state detection system for a future adaptive VR social interactive task. To investigate if the differences in physiological patterns are strong enough to be classified by supervised training methods for online classification, we used unsupervised clustering. If a feature space is separable using unsupervised methods, this may imply that there is sufficient pattern to be learned by supervised algorithms to classify the data accordingly. For this purpose, the physiological data of the adolescents in both groups was separated into data from trials when the adolescents were correct and trials when they were incorrect in identifying the displayed emotion. The combinations of these four dataset wre clustered using k-means and Gaussian mixture (GM) clustering methods using two datasets at a time. This resulted in four comparisons. The ground truths were two pair of classes of ASD group correct, TD group correct, ASD group incorrect and TD group incorrect. In both algorithms the data was first clustered into four clusters and the four clusters were re-clustered back to two clusters. Then the accuracy was computed between the clustering result and the ground truth to measure how well a machine learning algorithm could differentiate between these physiological data of ASD and TD groups. Accuracy here represents cluster quality.
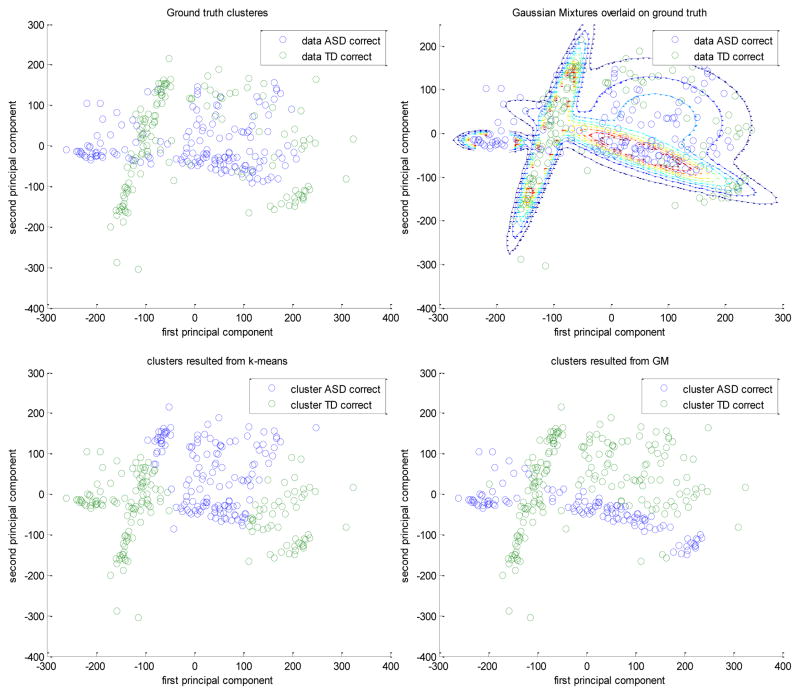
The k-means and the GM achieved accuracies of 55.36% and 57.5%, respectively, separating the data of adolescents with ASD when they were correct from when they were incorrect. On the other hand, the two algorithms were able to separate those of the TD group with accuracies of 55% and 71.43%, respectively. For the across group comparison, when both groups were incorrect the k-means and the GM clustered the data, with accuracies 53.17% and 73.81%, respectively, while they separated the data when both groups were correct, with accuracies of 61.36% and 73.38%, respectively. Fig. 16 shows an example for the case when both groups were correctly identifying the displayed emotions. It shows the original ground truth clusters (a), the Gaussian mixtures overlaid on top of the original ground truth clusters (b), the result of k-means clustering (c), and the result of GM clustering (d), when both groups were correct. Note that the four Gaussian mixtures (b) were used to first cluster the data into four preliminary clusters and finally they were re-clustered to give just two clusters (d) as the original ground truth clusters. Although, the within pattern differences of the ASD group was less than the TD group, the results indicated that there were distinguishable physiological pattern differences between the physiological responses in these two task situations.
Fig. 16.
(a) Top left: original ground truth clusters. (b) Top right: the Gaussian mixtures used in the GM clustering overlaid on the ground truth clusters. (c) Bottom left: the result of the k-mean clustering. (d) Bottom right: the result of GM clustering.
Based on the analysis, it is observed that k-means clustering qualities were not as good as those of the Gaussian mixture clustering. In Fig. 16, the GM clusters (d) more closely resemble the original clusters (a) as compared to the k-means clusters (c). For this analysis, the first two PCA components, which represent more than 80% of the original 16 features data set, were used. Results from ten iterations were averaged.
A more robust clustering algorithm such as hierarchical clustering might result in better clusters than even the GM clusters. Projecting the features using kernels could also be another alternative to increase cluster quality.
In general, these results indicate that there are clear pattern differences in physiological responses of adolescents with ASD while performing social tasks such as identifying emotional faces. Given enough training data, these pattern differences can be learned using supervised non-linear classifiers to enable adaptive VR-based social interaction in the future. Liu et al. [19], for instance, showed that it is possible to use such physiological measures to create an adaptive closed-loop robotic interaction in real-time using support vector machines (SVM) with Gaussian kernels.
5.5 Performance
Performance was measured using three metrics as described in Section 3.4.5. Their total score was computed as a percentage of the total trials. They were also given a questionnaire to indicate how confident they were in their choices immediately after they made their choices. Response time was also considered as a performance metric and calculated as latency of response. Table 4 shows these objective performance metrics for both groups averaged across trials and subjects.
Table 4.
Performance comparisons
| Measures | ASD | TD | ||
|---|---|---|---|---|
| Ave | SD | Ave | SD | |
| % score | 58.21% | 9.40% | 51.79% | 12.80% |
| % confidence | 75.52% | 10.14% | 90.09% | 5.45% |
| latency (sec) | 11 | 4 | 7 | 1 |
The average score of the adolescents with ASD was 6.42% higher than the adolescents in the TD group while they were 14.57% (p<0.05) less confident in their choices and took 4 seconds (p<0.05) more than the control group (Table 4). However, the performance score differences were not statistically significant. The low score in both groups was due to the apparent high misclassification of the emotion contempt as disgust and surprise as fear and vice versa. These patterns were observed for both groups. We also performed a rating by a group of typical college students and they too highly misclassified the above-mentioned emotions. Therefore, a part of these low scores can be attributed to the design limitations of these emotion expressions as opposed to the inability of the adolescents to identify the emotions.
6 Discussion and Conclusion
We have developed a VR-based controllable facial expression presentation system that was able to collect eye tracking and peripheral psychophysiological data while the subjects were involved in emotion recognition tasks. Specifically, we developed controllable levels of facial expressions of emotion based on longstanding research documenting certain universal expression patterns [35] as well as a desktop virtual reality presentation to avoid issues and sensitivities individuals with ASD exhibit with immersive virtual reality displays such as head mounted displays (HMD) [44]. Subsequently, a usability study involving 10 adolescents with ASD and 10 typical controls was performed to evaluate the efficacy of the system as well as to study behavioral and physiological pattern differences in how individuals processed different valences of these expressions. Although, this particular study did not employ direct interaction between the user and the system, the study is a precursor to a more interactive adaptive multimodal VR social platform that is under development. Such capabilities are expected to be useful in understanding the underlying heterogeneous deficits individuals with ASD often display in processing and responding to nonverbal communication of others. In turn, such a system will hopefully contribute to the development of novel intervention paradigms capable of harnessing these technological advancements to improve such impairments in a powerful, individually specific manner.
The system successfully presented the facial emotional expressions and collected the synchronized eye gaze and physiological data. Results indicated interesting differences in performance regarding identification of certain emotions as well as differences in how individuals with ASD often processed emotions. With regard to performance two pairs of emotional expressions, i.e., contempt and disgust as well as fear and surprise were often confusing for subjects to successfully discriminate. In preliminary ratings of these emotions during our development phase, an independent group of college students found similar problems regarding these pairs of emotion. One potential explanation of this confusion and challenge in discriminating these universal faces within system construction may be related to flexible limits of expression utilized in the current study. All the emotional expressions were developed using taped actor performances. The key facial regions such as eye brows, the mouth, and the cheek area were manipulated based on the benchmark variations in those regions of the taped performances. A total of 20 facial bones were employed to make the emotional expressions realistic. However, there were some limitations on the extent to which the facial bone rigs could manipulate the key skin areas and in some cases extreme levels of certain emotions it resulted in unnatural and ambiguous mesh deformations. Subsequent system refinement may enhance such discrimination. Results also demonstrated that extreme and low levels of emotions were hard to be detected by both groups, whereas the medium and high arousal levels were reliably identified in most cases. This also suggests more flexible methods for driving key naturalistic variation in expressions may be necessary for creating a system that presses appropriately for a fuller range of expression recognition in this population.
Results did not suggest powerful differences between our ASD and TD groups in emotion recognition. In fact, in some instances individuals with ASD recognized expressions with greater accuracy than the TD group. While this was somewhat surprising given that individuals with ASD often have potent impairments regarding nonverbal communication, it is not entirely inconsistent with existing literature. Other researchers have found that individuals with ASD, particularly those with average to above average intelligence as in our sample, can often be taught to accurately identify basic static emotions. However, often individuals with ASD still struggle with integration of this recognition skill in fluid interaction across environments. In this capacity while we did not find performance differences between the ASD and TD groups, we did in fact find interesting differences in how facial expressions were processed and decoded across between these groups. Specifically, there were significant eye gaze differences in the mouth and the forehead area with adolescents with ASD paying significant attention to context irrelevant area such as the forehead while the TD group focused more on the context relevant ROI such as the mouth. Adolescents in the ASD group also paid less attention to the eye area than the TD group on average, although these differences were not statistically significant. Importantly, in this particular study, all the animations did not manipulate the eye areas and hence the eyes were static in many instances and thus attracted less attention which may explain why a bias may not have been evident in this region. Another interesting finding regarding face processing was that adolescents with ASD spent much more time examining faces prior to response and they were often less confident in their ratings. Finally, although our system was not designed to map specific physiological responses, our offline analysis demonstrated that meaningful physiological pattern differences could be detected during system performance. Such differences may be potentially modelled onto constructs of stress and engagement over time in order to further enhance and endow our system with the ability to understand processing and performance.
In combination, these findings suggest our system was able to elicit and drive meaningful differences related to how individuals processed information from faces. Such capabilities are expected to be useful in understanding the underlying heterogeneous deficits individuals with ASD often display in processing and responding to nonverbal communication of others. In turn, such a system will hopefully contribute to the development of novel intervention paradigms capable of harnessing these technological advancements to improve such impairments in a powerful and individually specific manner.
Although these findings are promising there are several important limitations to note. First, this was a static performance driven system, and physiological indices were not incorporated into online performance or modification. Further, our design of the emotional expressions, while based on decades of research and theory, was not adequately able to push for accurate identification of certain emotions across groups. Finally, while the system created some sense of a social scenario, such interactions were very limited in the application. Despite limitations this initial study demonstrates the value of future work subtly adjusting emotional expressions, integrating this platform into more relevant social paradigms, and embedding online physiological and gaze data to guide interactions with potential relevance toward fundamentally altering and improving how individuals with ASD process nonverbal communication within and hopefully far beyond VR environments.
Acknowledgments
This work was supported in part by the National Science Foundation Grant [award number 0967170] and the National Institute of Health Grant [award number 1R01MH091102-01A1]. We would like to thank all colleagues that helped in evaluating the avatars and the expressions. We give special thanks to all subjects and their family.
Footnotes
For information on obtaining reprints of this article, please send to: tvcg@computer.org.
Contributor Information
Esubalew Bekele, Email: esubalew.bekele@vanderbilt.edu, EECS Department, Vanderbilt University.
Zhi Zheng, Email: zhi.zheng@vanderbilt.edu, Electrical Engineering and Computer Science Department, Vanderbilt University.
Amy Swanson, Email: amy.r.swanson @vanderbilt.edu., Treatment and Research in Autism Disorders (TRIAD), Vanderbilt University.
Julie Crittendon, Email: julie.a.crittendon@vanderbilt.edu, Department of Pediatrics and Psychiatry, Vanderbilt University.
Zachary Warren, Email: zachary.e.warren@vanderbilt.edu, Department of Pediatrics and Psychiatry, Vanderbilt University.
Nilanjan Sarkar, Email: nilanjan.sarkar@vanderbilt.edu, Mechanical Engineering Department, Vanderbilt University.
References
- 1.Diagnostic and Statistical Manual of Mental Disorders: Quick reference to the diagnostic criteria from DSM-IV-TR. Washington, DC: American Psychiatric Association, Amer Psychiatric Pub Incorporated; 2000. [Google Scholar]
- 2.Baio J, Autism DDM Network, C. f. D. Control, and Prevention. Prevalence of Autism Spectrum Disorders-Autism and Developmental Disabilities Monitoring Network, 14 Sites, United States, 2008. National Center on Birth Defects and Developmental Disabilities, Centers for Disease Control and Prevention (CDC), US Department of Health and Human Services; 2012. [Google Scholar]
- 3.Chasson GS, Harris GE, Neely WJ. Cost comparison of early intensive behavioral intervention and special education for children with autism. Journal of Child and Family Studies. 2007;16(3):401–413. [Google Scholar]
- 4.Ganz ML. The lifetime distribution of the incremental societal costs of autism,” Archives of Pediatrics and Adolescent Medicine. Am Med Assoc. 2007;161(4):343–349. doi: 10.1001/archpedi.161.4.343. [DOI] [PubMed] [Google Scholar]
- 5.Newschaffer CJ, Curran LK. Autism: an emerging public health problem. Public Health Reports. 2003;118(5):393–399. doi: 10.1093/phr/118.5.393. [DOI] [PMC free article] [PubMed] [Google Scholar]
- 6.Adolphs R, Sears L, Piven J. Abnormal processing of social information from faces in autism. Journal of Cognitive neuroscience. 2001;13(2):232–240. doi: 10.1162/089892901564289. [DOI] [PubMed] [Google Scholar]
- 7.Castelli F. Understanding emotions from standardized facial expressions in autism and normal development. Autism. 2005;9(4):428–449. doi: 10.1177/1362361305056082. [DOI] [PubMed] [Google Scholar]
- 8.Dawson G, Webb SJ, McPartland J. Understanding the nature of face processing impairment in autism: Insights from behavioral and electrophysiological studies. Developmental neuropsychology. 2005;27(3):403–424. doi: 10.1207/s15326942dn2703_6. [DOI] [PubMed] [Google Scholar]
- 9.Capps L, Yirmiya N, Sigman M. Understanding of Simple and Complex Emotions in Non-retarded Children with Autism. Journal of Child Psychology and Psychiatry. 1992;33(7):1169–1182. doi: 10.1111/j.1469-7610.1992.tb00936.x. [DOI] [PubMed] [Google Scholar]
- 10.Weeks SJ, Hobson RP. The salience of facial expression for autistic children. Journal of Child Psychology and Psychiatry. 1987;28(1):137–152. doi: 10.1111/j.1469-7610.1987.tb00658.x. [DOI] [PubMed] [Google Scholar]
- 11.Hobson RP. The autistic child’s appraisal of expressions of emotion. Journal of Child Psychology and Psychiatry. 1986;27(3):321–342. doi: 10.1111/j.1469-7610.1986.tb01836.x. [DOI] [PubMed] [Google Scholar]
- 12.Bauminger N. The facilitation of social-emotional understanding and social interaction in high-functioning children with autism: Intervention outcomes. Journal of autism and developmental disorders. 2002;32(4):283–298. doi: 10.1023/a:1016378718278. [DOI] [PubMed] [Google Scholar]
- 13.Goodwin MS. Enhancing and Accelerating the Pace of Autism Research and Treatment. Focus on Autism and Other Developmental Disabilities. 2008;23(2):125–128. [Google Scholar]
- 14.Lahiri U, Bekele E, Dohrmann E, Warren Z, Sarkar N. Design of a Virtual Reality based Adaptive Response Technology for Children with Autism. IEEE transactions on neural systems and rehabilitation engineering: a publication of the IEEE Engineering in Medicine and Biology Society. 2012;(99):1. doi: 10.1109/TNSRE.2012.2218618. PP (early access) [DOI] [PMC free article] [PubMed] [Google Scholar]
- 15.Standen PJ, Brown DJ. Virtual reality in the rehabilitation of people with intellectual disabilities: review. Cyberpsychology & behavior. 2005;8(3):272–282. doi: 10.1089/cpb.2005.8.272. [DOI] [PubMed] [Google Scholar]
- 16.Tartaro A, Cassell J. Towards Universal Usability: Designing Computer Interfaces for Diverse User Populations. Chichester, UK: 2006. Using virtual peer technology as an intervention for children with autism; pp. 231–262. [Google Scholar]
- 17.Kenny P, Parsons T, Gratch J, Leuski A, Rizzo A. Virtual patients for clinical therapist skills training. Intelligent Virtual Agents. 2007:197–210. [Google Scholar]
- 18.Mitchell P, Parsons S, Leonard A. Using virtual environments for teaching social understanding to 6 adolescents with autistic spectrum disorders. Journal of autism and developmental disorders. 2007;37(3):589–600. doi: 10.1007/s10803-006-0189-8. [DOI] [PubMed] [Google Scholar]
- 19.Liu C, Conn K, Sarkar N, Stone W. Physiology-based affect recognition for computer-assisted intervention of children with Autism Spectrum Disorder. International Journal of Human-Computer Studies, Elsevier. 2008;66(9):662–677. [Google Scholar]
- 20.Liu C, Conn K, Sarkar N, Stone W. Online affect detection and robot behavior adaptation for intervention of children with autism. Robotics, IEEE Transactions on. 2008;24(4):883–896. [Google Scholar]
- 21.Lahiri U, Warren Z, Sarkar N. Design of a Gaze-Sensitive Virtual Social Interactive System for Children With Autism. IEEE Transactions on Neural Systems and Rehabilitation Engineering. 2011;19(4):443–452. doi: 10.1109/TNSRE.2011.2153874. [DOI] [PMC free article] [PubMed] [Google Scholar]
- 22.Parsons S, Cobb S. State-of-the-art of Virtual Reality technologies for children on the autism spectrum. European Journal of Special Needs Education. 2011;26(3):355–366. [Google Scholar]
- 23.Josman N, Ben-Chaim HM, Friedrich S, Weiss PL. Effectiveness of virtual reality for teaching street-crossing skills to children and adolescents with autism. International Journal on Disability and Human Development. 2011;7(1):49–56. [Google Scholar]
- 24.Schmidt C, Schmidt M. Three-dimensional virtual learning environments for mediating social skills acquisition among individuals with autism spectrum disorders. Proceedings of the 7th international conference on Interaction design and children; 2008. pp. 85–88. [Google Scholar]
- 25.Wang M, Reid D. Virtual Reality in Pediatric Neurorehabilitation: Attention Deficit Hyperactivity Disorder, Autism and Cerebral Palsy. Neuroepidemiology. 2011;36(1):2–18. doi: 10.1159/000320847. [DOI] [PubMed] [Google Scholar]
- 26.Fabri M, Elzouki SYA, Moore D. Emotionally expressive avatars for chatting, learning and therapeutic intervention. Human-Computer Interaction. HCI Intelligent Multimodal Interaction Environments. 2007:275–285. [Google Scholar]
- 27.Gal E, Bauminger N, Goren-Bar D, Pianesi F, Stock O, Zancanaro M, Weiss PL. Enhancing social communication of children with high-functioning autism through a co-located interface. AI & Society. 2009;24(1):75–84. [Google Scholar]
- 28.Bauminger N, Goren-Bar D, Gal E, Weiss P, Kupersmitt J, Pianesi F, Stock O, Zancanaro M. Enhancing social communication in high-functioning children with autism through a co-located interface. Multimedia Signal Processing. IEEE 9th Workshop on; 2007. pp. 18–21. [Google Scholar]
- 29.Ruble LA, Robson DM. Individual and environmental determinants of engagement in autism. Journal of autism and developmental disorders. 2007;37(8):1457–1468. doi: 10.1007/s10803-006-0222-y. [DOI] [PubMed] [Google Scholar]
- 30.Welch KC, Lahiri U, Warren Z, Sarkar N. An approach to the design of socially acceptable robots for children with autism spectrum disorders. International Journal of Social Robotics. 2010;2(4):391–403. [Google Scholar]
- 31.Anderson CJ, Colombo J, Shaddy DJ. Visual scanning and pupillary responses in young children with autism spectrum disorder. Journal of Clinical and Experimental Neuropsychology. 2006;28(7):1238–1256. doi: 10.1080/13803390500376790. [DOI] [PubMed] [Google Scholar]
- 32.Salvucci DD, Goldberg JH. Identifying fixations and saccades in eye-tracking protocols. Proceedings of the 2000 symposium on Eye tracking research & applications; 2000. pp. 71–78. [Google Scholar]
- 33.Groden J, Goodwin MS, Baron MG, Groden G, Velicer WF, Lipsitt LP, Hofmann SG, Plummer B. Assessing cardiovascular responses to stressors in individuals with autism spectrum disorders. Focus on Autism and Other Developmental Disabilities. 2005;20(4):244–252. [Google Scholar]
- 34.Cacioppo JT, Tassinary LG, Berntson GG. Handbook of psychophysiology. Cambridge Univ Pr; 2007. [Google Scholar]
- 35.Ekman P. Facial expression and emotion. American Psychologist. 1993;48(4):384. doi: 10.1037//0003-066x.48.4.384. [DOI] [PubMed] [Google Scholar]
- 36.Shiffman H. sensation and perception: An Integrated Approach. John Welsly and Sons; New York: 2001. Fundamental visual functions and phenomena; pp. 89–115. [Google Scholar]
- 37.Gotham K, Risi S, Pickles A, Lord C. The Autism Diagnostic Observation Schedule: revised algorithms for improved diagnostic validity. Journal of Autism and Developmental Disorders. 2007;37(4):613–627. doi: 10.1007/s10803-006-0280-1. [DOI] [PubMed] [Google Scholar]
- 38.Constantino J, Gruber C. The social responsiveness scale. Los Angeles: Western Psychological Services; 2002. [Google Scholar]
- 39.Rutter M, Bailey A, Lord C, Berument S. Social communication questionnaire. Los Angeles, CA: Western Psychological Services; 2003. [Google Scholar]
- 40.Wechsler D. Wechsler Abbreviated Scale of Intelligence®. 4. San Antonio, TX: Harcourt Assessment, The Psychological Corporation; 2008. (WASI®-IV) [Google Scholar]
- 41.Klin A, Jones W, Schultz R, Volkmar F, Cohen D. Visual fixation patterns during viewing of naturalistic social situations as predictors of social competence in individuals with autism. Archives of general psychiatry. 2002;59(9):809. doi: 10.1001/archpsyc.59.9.809. [DOI] [PubMed] [Google Scholar]
- 42.Sears LL, Finn PR, Steinmetz JE. Abnormal classical eye-blink conditioning in autism. Journal of autism and developmental disorders. 1994;24(6):737–751. doi: 10.1007/BF02172283. [DOI] [PubMed] [Google Scholar]
- 43.Landry R, Bryson SE. Impaired disengagement of attention in young children with autism. Journal of Child Psychology and Psychiatry. 2004;45(6):1115–1122. doi: 10.1111/j.1469-7610.2004.00304.x. [DOI] [PubMed] [Google Scholar]
- 44.Harris K, Reid D. The influence of virtual reality play on children’s motivation. Canadian Journal of Occupational Therapy. 2005;72(1):21–30. doi: 10.1177/000841740507200107. [DOI] [PubMed] [Google Scholar]


