Abstract
The protonation state of oxo-bridges in nature is of profound importance for a variety of enzymes, including the Mn4CaO5 cluster of Photosystem II and the Mn2O2 cluster in Mn catalase. A set of dinuclear bis-μ-oxo-bridged MnIV complexes in different protonation states was studied by Kβ emission spectroscopy to form the foundation for unraveling the protonation states in the native complex. The valence-to-core regions (valence-to-core XES) of the spectra show significant changes in intensity and peak position upon protonation. DFT calculations were performed to simulate the valence-to-core XES spectra and to assign the spectral features to specific transitions. The Kβ2,5 peaks arise primarily from the ligand-2p to Mn-1s transitions, with a characteristic low energy shoulder appearing upon oxo-bridge protonation. The satellite Kβ″ peak provides a more direct signature of the protonation state change, since the transitions originating from the 2s orbitals of protonated and unprotonated μ-oxo-bridges dominate this spectral region. The energies of the Kβ″ features differ by ~ 3 eV and thus are well resolved in the experimental spectra. Additionally, our work explores the chemical resolution limits of the method, namely, whether a mixed (μ-O)(μ-OH2) motif can be distinguished from a symmetric (μ-OH)2 one. The results reported here highlight the sensitivity of Kβ valence-to-core XES to single protonation state changes of bridging ligands, and form the basis for further studies of oxo-bridged polymetallic complexes and metallo-enzyme active sites. In a complementary paper, the results from X-ray absorption spectroscopy of the same MnIV-dimer series are discussed.
Keywords: X-RAY EMISSION SPECTROSCOPY, MN DIMERS, OEC, METALLOPROTEIN, DFT
INTRODUCTION
Protonation states of oxo-bridging and terminal ligands (O2−, OH−, OH2) often control catalytic function in inorganic and bioinorganic catalysts, by modulating the charge density distribution between the metals and ligands, the pKa of bound water/hydroxide, and the covalency between metals and ligands. Examples of such systems include catalysts involved in O2 association and dissociation reactions. In the hydrogen peroxide disproportionation reaction, catalyzed by Mn catalase, oxo-bridges undergo protonation and deprotonation events that are essential to their physiological function, and certain protonation states are known to inhibit the catalytic reaction.1,2 In the water-oxidation reaction catalyzed by the Mn4CaO5 cluster in Photosystem II, protonation state changes in the bridging oxygen (μ-oxo or μ-hydroxo) and/or a terminal substrate water as aqua or hydroxo have been proposed during the four electron redox chemistry.3–5
More generally, protonation/deprotonation reactions of metal centers in biology are now recognized as important processes that moderate reaction chemistry. For example, copper oxo/hydroxo/peroxo complexes play vital roles in respiration, such as in hemocyanin,6 in biological metabolic pathways such as catechol oxidase activity7 or activation of aliphatic C-H bonds by do-pamine β-monooxygenase, peptidyl-glycine α-amidating enzyme, and particulate methane monooxygenase.8 Another important reaction is the reduction of ribonucleotides to the deoxy form in ribonucleotide reductase catalyzed by the FeFe or FeMn cluster, in which the O2 activation by the FeMn cluster may be accompanied by the protonation state changes at the bridging oxygen.9 It is also known that FeFe clusters in soluble methane monooxygenase catalyze the hydroxylation of methane to methanol.10–14 Understanding these events requires techniques that are sensitive enough to differentiate species that differ only by a single proton.
Numerous small molecule mimics exist in the literature for these biological systems.15 Model compounds assessing the properties and reactivities of MnIV-OH and MnIV=O as well as FeIV-OH and FeIV=O species have been reported by several groups.16,17,18,19,20,21 Que and co-workers have examined Fe complexes that are remarkable for their H-atom abstraction capabilities.22,23 In some systems, it is possible to resolve the protonation state of oxo bridged species through single-crystal X-ray crystallography6 where unusually long or short M-O and M-OH bonds have been reported.14,24 However, the chemical assignment of these unusual bond distances and associated protonation states is not always straightforward and could be further strengthened using a technique that has more direct sensitivity to the protonation event.
Several techniques have the potential to detect a single protonation event, while few of them can directly and selectively probe the protons in the first coordination sphere of a transition metal ion. Potential methods include vibrational spectroscopy25 and ligand sensitive EPR techniques such as ENDOR (electron nuclear double resonance), ESEEM (electron spin echo envelope modulation), and HYSCORE (hyperfine sub-level correlation).26,27 The advantage of X-ray-based methods over EPR techniques is their element specificity and that they are not restricted by the spin states of the compounds.
In the complementary two papers28 we explore the sensitivity of both X-ray absorption (XAS) and X-ray emission spectroscopy (XES) to changes in ligand protonation state. XAS can serve as an indirect probe of the protonation state through changes in local symmetry and metal-ligand bond distances at the catalytic site.29 The assignment of protonation states by XAS is further strengthened by close correlation to theory, as explored in the preceding paper.28
XES is complementary to XAS and provides a direct probe of the filled molecular orbitals. In a Kβ XES spectrum, the “main line” features, Kβ1,3 and Kβ′, correspond to a transition from a metal 3p orbital to a metal 1s hole (Figure 1). Due to a strong contribution from 3p-3d exchange contribution, this region of the spectrum is dominantly influenced by the number of unpaired spins of the metal and hence its oxidation and/or spin state. To higher energy is the valence-to-core region (or also called Kβ2,5 and Kβ″ features, Figure 1). These features correspond primarily to transitions from ligand 2p and 2s orbitals, respectively, and as such contain direct information about the ligand identities.30–36
Figure 1.
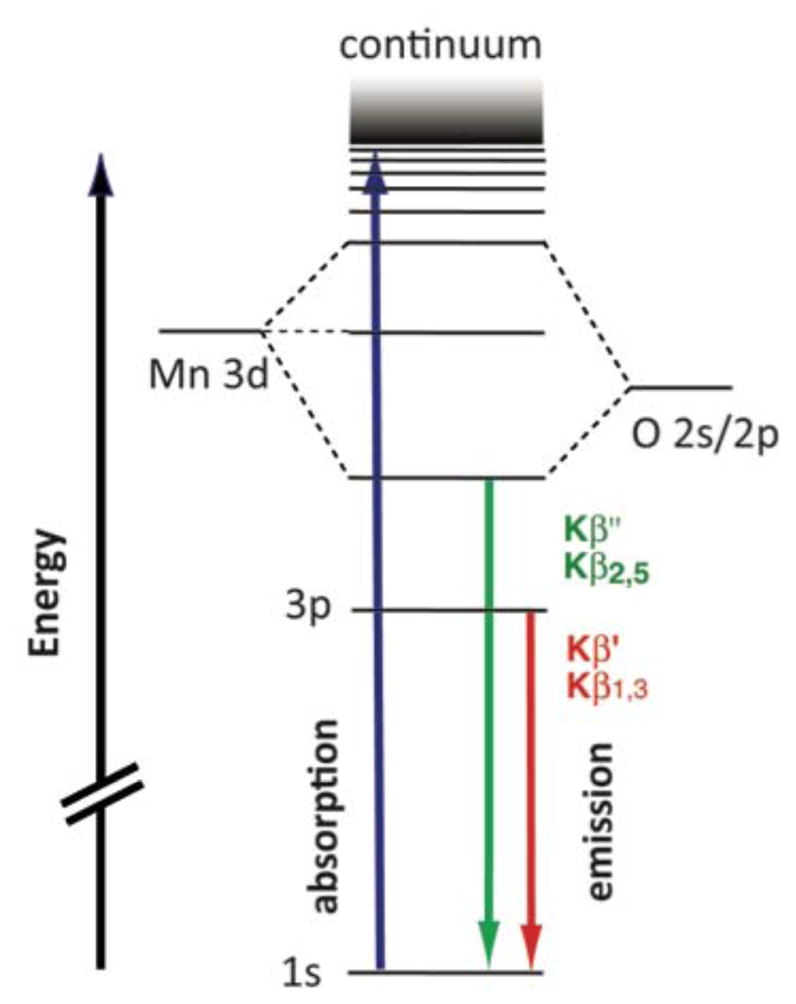
Energy diagram representing the X-ray absorption and emission phenomena at the K-edge of Mn. Blue arrow: absorption of a photon, exciting a 1s-electron into the continuum, leaving a 1s-hole. Green arrow: relaxation of ligand 2s/2p electron into the 1s-hole, emitting a photon in the Kβ ″ or Kβ2,5 energy range. Red arrow: relaxation of a metal 3p electron into the 1s-hole, emitting a photon in the Kβ′ or Kβ1,3 energy range.
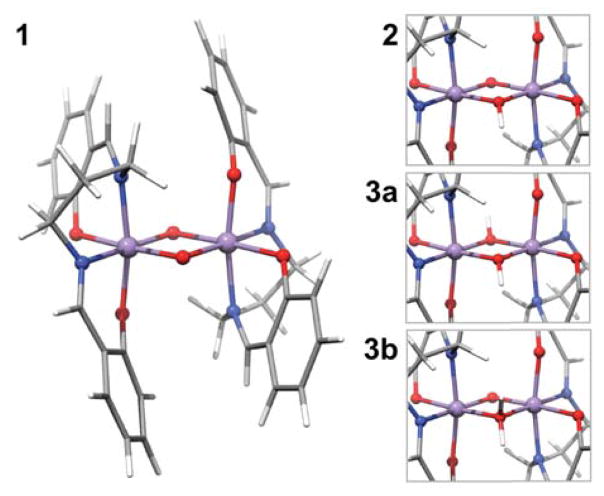
In this work, the use of XES as a sensitive probe of single protonation events at bridging oxygen atoms is explored. A set of homologous dinuclear MnIV complexes that were initially synthesized by Baldwin et al.,29 in which the protonation state of the bridging oxygen atoms was changed systematically is used as a test set (see Figure 2, Chart 1). This series serves as a model system to study the nature of protonation state changes in oxo-bridges. A combination of XES data and DFT calculations provides a detailed understanding of the origin of valence-to-core emission peaks, making XES an important tool to resolve protonation states of bridging oxygen atoms in biological catalysts. The technique also allows us to differentiate between two possible structures for the doubly protonated species, namely a bis-μ-hydroxo vs. a μ-oxo-μ-aqua bridged complex (Chart 1). Although a symmetric doubly protonated bridging motif is chemically more reasonable, we wish to explore the ability of valence-to-core XES and the accompanying DFT calculations to distinguish between these isomers. Such aquo units have been formulated recently as bridging motifs for the Mn4CaO5 core of the OEC.37
Figure 2.
Fully optimized structure of 1 and details of the protonated cores of 2, 3a and 3b. Color code for the atoms as follows: Mn purple, O red, N blue, C grey, H white.
Chart 1.
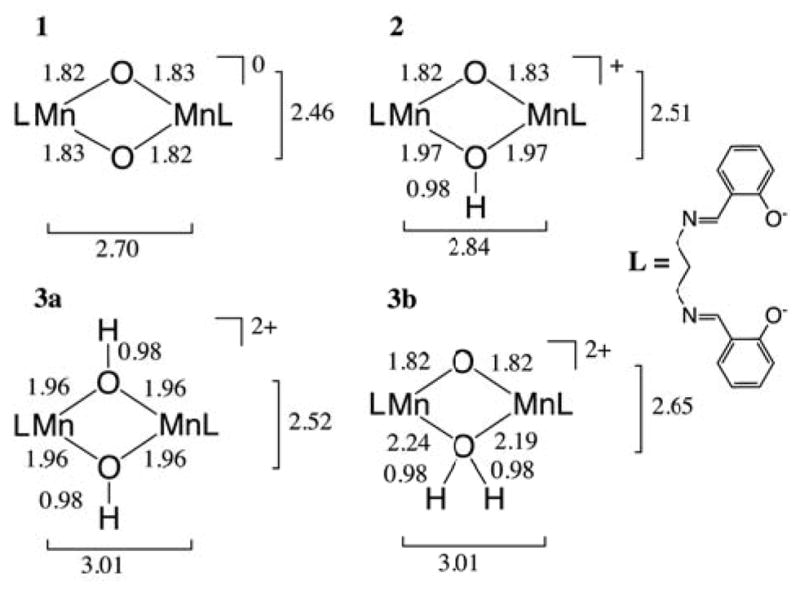
Representation of the dinuclear [LMnIVO]2Hx (x = 0–2) compounds, their total charges and the selected core bond distances from DFT geometry optimization.28 L stands for the salpn ligand.29 Comparison with EXAFS data29 and bond angles are given in Chart S1.
MATERIALS AND METHODS
XES measurements
XES measurements were performed on beamline 6–2 at SSRL, with an operating ring current of 300 mA. The beamline monochromator, using two cryogenically cooled Si \crystals in (111) reflection, was used to set the incident photon energy to 10.4 keV. The X-ray beam was focused to 0.6 (V) × 0.5 (H) mm (FWHM) by means of vertical and horizontal focusing mirrors. The X-ray flux at 10.4 keV was 3.0 × 10¹² photons × s−1 × mm−2. Multiple spots were used for collecting each XES spectrum, and the total amount of photons deposited on each sample spot was 2.7 × 10¹² photons, which is below the threshold of radiation damage determined by XAS (Ref. 28). Samples were kept at a temperature of 10 K in a liquid helium flow cryostat. Concentration scans.
Emission spectra were recorded by means of a high-resolution crystal-array spectrometer, using the 440 reflection of 14 spherically bent Si(110) crystals (100 mm diameter, 1 m radius of curvature), aligned on intersecting Rowland circles.30 An energy-resolving Si drift detector (Vortex) was positioned at the focus of the 14 diffracting elements. A helium-filled polyethylene bag was placed between the cryostat and the spectrometer to minimize signal attenuation due to air absorption.
The fluorescence signal from the sample was divided by the incident flux (I0), as monitored by a helium-filled ionization chamber. Spectra were calibrated using MnO as a reference. The first moments of the Kβ1,3 and Kβ2,5 peaks of a MnO spectrum were calibrated to 6491.00 eV and 6534.25 eV, respectively. Data were collected at 10 K in a continuous flow liquid helium cryostat (Ox-ford Instruments CF1208) under helium exchange gas atmosphere.
Analysis of XES Spectra
The XES spectra were fit using the program BlueprintXAS.38 For each compound, ~100 fits of the Kβ main line and valence to core regions were generated, and at least 30 reasonable fits were included for a statistically significant average (results are reported in Table 1, see Figure S2 for 2nd derivatives). All of the emission spectra are normalized to a total integrated area of 1000. Reported experimental areas are based on the average of all good fits. Due to errors in normalization, background subtraction and fitting, a 10% error in the reported areas is estimated.35 To appropriately and quantitatively compare the calculated XES spectra with the experimental data, the valence-to-core regions were analyzed in a comparable fashion, yielding intensity-weighted average energies (IWAE) and areas of fit or calculated peaks. The direct comparability of these parameters was established in Ref. 39. The reported experimental peak areas and IWAEs are those of the best-fit averages.
Table 1.
Intensity Weighted Average Energies and Areas for total valence-to-core regions and individual peaks (1–5) from experiment and calculation. Calculated Areas correspond to the sums of the oscillator strengths of the predicted transitions and were multiplied with 1000, but otherwise unscaled. Calculated IWAEs were shifted by 59.2 eV.
| Total | 1 | 2 | 3 | 4 | 5 | ||||||||
|---|---|---|---|---|---|---|---|---|---|---|---|---|---|
| Peak (eV) | Area | Peak (eV) | Area | Peak (eV) | Area | Peak (eV) | Area | Peak (eV) | Area | Peak (eV) | Area | ||
| exp | 1 | 6531.1 | 39.60 | 6515.4 | 2.90 | 6519.3 | 6.93 | 6526.3 | 6.13 | 6530.8 | 8.65 | 6535.1 | 14.99 |
| 2 | 6531.4 | 37.79 | 6516.2 | 3.20 | 6519.2 | 4.64 | 6525.8 | 6.01 | 6530.3 | 9.27 | 6534.7 | 14.67 | |
| 3 | 6533.2 | 33.63 | 6517.1 | 4.28 | – | – | 6525.5 | 6.30 | 6529.9 | 8.47 | 6534.4 | 14.57 | |
|
| |||||||||||||
| calc | 1 | 6530.8 | 19.13 | 6517.2 | 0.68 | 6520.4 | 3.11 | 6525.5 | 0.40 | 6530.0 | 3.17 | 6534.8 | 11.77 |
| 2 | 6530.6 | 19.76 | 6517.7 | 2.07 | 6520.7 | 1.60 | 6525.9 | 0.42 | 6530.6 | 5.54 | 6535.0 | 10.13 | |
| 3a | 6531.0 | 18.70 | 6518.5 | 2.71 | – | – | 6526.2 | 0.58 | 6530.6 | 5.54 | 6535.0 | 9.86 | |
| 3b | 6530.7 | 18.28 | 6519.2 | 3.12 | – | – | 6526.3 | 0.71 | 6530.7 | 5.33 | 6535.1 | 9.12 | |
Computation of XES Spectra
Valence-to-core X-ray emission spectra were calculated with the one-electron DFT approach implemented in the ORCA program package.40 The geometries for these calculations were obtained from full relaxations of the crystal structure for compound 1, with the correct number of protons added in the appropriate positions. These calculations used the BP86 functional41,42 with the scalar-relativistically recontracted43 Karlsruhe triple-ζ def2-TZVP(-f) basis set.44 More details on the geometry optimization are given in Ref. 28. The method for calculating XES spectra has been published and tested.35,36 The present paper follows the latter publication in correcting the molecular orbitals for spin-orbit coupling, with the spin-orbit mean-field approximation (SOMF) for the SOC operator.44,45 The functional BP86 with def2-TZVP(-f) and def2-TZV/J basis sets and the conductor like screening model (COSMO46) for dichloromethane (ε = 9.08) was used here. The resulting computed spectra were energy-shifted by 59.2 eV to higher energy and broadened by 3.5 eV as discussed in Ref. 36. Additionally, the intensity of the calculated spectra were divided by two, since contributions from two donor sites are considered in the calculations, but the experimental normalization procedures results in spectra normalized to only one donor site. To understand the character of the calculated spectral features, it is sufficient to analyze the donor orbital character, since a one-electron picture was employed. The calculated spectra were divided into individual contributions with help of the 2nd derivatives of the line spectra. The limits are given in the SI, Figure S3 and Table S1.
RESULTS AND DISCUSSION
When the [MnIV(salpn)(O)]2 dimer was originally reported, X-ray crystal structures of the protonated species were not available.29 The protonation states of the oxo bridges were inferred from IR and UV-visible spectroscopy as well as XAS techniques. Using the changes in Mn-ligand and Mn-Mn distances, it was deduced that the protonation of the oxo bridges proceeded from a bis-μ-oxo through a μ-oxo-μ-hydroxo and finally to a bis-μ-hydroxo complex. To test the sensitivity of valence-to-core XES to different types of oxo-bridge protonation patterns, not only a bis-μ-hydroxo complex was considered in the calculations, but also a μ-oxo-μ-aquo species. With the complementary approaches of XES and XAS data (in the preceding paper, Ref. 28), combined with spectral calculations, it is possible to identify the protonation states of the bridges definitively as described below.
XES Spectra
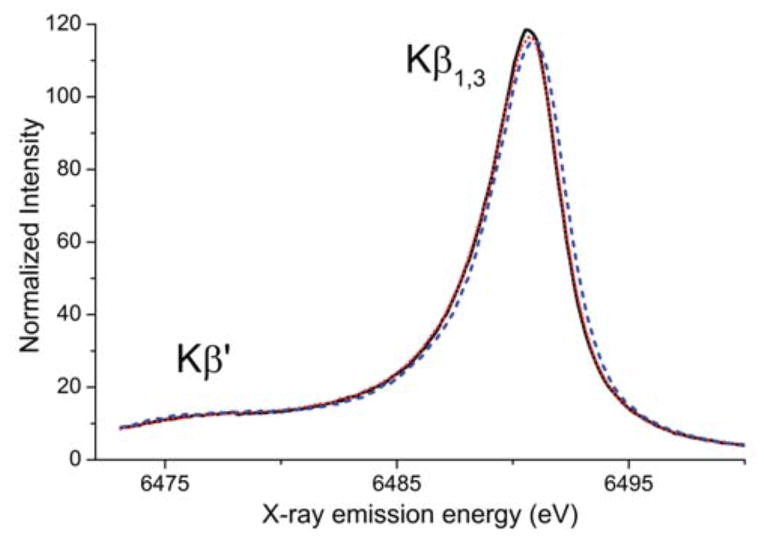
The Kβ emission spectra consist of the Kβ′ and Kβ1,3 features, that together are called the main line, and the significantly less intense valence-to-core region at higher energy. The main line extends from 6472 to 6500 eV and is shown in Figure 3. There is a small shift of the Kβ1,3 highest energy fit component maximum to higher energy upon protonation of the bridging oxygen atoms, however the magnitude is less than 0.25 eV and thus not sufficiently significant to correspond to changes in the Mn oxidation states. These small changes are consistent with the lack of XAS edge energy changes.28 It was shown previously that the dominant factor increasing the Kβ1,3 energy for Mn monomers is an increased 3p-3d exchange interaction.36 Since the 3p-3d exchange interaction can be linked to covalency, it is worthwhile to consider the changes in covalency across the series. At each protonation step, the covalency of the Mn-O bonds in the core decreases: the bis-μ-O core is the most covalent and the bis-μ-OH core the least covalent. The decrease in covalency of the bridging motifs should increase the 3p-3d exchange interaction across the series, which may explain the slightly larger splitting of the Kβ′ and Kβ1,3 features upon protonation and hence the small shifts observed in the Kβ1,3 features.
Figure 3.
Main line of the X-ray emission spectra of compounds 1 (solid black), 2 (dotted red) and 3 (dashed blue).
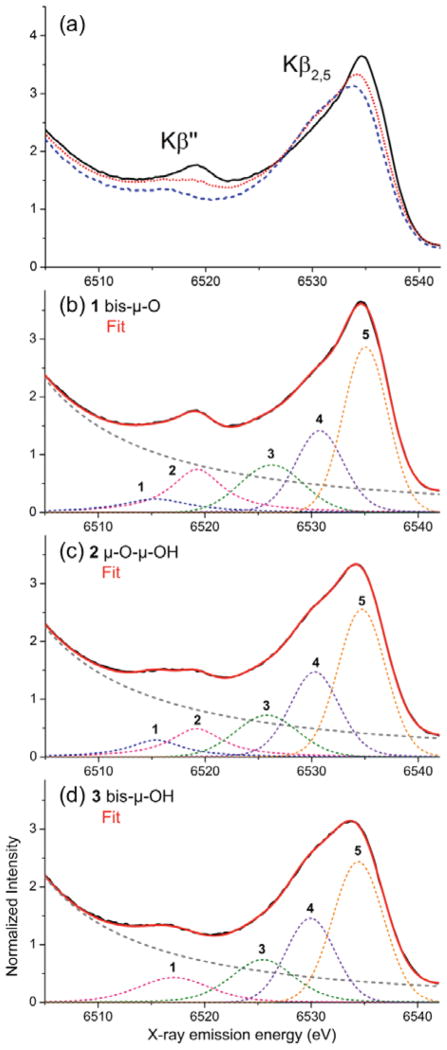
The valence-to-core XES region shows two characteristic peaks, the Kβ″ at 6511-6522 eV and the Kβ2,5 at 6522-6540 eV (Figure 4a). Clear changes were observed for the three compounds with different protonation states (1–3 in Chart 1): both Kβ2,5 and Kβ″ features shift to lower energy upon protonation, accompanied by a decrease in peak intensity. For compounds 2 and 3, a shoulder at the lower-energy side of the Kβ2,5 peak grows in (~6530 eV). To emphasize the differences between the spectra for the three models, Figure S1 shows the difference spectra of 2 with 1 and 3 with 1.
Figure 4.
(a) Valence-to-core region of the X-ray emission spectra of compounds 1 (solid black), 2 (dotted red), and 3 (dashed blue). (b)-(d) Fits to the spectra of compounds 1–3. The energies and areas of the fit components (peaks 1–5) are listed in Table 1. Second derivatives of the background-subtracted normalized data are given as Figure S2 in the SI.
The fits to the XES data are composed of a background, which is the sum of the contributions from the Kβ main line features (Kβ′ and Kβ1,3), and four to five features in the valence-to-core region (see Figure 4b–d). The peak positions and areas of the valence-to-core peak components are summarized in Table 1.
Kβ″ region
The Kβ″ peaks are due to transitions from molecular orbitals of primarily ligand ns character. As ligand ns orbitals minimally participate in bonding with the metal, these features serve as excellent probes of ligand identity.30–36 Focusing on the spectral shape in the 6511-6522 eV spectral range of Figure 4a, one can visually observe an intense and relatively narrow signal for compound 1 at 6519 eV (black), a less intense and broad signal for compound 2 between 6516-6519 eV (red), and again a relatively narrow signal with the lowest intensity of the series for compound 3 at 6516 eV (blue). The fits in this spectral region distinguish two peaks for compounds 1 and 2, while for compound 3, only a single peak component is observed (see Figure 4). For the bis-μ-O bridged complex 1, an intense feature is present at 6519.3 eV (peak 2 in Fig. 4b). A lower energy component (6515.4 eV, peak 1 in Fig. 4b) was required to accurately reproduce the asymmetry of the Kβ″ region of 1. In compound 2, there are two features with at 6519.2 and 6516.2 eV (peaks 1 and 2 in Fig. 4c), where compared to the features of complex 1, the lower energy component is more intense, and the higher energy component is less intense. In contrast, a single feature is observed for the bis-μ-OH bridged complex 3, which is of intermediate intensity and shifted towards lower energies compared to the intense peaks of compounds 1 and 2 (6517.1 eV, peak 1 in Fig. 4d). For the three compounds, the ligands are either oxygen-based (bridging oxo and hydroxo, salpn O) or nitrogen-based (salpn N). The protonation of the oxo-bridges has a larger influence on the equatorial Mn-O/Nsalpn bond lengths than on the axial metal-ligand distances: here, the change is 0.11 Å for Osalpn and 0.10 Å for Nsalpn between 1 and 3a. The axial bond lengths change much less (0.06 Å for Osalpn, 0.01 Å for Nsalpn between 1 and 3a). Since the equatorial distance changes are relatively large, one cannot necessarily expect the ligand contributions to be constant, but for extensive ligand systems, the contributions in the valence-to-core region are expected to be relatively small.36,47 It can thus be expected that peak 2 is due to transitions from Obridge 2s orbitals, whereas peak 1 is due to transitions from OHbridge 2s and N/Osalpn 2s orbitals. We assign the spectra with the help of DFT calculations (vide infra).
Kβ2,5 region
Here, in the 6522 - 6540 eV energy range, the main change upon protonation is a systematic decrease in intensity of the main feature at ~6535 eV and a concomitantly increasing shoulder at its lower energy side, ~6530 eV. In the fits, the Kβ2,5 region consists of three components in the spectra of all three compounds (peaks 3, 4, and 5 in Fig. 4b–d). The intensity increase of the low energy shoulder with each protonation event is due to the decrease in peak 5 intensity and a shift of the peaks 3 and 4 to lower energy (by ~0.9–1.0 eV). Thus, the whole Kβ2,5 region becomes broader with successive protonation of the bridging oxo groups.
Upon protonation of the bridging oxygen atoms, the IWAE of the total valence-to-core region increases slightly, from 6531.1 eV (1: bis-μ-O), to 6531.4 eV (2: (μ-O)(μ-OH)), and to 6533.2 eV (3: bis-μ-OH). The peak areas change more significantly, from 39.60 (1: bis-μ-O), to 37.79 (2: (μ-O)(μ-OH)), and to 33.63 (3: bis-μ-OH). The total areas for the Kβ2,5 region of 1–3 (peaks 3–5 in Fig. 2b–d, also see Table 1) are relatively constant, varying between 29.34 and 29.95, which is consistent with the qualitative observations presented above.
Calculated XES
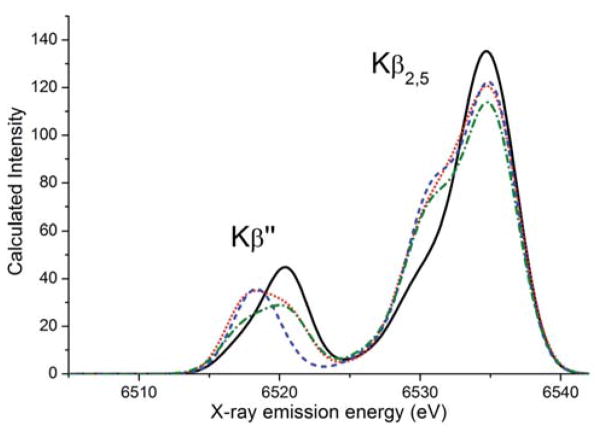
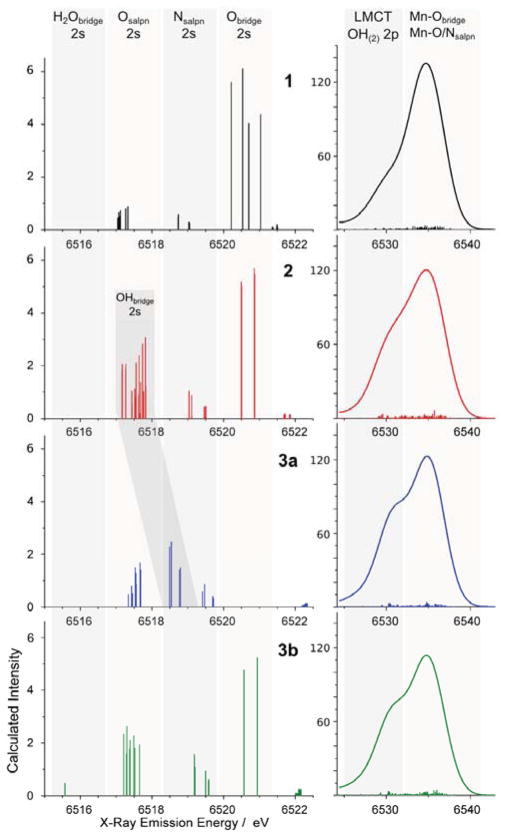
The calculated valence-to-core XES spectra for models 1, 2, 3a and 3b are shown in Figure 5 and the IWAEs and peak positions are summarized in Table 1. The general trends in both the Kβ″ (6525-6540 eV) and the Kβ2,5 (6525-6540 eV) regions are well-reproduced. The Kβ″ feature in the calculated spectrum of compound 1 is located at the highest energy of the other features in the series (6520.4 eV, black in Figure 5), and is predicted to have an asymmetric narrow peak in agreement with experiment. The calculated spectrum of the doubly protonated species 3a shows a similarly narrow, but symmetric feature appearing at the lowest energy of this series (~6518.5 eV, blue in Figure 5), reproducing the experimental trend. Most importantly, the width of the Kβ″ peak of compound 2 is the broadest in this region, which is in excellent agreement with the experimental data. In fact, the broad calculated Kβ″ peak of compound 2 extends from the lower energy end of compound 3a to nearly the higher energy end of compound 1. This is also predicted to be the case for the spectrum of the putative complex 3b. To higher energies, in the Kβ2,5 region between 6524 - 6540 eV, the intensity of the main feature at ~6535 eV decreases upon protonation. Just as in the experimental spectra, the shoulder at ~6530 eV increases in intensity between the unprotonated and the protonated complexes.
Figure 5.
Calculated valence-to-core spectra of compounds 1 (solid black), 2 (solid red), 3a (dotted blue), and 3b (dashed-dotted green). Calculated spectrum is shifted by 59.2 eV.
Regarding the ability of XES to distinguish the symmetric (3a, dihydroxo) vs. the asymmetric (3b, oxo-aqua) doubly protonated species, we note that the spectrum of complex 3a and 3b differ in the intensity distribution of the Kβ″ region. The spectrum of 3a reproduces a narrow, intense feature shifted to lower energies compared to that of 1, whereas the spectrum of 3b is broad and of low intensity. Thus, the spectrum of 3a yields a better match with experiment than that of 3b. This is also in line with the calculated energetic and magnetic data for both structural proposals.28
The fact that the Kβ″ regions of 2 and 3 are clearly distinguished by experiment, and the demonstration that models 2, 3a, and 3b are computational distinct, gives confidence in the ability of valence-to-core XES to differentiate not only between complexes in different protonation states (bis-μ-oxo, μ-oxo-μ-hydroxo, bis-μ-hydroxo), but also between complexes of the same nuclearity with different bridging motifs (bis-μ-hydroxo, μ-oxo-μ-aquo).
Assignments of the Kβ2,5 region
The calculated Kβ2,5 main features of the three compounds exhibit no major energy shifts, whereas the decrease in peak intensity upon protonation is significant. The area of the total Kβ2,5 region shows little variation in agreement with experiment. In compound 1, the shoulder at ~6530 eV originates from transitions of LMCT (Ligand-Metal Charge Transfer) character from the salpn ligand. The increase in the shoulder intensity in compounds 2 and 3 stems from additional transitions out of hydroxo-bridge orbitals of p-character, that fall into the same energy region. The most intense peak (component 5 in the experimental fits) is largely due to transitions from Mn-O/Nsalpn2p and Mn-Obridge2p based molecular orbitals (see Figure 6).
Figure 6.
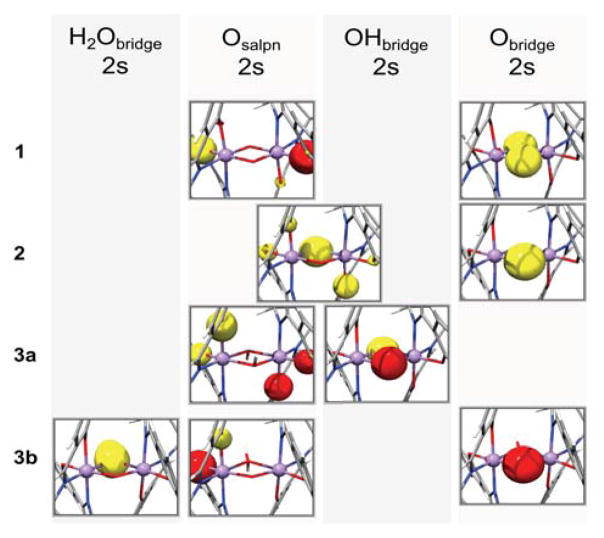
Assignments of the calculated XES valence-to-core region based on the orbital character corresponding to the individual transitions for compounds 1 (a), 2 (b), 3a (c) and 3b (d). The left side shows the Kβ″ region, the right side shows the Kβ2,5 region with different intensity scales. Grey areas where transitions of different donor orbital character appear; from left to right: H2Obridge 2s, Osalpn 2s, Nsalpn 2s, Obridge 2s in the left half; OH/OH2 2p and LMCT, Mn-O/Nsalpn and Mn-Obridge in the right half. Transitions from orbitals with OHbridge 2s character are found either in the Osalpn 2s region (mixed with Osalpn 2s character) or separately in the Nsalpn 2s energy region (darkest grey). Representative donor orbitals for each of the spectral regions are shown in Figure 7.
Assignments of the Kβ″ region
Figure 6 shows the origin of the Kβ″ and Kβ2,5 regions of the valence-to-core spectra, determined on the basis of the calculated spectra. The Kβ″ feature arises from electronic transitions from O and N 2s into Mn 1s orbitals. The Osalpn2s and Nsalpn2s contributions appear at the same energies in all spectra, and thus can serve as reference points. For compound 1, the transitions appear in the order of Osalpn2s, Nsalpn2s, Obridge2s from lower to higher energy, where the Obridge2s components are the most intense. The Obridge2s and Osalpn2s transitions are separated by ~3 eV according to the calculations. Upon single protonation, yielding 2, no energetic shifts are observed for transitions from the Obridge 2s orbitals with respect to their positions in the spectrum of 1, whereas the transitions from the single-protonated bridging oxygen atoms (OHbridge2s) are shifted into the energy-region of the Osalpn2s transitions. Inspection of the isosurfaces representing the donor orbitals of these transitions reveals that the orbitals have mixed Osalpn2s/Obridge2s character (see Figure 7). The broad feature of the Kβ″ peak in compound 2 can thus be explained by the distinct energy separation of ~ 3 eV between the protonated and unprotonated oxo-bridge 2s orbitals. In the doubly protonated compound 3a, the OHbridge2s components appear at energies between the Osalpn2s and Nsalpn2s ones; their close energy levels making the Kβ″ feature appear as a single peak. For compound 3b, the H2Obridge2s components are found at energies lower than those of Osalpn2s, which increases the asymmetry of the Kβ″ feature and broadens it relative to the peak of compound 3a. The Obridge2s position is the same as those observed in the compounds 1 and 2.
Figure 7.
Representative donor orbitals corresponding to each of the assigned regions of the Kβ″ peak in Figure 6 (except “Nsalpn2s”, instead “OHbridge2s” is shown in a separate panel); from top to bottom: bis-μ-oxo (1), μ-oxo-μ-hydroxo (2), bis-μ-hydroxo (3a), μ-oxo-μ-aquo (3b).
In short, the Kβ″ region of MnIV dimers with protonated or unprotonated oxo-bridges can be attributed to transitions from Obridge2s, Osalpn2s and Nsalpn2s orbitals. The energetic positions of the Obridge2s transitions shift by more than 3 eV upon protonation, significantly broadening the spectra. Regarding the relative intensities, the approximate order is calculated to be Obridge2s ≫ OHbridge2s > Osalpn2s > Nsalpn2s ≫ H2Obridge2s. The reason for the strong contribution of transitions from Obridge2s orbitals to the envelope intensity is attributed to the shorter Mn-Obridge than Mn-Osalpn distances. Mn-Obridge distances of 1.81–1.82 Å were obtained from the crystal structure in compound 1, whereas Mn-Osalpn and Mn-Nsalpn distances in this complex are much longer (1.91–1.93 Å and 2.00–2.06 Å, respectively). This trend is reproduced in the DFT calculations, where Mn-Obridge distances of 1.82–1.83 Å and longer Mn-Osalpn and Mn-Nsalpn distances (1.93–1.95 Å, 2.00–2.05 Å) were obtained for 1.28 Upon protonation of the bridging oxygen atoms, the Mn-OHbridge distance is expected to increase to ~1.97 Å based on the DFT optimized geometry. The elongation of the bridging oxygen atoms upon protonation is consistent with the EXAFS results (for details, see SI and the preceding XAS paper, Ref. 24). The Kβ″ components of these protonated oxo-bridges have lower intensities due to the lower overlap of the donor with the acceptor orbitals, which is linked to the distance between donor-site and acceptor-site. Based on the distance argument only, one would then expect lower intensities for transitions originating from OHbridge 2s orbitals than for those from Osalpn 2s orbitals (Mn-O distances of 1.97 Å and 1.84–1.87 Å in 3a, respectively). The slightly higher intensities found in the calculations (Figure 6, 3a panel) can be explained with the more localized O2s character in ligands of smaller size,48 leading to more intense transitions from the OH bridge than from the O atoms in the salpn ligand. For a bridging aquo ligand, the Mn- H2Obridge distance will be further elongated (~2.2 Å) and the donor orbital less localized, and indeed these transitions are computed to be the least intense (Figure 6, 3b panel).
Correlation of experimental and calculated valence-to-core regions
Although from visual inspection only, the agreement of calculated and experimental data is good, it is worthwhile to quantify the agreement by correlating the experimental and calculated areas and IWAEs.
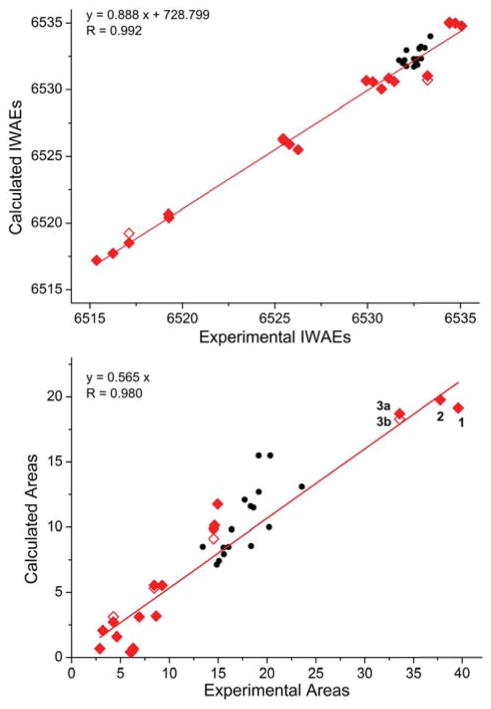
The X-ray emission spectra are compared to a previously published set of monomer data that includes Mn(II) as well as Mn(III) and Mn(IV) data. The IWAEs for individual peaks of the protonation series are compared to the IWAEs for the total valence-to-core area of the monomer series. The data points corresponding to the monomer series fall on the linear regression line for the dimer data, see Figure 8 (top). The adjusted R for the regression line based on the individual peak data does not change upon the inclusion of the monomer data (R 0.992 without, 0.992 with), therefore the data are consistent with the previous correlation. Similar observations hold for the areas, where the monomer areas are close to the dimer regression line, see Figure 8 (bottom). The regression line obtained with both individual and total peak areas for the protonation series changes only slightly in quality of fit upon inclusion of the monomer data (R 0.980 without, 0.981 with).
Figure 8.
Correlation of experimental and calculated IWAES (top) and of experimental and calculated areas (bottom). In both graphs, red diamonds correspond to the individual peak IWAE/area of the dimers, which the linear regression lines are based on. The unfilled red diamonds correspond to data for dimer 3b. Monomer data, shown as black circles for total IWAE/total area, are given as reference values for the quality of the correlation. Linear regression lines based on the dimer data follow y = 0.888 x + 728.799 with R = 0.992 (top) and y = 0.565 x with R = 0.980 (bottom).
Based solely on the IWAE and total areas of the emission data, it is not possible to discriminate between the bridging motifs. However, the differences in the Kβ″ intensity distributions in the 6511 - 6522 eV spectral region clearly show that for the symmetric compounds 1 and 3, narrow signals at different energies are observed whereas for the asymmetric compound 2 a broad Kβ″ feature is observed. Thus, the envelopes help to understand the differences between the calculated spectra of 3a and 3b compared to the experimental one. For lower-resolution data, it is however crucial to make use of the complementarity of X-ray absorption and emission spectroscopy. As is presented in Ref. 28, the pre-edge areas for compound 3b are clearly outside the correlation range.
CONCLUSION
In this study, we have demonstrated that XES valence to core spectra probe the ligand environment of metals with great sensitivity, including single protonation events. In particular, the Kβ″ satellite peaks can be used to discriminate among a set of three MnIV dimers in which the protonation state of bridging oxygen atoms are changed systematically. The limits of structure discrimination were further explored by comparison to calculated spectra for the two isomers [MnIV2(salpn)2(μ-OH)2]2+ and [MnIV2(salpn)2(μ-OH)(μ-OH2)]2+. We find that even such fine differences can be reliably evaluated by DFT calculations and given the size of these spectral changes they should also be experimentally observable. The application of these methods to metalloprotein active sites will certainly pose greater challenges. However, the observation of single light atoms from valence-to-core XES has already been demonstrated for both nitrogenase and the OEC.49,32 The determination of more subtle changes, such as single protonation events within the OEC active site, may be addressed by utilizing difference spectra to highlight the changes between different S states. The Mn4CaO5 complex has a ligation sphere that may be comprised of oxygen-derived ligands (including O2−, OH−, and/or H2O), carboxylate ligands and histidine ligands. While all of these ligands will contribute to the Kβ2,5 region of the spectrum, the most significant intensity in the Kβ″ region will derive from OH− or O2− ligands. As the present study shows, the changes between oxo and hydroxo groups should result in clear spectral changes, which may be highlighted by examining spectral differences. The observation of such (de)protonation events at manganese-bound oxo bridges should provide fundamental insights towards understanding of the catalytic cycle of the OEC, as well as other enzymes featuring dinuclear, high-valent manganese ions in their active sites, such as manganese RnR or manganese catalase.50,2
The assignments of the valence-to-core region show that the transitions of largest intensity in the Kβ″ region are due to transitions from the oxo-bridge-2s orbitals, which are significantly more intense than transitions from salpn-N/O-2s or hydroxo/aquo-bridge-2s orbitals. This is attributed to the shorter Mn-O distance and more localized donor orbital character in the unprotonated bridges, leading to larger overlap of donor and acceptor orbitals and hence more intense transitions. In the Kβ2,5 region, a shoulder in the lower-energy range is shown to be indicative of bridging hydroxo-2p contributions which are only present in protonated species, leading to increased intensity in this region across the series.
The data presented here demonstrate the exquisite chemical sensitivity of valence-to-core XES, which is further strengthened when combined with X-ray absorption spectroscopy.28 Together these two techniques provide powerful element-specific tools to monitor changes in the ligand environment in metalloproteins, possibly during catalysis, by neglecting the overwhelming number of surrounding light atoms. A further challenge will be to detect protonation state changes that occur at terminal ligands in multinuclear complexes, and such studies are underway.
Supplementary Material
Acknowledgments
This work was supported by the Director, Office of Science, Office of Basic Energy Sciences (OBES), Division of Chemical Sciences, Geo-sciences, and Biosciences (CSGB) of the Department of Energy (DOE) under Contract DE-AC02-05CH11231 (J.Y. and V.K.Y.) for instrumentation development and NIH Grant GM 55302 (V.K.Y) for Mn inorganic chemistry. Experiments were carried out at Stanford Synchrotron Radiation Lightsource (SSRL), BL 6-2 in Stanford. SSRL is supported by DOE OBER. We thank the staff at SSRL for their support. VK, MAB, SD and FN thank the Max Planck Society for funding. Also SD acknowledges Cornell University and the Alfred P. Sloan Foundation for fellowship.
ABBREVIATIONS
- XES
X-ray emission spectroscopy
- XAS
X-ray absorption spectroscopy
- IWAE
Intensity Weighted Average Energy
- OEC
Oxygen Evolving Complex
- PSII
Photosystem II
Footnotes
Author Contributions
The manuscript was written through contributions of all authors. All authors have given approval to the final version of the manuscript.
Supporting Information. Full geometry details (Chart S1). Experimental valence-to-core difference spectra (Figure S1). 2nd derivatives of the valence-to-core background-subtracted spectra (Figure S2). Peak limits for the calculated valence-to-core spectra (Figure S3 and Table S1). Examples input files for XES calculations. This material is available free of charge via the Internet at http://pubs.acs.org/.
References
- 1.Whittaker MM, Barynin VV, Igarashi T, Whittaker JW. Eur J Biochem. 2003;270:1102–1116. doi: 10.1046/j.1432-1033.2003.03459.x. [DOI] [PubMed] [Google Scholar]
- 2.Barynin VV, Whittaker MM, Antonyuk SV, Lamzin VS, Harrison PM, Artymiuk PJ, Whittaker JW. Structure. 2001;9:725–738. doi: 10.1016/s0969-2126(01)00628-1. [DOI] [PubMed] [Google Scholar]
- 3.Sproviero EM, Gascon JA, McEvoy JP, Brudvig GW, Batista VS. Coordination Chemistry Reviews. 2008;252:395–415. doi: 10.1016/j.ccr.2007.09.006. [DOI] [PMC free article] [PubMed] [Google Scholar]
- 4.Siegbahn PEM. Accounts of Chemical Research. 2009;42:1871–1880. doi: 10.1021/ar900117k. [DOI] [PubMed] [Google Scholar]
- 5.Yamanaka S, Kanda K, Saito T, Umena Y, Kawakami K, Shen JR, Kamiya N, Okumura M, Nakamura H, Yamaguchi K. Advances in Quantum Chemistry. Vol. 64. Elsevier; 2012. pp. 121–187. [Google Scholar]
- 6.Mahapatra S, Halfen JA, Wilkinson EC, Pan GF, Wang XD, Young VG, Cramer CJ, Que L, Tolman WB. J Am Chem Soc. 1996;118:11555–11574. [Google Scholar]
- 7.Berreau LM, Mahapatra S, Halfen JA, Houser RP, Young VG, Tolman WB. Angew Chem, Int Ed. 1999;38:207–210. [Google Scholar]
- 8.Mahapatra S, Halfen JA, Wilkinson EC, Que L, Tolman WB. J Am Chem Soc. 1994;116:9785–9786. [Google Scholar]
- 9.Bollinger JM, Jiang W, Green MT, Krebs C. Curr Opin Struct Biol. 2008;18:650–657. doi: 10.1016/j.sbi.2008.11.007. [DOI] [PubMed] [Google Scholar]
- 10.Lee SK, Nesheim JC, Lipscomb JD. J Biol Chem. 1993;268:21569–21577. [PubMed] [Google Scholar]
- 11.Lee SK, Fox BG, Froland WA, Lipscomb JD, Munck E. J Am Chem Soc. 1993;115:6450–6451. [Google Scholar]
- 12.Hsu HF, Dong YH, Shu LJ, Young VG, Que L. J Am Chem Soc. 1999;121:5230–5237. [Google Scholar]
- 13.Stubna A, Jo DH, Costas M, Brenessel WW, Andres H, Bominaar EL, Munck E, Que L. Inorg Chem. 2004;43:3067–3079. doi: 10.1021/ic030296k. [DOI] [PubMed] [Google Scholar]
- 14.Kryatov SV, Taktak S, Korendovych IV, Rybak-Akimova EV, Kaizer J, Torelli S, Shan XP, Mandal S, MacMurdo VL, Payeras AMI, Que L. Inorg Chem. 2005;44:85–99. doi: 10.1021/ic0485312. [DOI] [PubMed] [Google Scholar]
- 15.Mukhopadhyay S, Mandal SK, Bhaduri S, Armstrong WH. Chem Rev. 2004;104:3981–4026. doi: 10.1021/cr0206014. [DOI] [PubMed] [Google Scholar]
- 16.Parsell TH, Behan RK, Green MT, Hendrich MP, Borovik AS. J Am Chem Soc. 2006;128:8728–8729. doi: 10.1021/ja062332v. [DOI] [PubMed] [Google Scholar]
- 17.Yin G, Danby AM, Kitko D, Carter JD, Scheper WM, Busch DH. J Am Chem Soc. 2008;130:16245–16253. doi: 10.1021/ja804305x. [DOI] [PubMed] [Google Scholar]
- 18.Lassalle-Kaiser B, Hureau C, Pantazis DA, Pushkar Y, Guillot R, Yachandra VK, Yano J, Neese F, Anxolabehere-Mallart E. Energy Environ Sci. 2010;3:924–938. doi: 10.1039/B926990H. [DOI] [PMC free article] [PubMed] [Google Scholar]
- 19.Martinho M, Banse F, Bartoli JF, Mattioli TA, Battioni P, Horner O, Bourcier S, Girerd JJ. Inorg Chem. 2005;44:9592–9596. doi: 10.1021/ic051213y. [DOI] [PubMed] [Google Scholar]
- 20.Bigi JP, Harman WH, Lassalle-Kaiser B, Robles DM, Stich TA, Yano J, Britt RD, Chang CJ. J Am Chem Soc. 2012;134:1536–1542. doi: 10.1021/ja207048h. [DOI] [PubMed] [Google Scholar]
- 21.Yin GC, Danby AM, Kitko D, Carter JD, Scheper WM, Busch DH. J Am Chem Soc. 2007;129:1512. doi: 10.1021/ja0673229. [DOI] [PubMed] [Google Scholar]
- 22.Fiedler AT, Que L. Inorg Chem. 2009;48:11038–11047. doi: 10.1021/ic901391y. [DOI] [PMC free article] [PubMed] [Google Scholar]
- 23.Jensen MP, Costas M, Ho RYN, Kaizer J, Payeras AMI, Munck E, Que L, Rohde JU, Stubna A. J Am Chem Soc. 2005;127:10512–10525. doi: 10.1021/ja0438765. [DOI] [PubMed] [Google Scholar]
- 24.MacMurdo VL, Zheng H, Que L. Inorg Chem. 2000;39:2254. doi: 10.1021/ic991482m. [DOI] [PubMed] [Google Scholar]
- 25.Noguchi T. Philosophical Transactions of the Royal Society B-Biological Sciences. 2008;363:1189–1194. doi: 10.1098/rstb.2007.2214. [DOI] [PMC free article] [PubMed] [Google Scholar]
- 26.Milikisiyants S, Chatterjee R, Lakshmi KV. J Phys Chem B. 2011;115:12220–12229. doi: 10.1021/jp205629g. [DOI] [PubMed] [Google Scholar]
- 27.Su JH, Cox N, Ames W, Pantazis DA, Rapatskiy L, Lohmiller T, Kulik LV, Dorlet P, Rutherford AW, Neese F, Boussac A, Lubitz W, Messinger J. Biochim Biophys Acta Bioenerg. 2011;1807:829–840. doi: 10.1016/j.bbabio.2011.03.002. [DOI] [PubMed] [Google Scholar]
- 28.Krewald V, Lassalle-Kaiser B, Boron TT, III, Kern J, Beckwith MA, Yachandra VK, Pecoraro VL, Yano J, Neese F, De Beer S. Inorg Chem. 2013 doi: 10.1021/ic4008203. submitted. [DOI] [PMC free article] [PubMed] [Google Scholar]
- 29.Baldwin MJ, Stemmler TL, Riggs-Gelasco PJ, Kirk ML, Penner-Hahn JE, Pecoraro VL. J Am Chem Soc. 1994;116:11349–11356. [Google Scholar]
- 30.Glatzel P, Bergmann U. Coord Chem Rev. 2005;249:65–95. [Google Scholar]
- 31.Bergmann U, Bendix J, Glatzel P, Gray HB, Cramer SP. J Chem Phys. 2002;116:2011–2015. [Google Scholar]
- 32.Pushkar Y, Long X, Glatzel P, Brudvig GW, Dismukes GC, Collins TJ, Yachandra VK, Yano J, Bergmann U. Angew Chem, Int Ed. 2010;49:800–803. doi: 10.1002/anie.200905366. [DOI] [PMC free article] [PubMed] [Google Scholar]
- 33.Lancaster KM, Roemelt M, Ettenhuber P, Hu YL, Ribbe MW, Neese F, Bergmann U, DeBeer S. Science. 2011;334:974–977. doi: 10.1126/science.1206445. [DOI] [PMC free article] [PubMed] [Google Scholar]
- 34.Smolentsev G, Soldatov AV, Messinger J, Merz K, Weyhermuller T, Bergmann U, Pushkar Y, Yano J, Yachandra VK, Glatzel P. J Am Chem Soc. 2009;131:13161–13167. doi: 10.1021/ja808526m. [DOI] [PMC free article] [PubMed] [Google Scholar]
- 35.Lee N, Petrenko T, Bergmann U, Neese F, DeBeer S. J Am Chem Soc. 2010;132:9715–9727. doi: 10.1021/ja101281e. [DOI] [PubMed] [Google Scholar]
- 36.Beckwith MA, Roemelt M, Collomb MN, DuBoc C, Weng TC, Bergmann U, Glatzel P, Neese F, DeBeer S. Inorg Chem. 2011;50:8397–8409. doi: 10.1021/ic200970t. [DOI] [PubMed] [Google Scholar]
- 37.Gatt P, Petrie S, Stranger R, Pace RJ. Angew Chem. 2012;124:12191–12194. doi: 10.1002/anie.201206316. [DOI] [PubMed] [Google Scholar]
- 38.Delgado-Jaime MU, Mewis CP, Kennepohl P. J Synchrotron Radiat. 2010;17:132–137. doi: 10.1107/S0909049509046561. [DOI] [PubMed] [Google Scholar]
- 39.DeBeer George S, Petrenko T, Neese F. Journal of Phisical Chemistry A. 2008;112:12936–12943. doi: 10.1021/jp803174m. [DOI] [PubMed] [Google Scholar]
- 40.Neese F. ORCA program. Univ. Bonn; Version 2.8 ed. [Google Scholar]
- 41.Becke AD. Phys Rev A. 1988;38:3098–3100. doi: 10.1103/physreva.38.3098. [DOI] [PubMed] [Google Scholar]
- 42.Perdew JP. Phys Rev B. 1986;33:8822–8824. doi: 10.1103/physrevb.33.8822. [DOI] [PubMed] [Google Scholar]
- 43.Pantazis DA, Chen XY, Landis CR, Neese F. J Chem Theory Comput. 2008;4:908–919. doi: 10.1021/ct800047t. [DOI] [PubMed] [Google Scholar]
- 44.Weigend F, Ahlrichs R. Phys Chem Chem Phys. 2005;7:3297–3305. doi: 10.1039/b508541a. [DOI] [PubMed] [Google Scholar]
- 45.Hess BA, Marian CM, Wahlgren U, Gropen O. Chem Phys Lett. 1996;251:365–371. [Google Scholar]
- 46.Klamt A, Schüürmann G. J Chem Soc Perkin Trans. 1993;2:799–805. [Google Scholar]
- 47.Lee N, Petrenko T, Bergmann U, Neese F, DeBeer S. J Am Chem Soc. 2010;132:9715–9727. doi: 10.1021/ja101281e. [DOI] [PubMed] [Google Scholar]
- 48.Pollock CJ, DeBeer S. J Am Chem Soc. 2011;133:5594–5601. doi: 10.1021/ja200560z. [DOI] [PubMed] [Google Scholar]
- 49.Lancaster KM, Roemelt M, Ettenhuber P, Hu Y, Ribbe MW, Neese F, Bergmann U, DeBeer S. Science. 2011;334:974–977. doi: 10.1126/science.1206445. [DOI] [PMC free article] [PubMed] [Google Scholar]
- 50.Tomter AB, Zoppellaro G, Andersen NH, Hersleth H-P, Hammerstad M, Røhr ÅK, Sandvik GK, Strand KR, Nilsson GE, Bell CB, III, Barra A-L, Blasco E, Le Pape L, Solomon EI, Andersson KK. Coord Chem Rev. 2013;257:3–26. [Google Scholar]
Associated Data
This section collects any data citations, data availability statements, or supplementary materials included in this article.


