Abstract
Changes in bile synthesis by the liver or alterations in the enterohepatic circulation due to a variety of etiological conditions may represent a novel source of liver disease-specific biomarkers. Bile from patients with liver diseases exhibited significant changes in the levels of glycine- and taurine-conjugated bile acids, phospholipids, cholesterol and urea relative to non-liver disease controls. Cholangiocarcinoma and non-malignant liver diseases (NMLD) showed the most significant alterations. Further, hepatocellular carcinoma (HCC) could be differentiated from NMLD (p = 0.02), as well as non-liver disease controls (p = 0.02) based on the amounts of bile acids, phospholipids and/or cholesterol. HCC also differed with cholangiocarcinoma although not significantly. Urea increases somewhat in non-malignant liver disease relative to non-liver disease controls, while the bile acids, phospholipids and cholesterol all decrease significantly. The ratio between some major bile metabolites also distinguished NMLD (p = 0.004–0.01) from non-liver disease controls. This snapshot view of bile homeostasis, is obtainable from a simple nuclear magnetic resonance (NMR) approach and demonstrates the enormous opportunity to assess liver status, explore biomarkers for high risk diseases such as cancers and improve the understanding of normal and abnormal cellular functions.
Keywords: Bile homeostasis, Liver disease, Hepatocellular carcinoma, Cholangiocarcinoma, Glycine-conjugated bile acids, Taurine-conjugated bile acids, 1H NMR, Metabolomics
Introduction
Liver diseases remain a daunting health problem, with primary liver cancer being the most lethal. Hepatocellular carcinoma (HCC) is the leading cause of gastro-intestinal cancer deaths [1]. Clinical silence during the early stages has made early diagnosis of HCC highly challenging. Unfortunately, late diagnosis parallels high mortality rates because therapeutic options are limited and less effective. Patients with Hepatitis B and/or Hepatitis C are at particularly high-risk for the development of cancer. Cancer risk increases with the development of cirrhosis, implying that there are measurable molecular changes within the microenvironment of the liver with the progression of underlying liver disease that account for this increased risk. Targeting such molecular changes has immense potential for early disease detection. The most information-rich techniques currently employed in small molecules analyses are nuclear magnetic resonance (NMR) spectroscopy and mass spectrometry (MS) [2–5]. Recently, application of NMR spectroscopy to the detection of pancreatic, lung, ovarian, prostate and liver cancers based on small molecules is demonstrated using urine, blood or tissue samples [6–10].
A few studies have indicated the potential of metabolite detection in bile for assessing hepatobiliary diseases including cancers of the liver, pancreas and the biliary tract [11–14]. For example, the potential for screening cancer based on the alteration in phospholipid content in human bile between malignant and non-malignant patients has been recently reported [14]. Monitoring the concentration of bile acids in human bile is reported to serve as a reliable indicator for liver function after hepatobiliary resection for biliary cancer [13]. Altered bile cholesterol levels have been implicated in gallstone related problems, including gallbladder cancer. Increased levels of bile acids in serum have also been reported in liver disease, indicating the altered physiology of biliary metabolites in patients with liver related problems [15–20].
Utilizing the fact that a large amount of bile fluid exists in the gallbladder (40–50 mL in humans), attempts to determine bile metabolites non-invasively using in vivo localized magnetic resonance spectroscopy have yielded encouraging results [21, 22]. However, so far no systematic studies have assessed liver diseases based on the measurement of multiple bile metabolites. Advancements in in vitro studies of bile will also benefit translational research for exploring clinical applications of bile in vivo. Therefore, methods providing a reliable snapshot of the major bile metabolites that reflect the global functional status of the liver are highly desired. From a series of comprehensive NMR studies of bile and its metabolites, we recently developed simple NMR methodologies for detecting several bile metabolites, such as individual glycine- and taurine-conjugated bile acids, phospholipids, cholesterol and urea [23–27]. Among the various bile acids, individual conjugated bile acids such as glycocholic acid, glycodeoxycholic acid, glycochenodeoxycholic acid, taurocholic acid, taurodeoxycholic acid and taurochenodeoxycholic acid have been identified, simultaneously, from a single NMR measurement. With this database of information, we can now study these major metabolites of liver origin in gallbladder bile from patients with liver diseases, and, as a result, provide a global view of liver function. Changes in metabolite profiles due to a variety of etiologies indicate the opportunities for using metabolomics to assess disease status and obtain better insights into the cellular biochemistry of malignant and non-malignant liver diseases (NMLD).
Materials and Methods
Chemicals and Bile from Patients
Deuterated dimethylsulfoxide (DMSO), deuterium oxide (D2O), and sodium salt of trimethylsilylpropionic acid-d4 (TSP) were purchased from Sigma-Aldrich (Milwaukee, WI, USA).
Bile Collection
Gallbladder bile was obtained from 44 patients at the time of operation. Of these, 17 were controls (non-liver disease) which were collected from patients undergoing gallbladder procedures unrelated to liver disease. Liver diseases include both malignant, HCC (n = 11) and cholangiocarcinoma (n = 7), and non-malignant (n = 9) diseases. Patient profile and the sample subsets are shown in Table 1. All bile samples were collected at the commencement of the case to minimize ischemic changes, if any. A purse string suture was placed in the fundus of the gallbladder and 10 mL of bile taken via an 18 gauge needle. The bile was transferred to a 10-mL tube containing sodium azide (with a final concentration of 0.1%). The specimen was then divided into 1-mL aliquots and stored at –80 °C until analysis. An Institutional Review Board protocol, approved at both Indiana University School of Medicine and Purdue University, was in place for the collection, storage, and analysis of human bile for research purposes.
Table 1.
Patient profile
| Patients | Number | Gender | Mean age (years) | |
|---|---|---|---|---|
| Liver disease (malignant) | Hepatocellular carcinoma (HCC) | 11 | 7 male, 4 female | 56.8 |
| Cholangio-carcinoma (CC) | 7 | 5 male, 2 female | 52.7 | |
| Liver disease (non-malignant) | Alcoholic cirrhosis (AC) | 3 | 3 male | 50.3 |
| Hepatitis C (HEPC) | 3 | 2 male, 1 female | 52.3 | |
| Non-alcoholic steatohepatitis cirrhosis (NASH) | 1 | 1 female | 60 | |
| Choledochal cyst (CHLC) | 1 | 1 male | 31 | |
| Primary sclerosing cholangitis (PSC) | 1 | 1 female | 24 | |
| Non-liver disease (controls) | With gallstone | 8 | 1 male, 7 female | 39.8 |
| Without gallstone | 5 | 2 male, 3 female | 41.2 | |
| Biliary dyskinesia | 2 | 2 female | 56.5 | |
| Colorectal cancer | 2 | 1 male, 1 female | 52.5 |
NMR Experiments
All 1H-NMR experiments were performed on a Bruker Biospin Avance 500 MHz NMR spectrometer using a 5-mm CHN inverse probehead equipped with shielded z-gradients. The temperature was kept at 25 °C for all the samples.
Spectral Analysis in Aqueous Medium
Bile solutions were prepared by diluting 100 μL of bile to 600 μL using doubly distilled water. Amide signals of individual conjugated bile acids are more accurately represented when the pH of the bile solution is in the range 6 ± 0.5 [23, 26]. Hence, the pH of each bile solution was brought to this range by the addition of 1–2 μL of 1 N hydrochloric acid. A reusable co-axial capillary tube containing TSP in D2O was inserted into the NMR tube before recording 1H-NMR spectra. While D2O served as a field-frequency locking solvent, TSP served as chemical shift as well as a quantitative reference. We have observed that individual glycine- and taurine-conjugated bile acids signals are better distinguished when the coupling of their characteristic amide protons with the attached methylene protons is removed by decoupling [23]. Hence, one-dimensional 1H spectra were obtained using a one pulse sequence incorporating both water suppression by presatu-ration and homonuclear decoupling of the methylene protons. Simultaneous decoupling is achieved with the decoupling frequency set at 3.65 ppm, which is between the chemical shifts of the methylene protons of conjugated taurine (3.56 ppm) and conjugated glycine (3.75 ppm). Typical parameters used were: spectral width 6,400 Hz, time domain data points 32 K, flip angle 45°, acquisition time 2.5 s, relaxation delay 6 s, number of transients 32, spectrum size 32 K points.
Spectral Analysis in Non-aqueous Medium
Well-resolved NMR signals for the bile metabolites are shown to be obtainable when the bile is mixed with an organic solvent such as DMSO. Such spectra enable distinct observation of all major metabolites such as cholesterol, lipids, total bile acids, glycine-conjugated bile acids, taurine-conjugated bile acids and urea, in addition to other metabolites using a single experiment [24]. For profiling the metabolites under these conditions, one-dimensional 1H-NMR experiments were performed: Each bile sample (20 μL) was dissolved in 500 μL DMSO and loaded into a 5-mm NMR tube. A reusable co-axial capillary containing the TSP reference was inserted into the NMR tube and 1H spectra were obtained using a one pulse sequence. As optimized for bile metabolites detection using T1 relaxation studies, 45° radiofrequency excitation pulse and a recycle delay of 6 s were used to ensure complete recovery of magnetization of all the bile metabolites as well as the TSP signal [24].
Quantitative Analysis of Bile Metabolites
Integral areas of the characteristic peaks of glycine-conjugated bile acids, taurine-conjugated bile acids, total bile acids, cholesterol, phospholipids and urea were determined for all the bile samples with reference to the TSP peak area. The bile metabolite concentrations were calculated by taking into account (1) volume of gallbladder bile used in obtaining the NMR spectra, (2) concentration of TSP reference, and (3) NMR peak areas and number of protons that contributed to the measured NMR signals for both metabolites and the reference. Although a known concentration of TSP solution was used in the capillary tube, its concentration was further calibrated from a separate 1H-NMR experiment using a secondary reference solution of glycine. The bile metabolite quantities and their ratios were statistically compared using the unpaired t test.
Results
Proton NMR spectra of gallbladder bile in liver diseases and controls look qualitatively similar. However, the intensities of the signals greatly varied with marked differences visible between different liver diseases and control bile.
Bile in Aqueous Medium
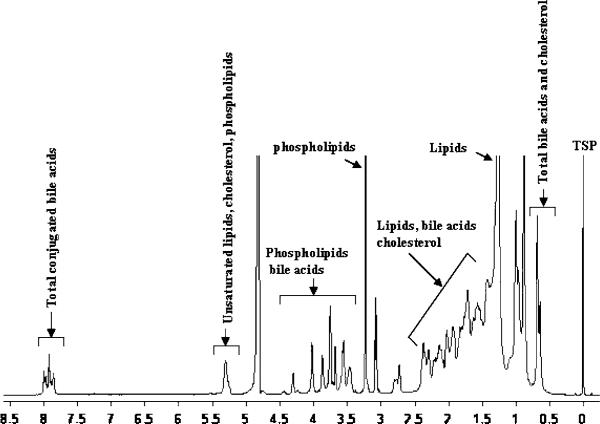
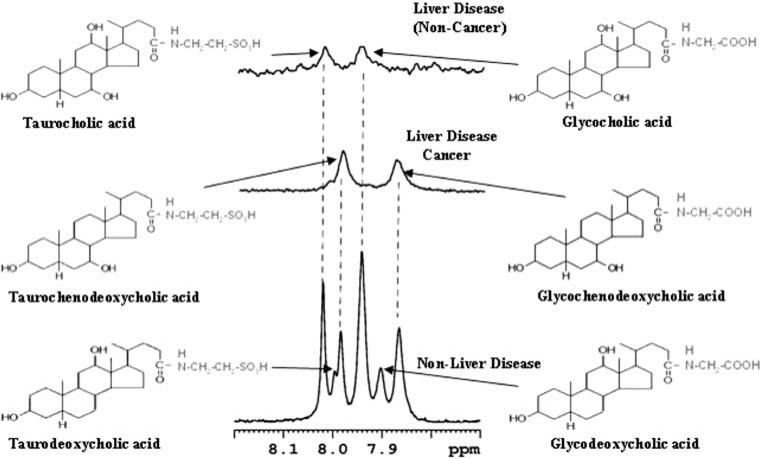
Due to the aggregation of the amphipathic bile metabolites in an aqueous medium, the NMR signals appear relatively broad (Fig. 1). In addition, cholesterol and bile acids have a very close structural resemblance, resulting in the overlap of most of the bile acids and cholesterol signals with one another and with the phospholipid signals. With the aim of identifying individual metabolites from such complex spectra, we previously developed a library of bile acid chemical shifts by extensively analyzing one- and two-dimensional proton and carbon NMR spectra of a large number of unconjugated and glycine- and taurine-conjugated bile acids [25]. Subsequently, the analysis was extended to gallbladder bile using 1D- and 2D-NMR experiments at different field strengths (400, 700 and 800 MHz) [23]. This resulted in the detection of six conjugated bile acids in human bile (glycocholic acid, glycochenodeoxycholic acid, glycodeoxycholic acid, taurocholic acid, taurochenodeoxycholic acid and taurodeoxycholic acid). In the present study, all six of these bile acids were invariably detected in the control bile, and the ratio of taurine- to glycine-conjugated bile acids was observed to be nearly 1:3 (Fig. 2). In both malignant (HCC, CC) and NMLD liver disease samples, bile acids were reduced, both in their quantity and in number. Portions of typical spectra of bile from a control, a malignant- and a non-malignant liver disease are shown in Fig. 2.
Fig. 1.
1H-NMR spectrum of a representative gallbladder bile from non-liver disease controls (n = 17) (100 μL bile diluted to 600 μL) obtained at 500 MHz
Fig. 2.
Portions of the 1H-NMR spectra for representative gallbladder bile from a control (non-liver disease, n = 17) and liver disease patients (malignant; n = 18) and non-malignant n = 9). One or more bile acids in the liver disease are significantly reduced or completely missing as shown in the figure
Bile in Organic Medium
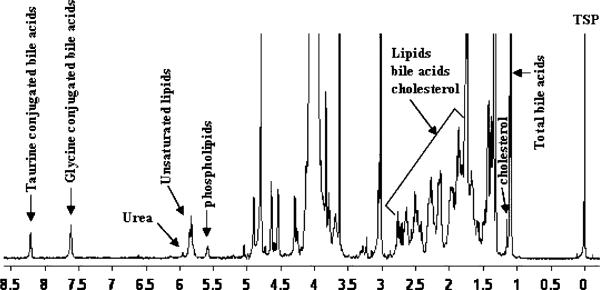
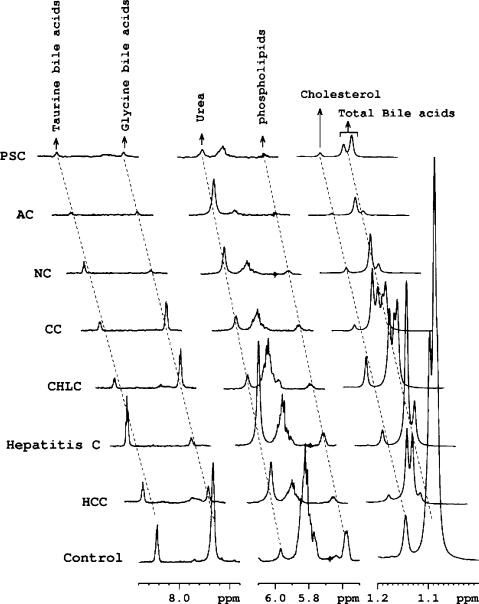
The use of DMSO as a solvent provides a method for the dispersion of aggregated bile metabolites. NMR experiments performed for both liver disease and control bile using this method showed highly resolved signals, and the characteristic peaks for major bile metabolites such as total bile acids, cholesterol, phospholipids, total glycine-conjugated bile acids, total taurine-conjugated bile acids and urea are distinctly isolated in the spectra (Fig. 3). Using the integrated areas of the characteristic marker peaks with reference to the TSP signal at 0.0 ppm, quantities of the major bile metabolites were determined (Table 2). Table 2 also provides data on the standard deviation as well as the results of unpaired t tests among the malignant and non-malignant liver disease and the controls for each of the measured bile metabolite. Portions of the bile NMR spectra that highlight altered major bile metabolite concentrations in different hepatobiliary diseases are shown in Fig. 4.
Fig. 3.
1H-NMR spectrum of a representative gallbladder bile from non-liver disease controls (n = 17), dissolved in an organic solvent (20 μL bile dissolved in 500 μL DMSO) obtained at 500 MHz. Characteristic marker signals for all major bile components are distinctly isolated, thus enabling their quantitation in a single step
Table 2.
Average values, along with the standard deviation, of the quantities of the bile metabolites (in mmol) determined in hepatocellular carcinoma (HCC), cholangiocarcinoma (CC), non-malignant liver diseases (NMLD) and non-liver disease controls (NLD). The errors are expressed as standard deviations; p values are from the unpaired t test between different groups; ns: non-significant
| Patients | Total bile acids | Cholesterol | Phospholipids | Glycine-conjugated bile acids | Taurine-conjugated bile acids | Urea |
|---|---|---|---|---|---|---|
| Hepatocellular carcinoma (n = 11) | 74.1 ± 63.4 | 7.6 ± 6.9 | 17.3 ± 12.6 | 54.0 ± 53.7 | 20.9 ± 15.8 | 4.8 ± 2.7 |
| p = 0.06 vs. CC | p = ns vs. CC | p = 0.05 vs. CC | p = 0.07 vs. CC | p = ns vs. CC | p = ns vs. CC | |
| p = 0.02 vs. NMLD | p = 0.02 vs. NMLD | p = 0.02 vs. NMLD | p = 0.03 vs. NMLD | p = ns vs. NMLD | p = ns vs. NMLD | |
| p = 0.03 vs. NLD | p = 0.05 vs. NLD | p = 0.02 vs. NLD | p = 0.03 vs. NLD | p = ns vs. NLD | p = ns vs. NLD | |
| Cholangio-carcinoma (n = 7) | 24.6 ± 15.8 | 2.9 ± 2.4 | 6.9 ± 5.5 | 15.0 ± 12.5 | 9.1 ± 8.6 | 3.7 ± 1.1 |
| p = ns vs. NMLD | p = ns vs. NMLD | p = ns vs. NMLD | p = ns vs. NMLD | p = ns vs. NMLD | p = ns vs. NMLD | |
| p = 0.001 vs. NLD | p = 0.001 vs. NLD | p = 0.0008 vs. NLD | p = 0.0006 vs. NLD | p = 0.004 vs. NLD | p = ns vs. NLD | |
| Liver disease (non-malignant) (n = 9) | 23.5 ± 17.8 | 2.1 ± 1.7 | 6.6 ± 4.9 | 13.6 ± 12.9 | 9.8 ± 12.1 | 7.9 ± 7.9 |
| p = 0.0001 vs. NLD | p = 0.00005 vs. NLD | p = 0.00008 vs. NLD | p = 0.00005 vs. NLD | p = 0.006 vs. NLD | p = 0.06 vs. NLD | |
| Controls (non-liver disease) (n = 17) | 137.7 ± 77.8 | 13.0 ± 6.9 | 31.3 ± 16.0 | 102.7 ± 56.4 | 34.9 ± 33.3 | 3.9 ± 2.6 |
Fig. 4.
Portions of typical 1H-NMR spectra of gallbladder bile from liver diseases along with a non-liver disease control (n = 17). All spectra are plotted with identical scales for direct comparison of the relative individual metabolite quantities. HCC hepatocellular carcinoma (n = 11), HEPC hepatitis C (n = 3), CHLC choledochal cyst (n = 1), CC cholangiocarcinoma (n = 7), NC cirrhosis due to non-alcoholic steatohepatitis (n = 1), AC alcoholic cirrhosis (n = 3), PSC primary sclerosing cholangitis (n = 1)
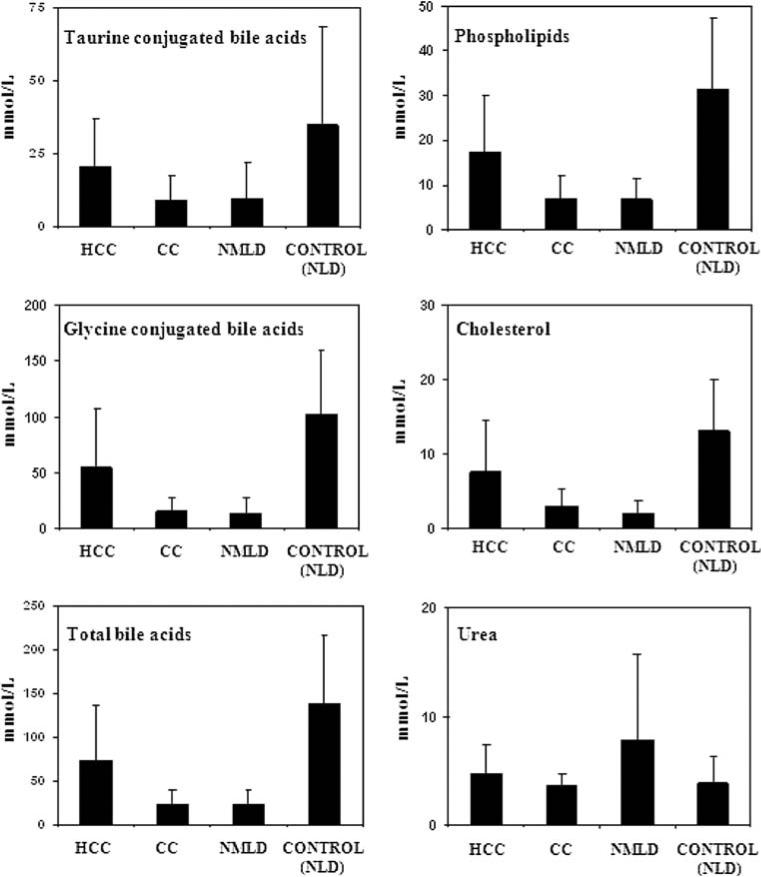
As shown in Table 2, and summarized in Fig. 5, liver diseases including hepatocellular cancer and cholangiocarcinoma exhibited significant changes in the levels of phospholipids, glycine- and taurine-conjugated bile acids, cholesterol and urea in the bile. Among the liver diseases, CC and NMLD showed most significant variation relative to the control samples. In addition, HCC patients could be differentiated from NMLD based on the amounts of phospholipids (p = 0.02), total bile acids (p = 0.02), glycine-conjugated bile acids (p = 0.03) and cholesterol (p = 0.02). Even CC could be differentiated somewhat from HCC based on bile acids (p = 0.06) and phospholipids (p = 0.05), although weakly. The differences in metabolite concentrations between CC and NMLD were not statistically significant. In benign liver disease samples (NMLD), the urea levels were increased somewhat relative to non-liver disease samples with the difference nearly significant (p = 0.06), while the levels of bile acids, phospholipids, and cholesterol were all significantly decreased (p < 0.0001) in all cases.
Fig. 5.
Comparison of differences in metabolite concentration in hepatocellular carcinoma (HCC, n = 11), cholangiocarcinoma (CC, n = 7), non-malignant liver diseases (NMLD, n = 9) and non-liver disease controls (NLD, n = 17)
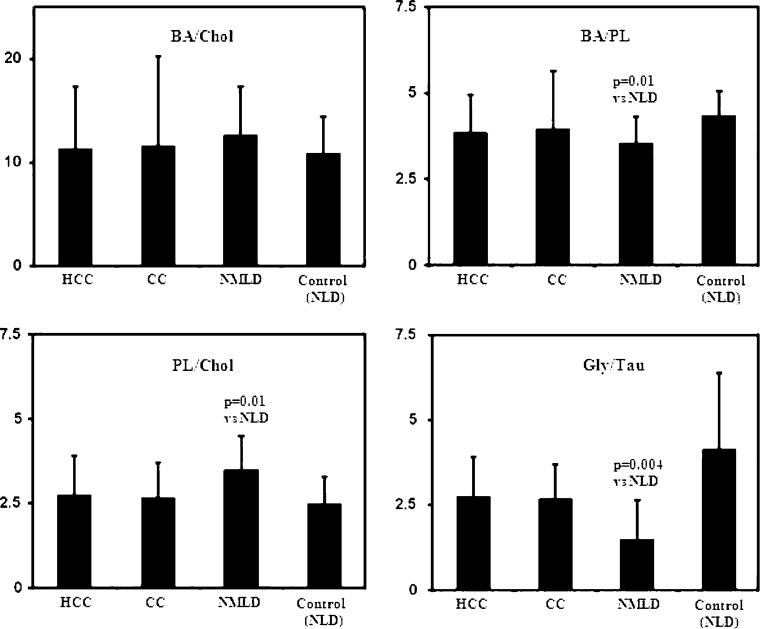
The extent of the reduction of individual bile metabolites in liver diseases varied greatly. For example, while glycine-conjugated bile acid levels were reduced to very low levels in the both malignant and NMLD, the reduction in taurine-conjugated bile acids was generally smaller (Table 2, Fig. 5). To further illustrate such compositional variations in both malignant and non-malignant diseases, ratios between some major bile metabolites were compared. As shown in Fig. 6, the ratio of glycine- to taurineconjugated bile acids (Gly/Tau) and total bile acids to phospholipids (BA/PL) were lower (p = 0.004 and p = 0.01, respectively), and the ratio of phospholipids to cholesterol (PL/Chol) was higher (p = 0.01) in NMLD compared to controls.
Fig. 6.
Comparison of the ratios between some major bile metabolites in different patient groups (HCC, n = 11; CC, n = 7; NMLD, n = 9 and NLD, n = 17). BA/Chol total bile acids to cholesterol ratio, BA/PL total bile acids to phospholipids ratio, PL/Chol phospholipids to cholesterol ratio, Gly/Tau glycine- to taurine-conjugated bile acids ratio. The errors are expressed as standard deviations. The p values between any two groups of patients, wherever significant are indicated
Discussion
A key to interpreting alterations in bile metabolites for a given liver disease state is the understanding of the consequences associated with these alterations that would allow us to identify patients at high risk for disease progression. For example, underlying liver disease is the most potent correlate to the development of primary liver cancer. However, our ability to identify which patients with Hepatitis C, NASH or alcoholic cirrhosis are at most risk for the development of cancer is unknown. To determine the ability of NMR to distinguish between controls (NLD) and liver disease or liver disease and liver cancer, we evaluated bile from several unique clinical subsets: controls, patients with underlying liver disease, patients with identifiable risk factors for cancer, but no cancer at the time of bile collection and high risk patients who have gone on to develop cancer, with the bile taken after the diagnosis of cancer was made. All bile was collected at the time of surgery. Control bile was from patients undergoing surgery for non-liver related problems. Bile from patients with underlying liver disease includes patients with Hepatitis C, NASH cirrhosis, or alcoholic cirrhosis.
Bile acids, phospholipids and cholesterol are the major constituents of bile. Bile acids alone constitute a group of a large number of mainly glycine- and taurine-conjugated derivatives. Of these, conjugates of chenodeoxycholic acid and cholic acid are the primary bile acids. Primary bile acids are directly synthesized in the liver from cholesterol. Conjugates of deoxycholic acids, in contrast, are thought to be the products of bacterial deconjugation occurring during enterohepatic circulation. This pilot study using 1H-NMR spectroscopy clearly shows altered bile homeostasis among different liver diseases and controls. Concentrations of major bile metabolites, including bile acids, are significantly reduced in liver disease. Importantly, apart from distinguishing from controls based on the homeostatic changes, the two malignant diseases, HCC and CC could be somewhat differentiated from each other, although weakly.
Several factors may contribute to the decreases in several major bile metabolites seen in liver diseases. These factors may include the impairment of bile synthesis and aberrant enterohepatic circulation, arising from the obstruction of flow of biliary metabolites due to the damaged bile ducts. However, the contribution of each effect may also depend on the nature and/or the severity of the disease process. In the present study, CC and NMLD caused the highest disturbance, while HCC caused the least. Apart from the reduction in major bile metabolites in both malignant and NMLD, altered ratios of the metabolites, in some cases to a significant limit, highlight the specific etiological contributions to the bile metabolites synthesis/enterohepatic circulation (Fig. 6). Thus, metabolite ratios, together with the generally decreased absolute concentrations, may have diagnostic value in the management of different liver diseases. For bile acids, however, the possibility of changes in their concentrations due to aberrant enterohepatic circulation with no relation to liver function can not be ruled out.
In liver diseases, aberrations in enterohepatic circulation may also result in accumulation of bile metabolites in the diseased liver. A recent study on liver tissue using high resolution magic angle sample spinning NMR spectroscopy has indicated large amounts of bile acids in liver tumors compared to the non-tumor tissue [10]. Such accumulations of bile acids in the liver may also cause their elevation in circulating blood. Indeed, bile acids in blood have been shown to increase in liver disease and their measurement in serum has been reported to have diagnostic value for liver diseases including liver cancer [15–20]. A drastic reduction in several conjugated bile acids, some even to an undetectable level (Fig. 2), may indicate that depending on the nature of cellular damage, one particular conjugated bile acid synthetic pathway may be favored over the other. Such a difference in the profiles of the same bile acids between malignant and non-malignant liver disease may potentially serve as a diagnostic tool for the cancer detection. Moreover, identifying changes in specific metabolic pathways of bile acid synthesis may have implications for prognosis, similar to the finding that the patients with liver diseases with serum chenodeoxycholic acid levels exceeding 15 μmol/L are more likely to die of the disease or need liver transplantation [17].
One of the main functions of the liver is ammonia detoxification. Ammonia produced from the deamination of amino acids is converted to urea through the urea cycle and excreted through the kidney. While nearly 50% of urinary solids constitute urea, blood contains only 2.5–7.5 μmol/mL dissolved urea. Using 1H-NMR spectroscopy, we have previously shown that in a patient with non-functional liver, urea levels decrease drastically in urine [28]. In bile, we reported the observation of a urea signal using 1H-NMR spectroscopy [24]. In the present investigation, we used this approach to show somewhat increased urea levels in benign liver diseases relative to non-liver disease controls (Table 2, Fig. 5). This is in contrast to other major bile metabolites, which decrease significantly in disease relative to controls. With the exception of a very old study reporting that urea formation and bile secretion are related [29], no definite connection between the urea and the major bile metabolites identified in this study has been documented. It remains to be seen whether the increased trend of urea levels in NMLD has anything to do with the deconjugation and deamination of taurine and/or glycine associated with bile acids. Such deconjugation has long been attributed only to gut bacterial action.
Generally, studies aimed at detecting or understanding pathological conditions are often based on the measurement of a single metabolite. For example, a decrease in the concentration of phospholipids is shown to occur in bile from patients with HCC [14], increased cholesterol levels is shown to cause gallstone diseases, increased urea is an indicator of malfunction of the liver, and altered individual bile acids levels have been implicated in several liver diseases. In reality, the biological picture is more complex: liver synthesizes bile that has cholesterol, phospholipids, urea and several conjugated bile acids as its major constituents. Observing the status of bile homeostasis through an approach that detects such multiple metabolites quantitatively and in parallel should provide more reliable information on liver status. Analytical methods that enable visualization of these metabolites in one step thus, have far reaching implications for better understanding the specific cellular functions associated with bile synthesis and/or enterohepatic circulation under normal and disease conditions. MS, a highly sensitive analytical method, has been extensively used by a number of research groups for bile acids analysis and investigating bile acid metabolism associated with liver disease [30, 31]. A more recent review describes a number of MS approaches for the quantitative analysis of lipids in intact biological samples [32]. Utilization of such advancements in MS potentially complements and supplements the analysis of multiple metabolites in human bile using NMR spectroscopy.
Conclusions
This investigation details how changes within the bile can be visualized by use of in vitro proton magnetic resonance spectroscopy of intact gallbladder bile, a simple approach that distinctly measures several major bile metabolites simultaneously. This is the first pilot study that explores variation of several major bile metabolites using a simple one step analysis NMR method in malignant and non-malignant and, non-liver disease controls. While serum-based bile acids are shown to increase in liver diseases, this investigation on bile finds that several major bile metabolites, including bile acids, significantly decrease in various liver disease states.
Although, the study was conducted on a relatively small number of patients, significant alterations in the amounts and ratios of several major metabolites potentially indicate the immense value in the diagnosis of liver diseases. To assess changes in the bile metabolites more accurately, we performed studies in bile after diluting and adjusting the pH or by dissolving in an organic medium. However, several major bile metabolites such as phospholipids, glycine-conjugated bile acids and taurine-conjugated bile acids can be detected in intact bile with reasonably good accuracy. These metabolites can be subjected to automated analysis using a software package when high throughput analysis is required.
In this study, the concentrations of bile metabolites were determined with no consideration of the differences in gall bladder bile concentration, if any. Studies that take into account such differences may further improve the classification of patients. Use of normalization approaches for the gallbladder bile data, when proved meaningful, and/or measurement of biliary drainage from the liver, would strengthen the findings of this study, provide better insights into the bile metabolic profile, and possibly open avenues for clinical applications.
Further, high sensitivity of bile homeostasis to liver function/disease combined with the high concentrations of major bile metabolites in gallbladder makes it convenient to assess bile using in vitro 1H-NMR spectroscopy and, this may possibly provide avenues for translational research in detecting and following their dynamic variations in clinical settings using non-invasive in vivo magnetic resonance spectroscopy.
Acknowledgments
This work was supported by the NIH Roadmap Initiative on Metabolomics Technology, NIH/NIDDK 3 R21 DK070290-01; the Walther Cancer Institute Multi-Institution Cancer Research Seed Project, the Purdue Oncological and Cancer Centers, and a collaborative research grant between Purdue University/Discovery Park and the Indiana University School of Medicine.
Contributor Information
G. A. Nagana Gowda, Department of Chemistry, Purdue University, West Lafayette, IN 47907, USA.
Narasimhamurthy Shanaiah, Department of Chemistry, Purdue University, West Lafayette, IN 47907, USA.
Amanda Cooper, Department of Surgery, Indiana University, Indianapolis, IN 46202, USA.
Mary Maluccio, Department of Surgery, Indiana University, Indianapolis, IN 46202, USA.
Daniel Raftery, Department of Chemistry, Purdue University, West Lafayette, IN 47907, USA.
References
- 1.Blonski W, Reddy KR. Hepatitis C virus infection and hepatocellular carcinoma. Clin Liver Dis. 2008;12(3):661–674. doi: 10.1016/j.cld.2008.03.007. [DOI] [PubMed] [Google Scholar]
- 2.Nagana Gowda GA, Zhang S, Gu H, Asiago V, Shanaiah N, Raftery D. Metabolomics-based methods for early disease diagnostics. Expert Rev Mol Diagn. 2008;8(5):617–633. doi: 10.1586/14737159.8.5.617. [DOI] [PMC free article] [PubMed] [Google Scholar]
- 3.Pan Z, Raftery D. Comparing and combining NMR spectroscopy and mass spectrometry in metabolomics. Anal Bioanal Chem. 2007;387(2):525–527. doi: 10.1007/s00216-006-0687-8. [DOI] [PubMed] [Google Scholar]
- 4.van der Greef J, Smilde AK. Symbiosis of chemometrics and metabolomics: past, present, and future. J Chemometr. 2005;19(5–7):376–386. [Google Scholar]
- 5.Pan Z, Gu H, Talaty N, Chen H, Shanaiah N, Hainline BE, Cooks RG, Raftery D. Principal component analysis of urine metabolites detected by NMR and DESI-MS in patients with inborn errors of metabolism. Anal Bioanal Chem. 2007;387:539–549. doi: 10.1007/s00216-006-0546-7. [DOI] [PubMed] [Google Scholar]
- 6.Chen H, Pan Z, Talaty N, Raftery D, Cooks RG. Combining desorption electrospray ionization mass spectrometry and nuclear magnetic resonance for differential metabolomics without sample preparation. Rapid Commun Mass Spectrom. 2006;20:1577–1584. doi: 10.1002/rcm.2474. [DOI] [PubMed] [Google Scholar]
- 7.Beger RD, Schnackenberg LK, Holland RD, Li D, Dragan Y. Metabonomic models of human pancreatic cancer using 1D proton NMR spectra of lipids in plasma. Metabolomics. 2006;2(3):125–134. [Google Scholar]
- 8.Odunsi K, Wollman RM, Ambrosone CB, Hutson A, McCann SE, Tammela J, Geisler JP, Miller G, Sellers T, Cliby W, Qian F, Keitz B, Intengan M, Lele S, Alderfer JL. Detection of epithelial ovarian cancer using H-1-NMR-based metabonomics. Int J Cancer. 2005;113(5):782–788. doi: 10.1002/ijc.20651. [DOI] [PubMed] [Google Scholar]
- 9.Burns MA, He W, Wu CL, Cheng LL. Quantitative pathology in tissue MR spectroscopy based human prostate metabolomics. Technol Cancer Res Treat. 2004;3(6):591–598. doi: 10.1177/153303460400300609. [DOI] [PubMed] [Google Scholar]
- 10.Yang Y, Li C, Nie X, Feng X, Chen W, Yue Y, Tang H, Deng F. Metabonomic studies of human hepatocellular carcinoma using high-resolution magic-angle spinning 1H NMR spectroscopy in conjunction with multivariate data analysis. J Proteom Res. 2007;6:2605–2614. doi: 10.1021/pr070063h. [DOI] [PubMed] [Google Scholar]
- 11.Vilca Melendez H, Gilani SS, Cochrane BC, Rela M, Murphy GM, Heaton ND. A validated technique for the analysis of biliary bile acid secretion in donor livers prior to transplantation. Transpl Int. 1998;11(3):216–222. doi: 10.1007/s001470050131. [DOI] [PubMed] [Google Scholar]
- 12.Cox IJ, Sharif A, Cobbold JF, Thomas HC, Taylor-Robinson SD. Current and future applications of in vitro magnetic resonance spectroscopy in hepatobiliary disease. World J Gastroenterol. 2006;12(30):4773–4783. doi: 10.3748/wjg.v12.i30.4773. [DOI] [PMC free article] [PubMed] [Google Scholar]
- 13.Kurumiya Y, Nagino M, Nozawa K, Kamiya J, Uesaka K, Sano T, Yoshida S, Nimura Y. Biliary bile acid concentration is a simple and reliable indicator for liver function after hepatobiliary resection for biliary cancer. Surgery. 2003;133(5):512–520. doi: 10.1067/msy.2003.142. [DOI] [PubMed] [Google Scholar]
- 14.Khan SA, Cox IJ, Thillainayagam AV, Bansi DS, Thomas HC, Taylor-Robinson SD. Proton and phosphorus-31 nuclear magnetic resonance spectroscopy of human bile in hepatopancreaticobiliary cancer. Eur J Gastroenterol Hepatol. 2005;17(7):733–738. doi: 10.1097/00042737-200507000-00007. [DOI] [PubMed] [Google Scholar]
- 15.Shima T, Tada H, Morimoto M, Nakagawa Y, Obata H, Sasaki T, Park H, Nakajo S, Nakashima T, Okanoue T, Kashima K. Serum total bile acid level as a sensitive indicator of hepatic histological improvement in chronic hepatitis C patients responding to interferon treatment. J Gastroenterol Hepatol. 2000;15(3):294–299. doi: 10.1046/j.1440-1746.2000.02126.x. [DOI] [PubMed] [Google Scholar]
- 16.El-Houseini ME, Amer MA, Saad Eldin AH, El-sherbiny M, Hussein TD, Mansour O. Evaluation of serum total bile acids in the diagnosis of hepatocellular carcinoma. J Egyptian Nat Cancer Inst. 2000;12(4):307–313. [Google Scholar]
- 17.Azer SA, Coverdale SA, Byth K, Farrell GC, Stacey NH. Sequential changes in serum levels of individual bile acids in patients with chronic cholestatic liver disease. J Gastroenterol Hepatol. 1996;11(3):208–215. doi: 10.1111/j.1440-1746.1996.tb00064.x. [DOI] [PubMed] [Google Scholar]
- 18.Jönsson G, Hedenborg G, Wisén O, Norman A. Serum concentrations and excretion of bile acids in cirrhosis. Scand J Clin Lab Invest. 1992;52(7):599–605. doi: 10.1080/00365519209115502. [DOI] [PubMed] [Google Scholar]
- 19.Samuelson K, Aly A, Johansson C, Norman A. Serum and urinary bile acids in patients with primary biliary cirrhosis. Scand J Gastroenterol. 1982;17(1):121–128. doi: 10.3109/00365528209181055. [DOI] [PubMed] [Google Scholar]
- 20.Fausa O, Gjone E. Serum bile acid concentrations in patients with liver disease. Scand J Gastroenterol. 1976;11(5):537–543. [PubMed] [Google Scholar]
- 21.Prescot AP, Collins DJ, Leach MO, Dzik-Jurasz AS. Human gallbladder bile: noninvasive investigation in vivo with single-voxel 1H MR spectroscopy. Radiology. 2003;229(2):587–592. doi: 10.1148/radiol.2292021156. [DOI] [PubMed] [Google Scholar]
- 22.Künnecke B, Bruns A, von Kienlin M. Non-invasive analysis of gallbladder bile composition in cynomolgus monkeys using in vivo 1H magnetic resonance spectroscopy. Biochim Biophys Acta. 2007;1771(4):544–549. doi: 10.1016/j.bbalip.2007.01.006. [DOI] [PubMed] [Google Scholar]
- 23.Nagana Gowda GA, Ijare OB, Somashekar BS, Sharma A, Kapoor VK, Khetrapal CL. Single step analysis of individual conjugated bile acids in human bile using 1H NMR spectroscopy. Lipids. 2006;41:591–603. doi: 10.1007/s11745-006-5008-7. [DOI] [PubMed] [Google Scholar]
- 24.Nagana Gowda GA, Somashekar BS, Ijare OB, Sharma A, Kapoor VK, Khetrapal CL. One step analysis of major bile metabolites in human bile using 1H NMR spectroscopy. Lipids. 2006;41:577–589. doi: 10.1007/s11745-006-5007-8. [DOI] [PubMed] [Google Scholar]
- 25.Ijare OB, Somashekar BS, Jadegoud Y, Nagana Gowda GA. 1H and 13C NMR characterization and stereochemical assignments of bile acids in aqueous media. Lipids. 2005;40:1031–1041. doi: 10.1007/s11745-005-1466-1. [DOI] [PubMed] [Google Scholar]
- 26.Ijare OB, Somashekar BS, Nagana Gowda GA, Sharma A, Kapoor VK, Khetrapal CL. Quantification of glycine and taurine conjugated bile acids in human bile using 1H NMR spectroscopy. Magn Reson Med. 2005;53(6):1441–1446. doi: 10.1002/mrm.20513. [DOI] [PubMed] [Google Scholar]
- 27.Srivastava M, Jadegoud Y, Nagana Gowda GA, Sharma A, Kapoor VK, Khetrapal CL. An accurate method for cholesterol analysis in bile. Anal Lett. 2005;38:2135–2141. [Google Scholar]
- 28.Singh HK, Yachha SK, Saxena R, Gupta A, Nagana Gowda GA, Bhandari M, Khetrapal CL. Dimension of 1H NMR spectroscopy in assessment of liver graft dysfunction. NMR Biomed. 2003;16:185–188. doi: 10.1002/nbm.829. [DOI] [PubMed] [Google Scholar]
- 29.Noël-Paton D. Nature of the relationship of urea formation to bile secretion. J Anat Physiol. 1886;20(4):662–673. [PMC free article] [PubMed] [Google Scholar]
- 30.Griffiths WJ. Tandem mass spectrometry in the study of fatty acids, bile acids, and steroids. Mass Spectrom Rev. 2003;22(2):81–152. doi: 10.1002/mas.10046. [DOI] [PubMed] [Google Scholar]
- 31.Yang Y, Griffiths WJ, Nazer H, Sjovall J. Analysis of bile acids and bile alcohols in urine by capillary column liquid chromatography-mass spectrometry using fast ion atom bombardment or electrospray ionization and collision induced dissociation. Biomed Chromatogr. 1997;11:240–255. doi: 10.1002/(SICI)1099-0801(199707)11:4<240::AID-BMC686>3.0.CO;2-6. [DOI] [PubMed] [Google Scholar]
- 32.Han X, Gross RW. Shotgun lipidomics: electrospray ionization mass spectrometric analysis and quantitation of cellular lipidomes directly from crude extracts of biological samples. Mass Spectrom Rev. 2005;24(3):367–412. doi: 10.1002/mas.20023. [DOI] [PubMed] [Google Scholar]


