

Abstract
Regulated in DNA Damage and Development 1 (REDD1) functions to repress signaling through the mechanistic target of rapamycin (mTOR) protein kinase in complex 1 (mTORC1) in response to diverse stress conditions. In the present study, we investigated the role of REDD1 in the response of cells to growth cessation induced by serum deprivation. REDD1 expression was induced within 2 h of depriving cells of serum, with the induction being mediated through ER stress, as evidenced by activation of PERK, enhanced eIF2α phosphorylation, and ATF4 facilitated transcription of the REDD1 gene. In wild-type cells, signaling through mTORC1 was rapidly (within 30 min) repressed in response to serum deprivation and the repression was sustained for at least 10 h. In contrast, in REDD1 knockout cells mTORC1 signaling recovered toward the end of the 10 h-deprivation period. Interestingly, Akt phosphorylation initially declined in response to serum deprivation and then recovered between 2 and 4 h in wild-type but not REDD1 knockout cells. The recovery of mTORC1 signaling and the failure of Akt phosphorylation to do so in the REDD1 knockout cells were accompanied by a dramatic increase in caspase-3 cleavage and cell death, both of which were blocked by rapamycin. Furthermore, overexpression of constitutively active Akt rescued REDD1 knockout cells from serum deprivation induced cell death. Overall, the results implicate REDD1 as a key regulatory checkpoint that coordinates growth signaling inputs to activate pro-survival mechanisms and reduce susceptibility to cell death.
Keywords: DDIT4, Rtp801, PERK, ATF4, autophagy
1. Introduction
The serine-threonine protein kinase mechanistic target of rapamycin (mTOR) is the master regulator of cell growth and is principally responsible for coordinating the cellular response to growth factors and nutrient sufficiency (1). The kinase exists in two complexes with distinct functions; activation of mTOR complex 1 (mTORC1) promotes cell cycle progression and anabolic processes including ribosome biogenesis, de novo lipogenesis, and protein synthesis, whereas mTOR complex 2 (mTORC2) modulates cell survival and migration (2). The complexes also differ in their sensitivity to inhibition by the macrolide immunosuppressant rapamycin, with mTORC1 being rapidly and directly inhibited whereas mTORC2 is inhibited in some, but not all, cell types and only after prolonged treatment (3). Inhibition of mTORC1 by rapamycin results in a reduction in both cell size and growth rate similar to that observed following nutrient or growth factor deprivation (4).
Activation of mTORC1 is controlled by two convergent signaling pathways, one of which is regulated by amino acids and the other by anabolic hormones such as insulin and insulin-like growth factor 1 (IGF1) (5). Amino acids regulate mTORC1 signaling through a heterodimeric complex consisting of either Ras-related GTP binding (Rag) A or B and Rag C or D (6). On the other hand, insulin and IGF1 regulate mTORC1 signaling through the small GTPase, ras homolog enriched in brain (Rheb) (7). The Rag heterodimer and Rheb act in a cooperative manner to facilitate mTORC1 activation, and activation of both pathways is necessary for optimal stimulation of mTORC1 signaling (5).
Several upstream repressors of mTORC1 signaling have been described including a protein referred to as regulated in development and DNA damage responses (REDD1; aka DNA-damage-inducible transcript 4, DDIT4) (8). REDD1 was initially identified as a stress response gene that was induced in response to hypoxia and oxidative stress (9), but was subsequently shown to also be induced in response to glucocorticoid treatment (10), nutrient deprivation (11) and other stress conditions (9,12,13). Conversely, REDD1 expression is reduced under growth-promoting conditions including refeeding a fasted animal (11) or in skeletal muscle after a bout of resistance exercise (e.g. 14). The molecular mechanism through which REDD1 acts to repress mTORC1 signaling is unclear, however, a variety of evidence suggests that it acts downstream of Akt but upstream of the tuberous sclerosis complex (TSC) to inhibit mTORC1 signaling (12). In the absence of REDD1, Akt phosphorylates TSC2 and inhibits its GTPase activator function toward Rheb. When it is associated with GTP, but not GDP, Rheb activates mTORC1. Thus, REDD1 inhibits mTORC1 signaling by activating TSC2, thereby increasing the proportion of Rheb in the GDP bound form.
In the present study we tested the hypothesis that REDD1 expression is induced by serum deprivation, and that its induction functions to maintain attenuation of mTORC1 signaling. We show that signaling through mTORC1 to downstream targets, including ULK1, is rapidly (within 30 min) repressed, and is maintained for at least 10 h. We also show that expression of REDD1 is induced within 2 h of depriving cells of serum, and its induction is required for maintenance of mTORC1 repression during prolonged serum deprivation. Notably, in mouse embryo fibroblasts (MEF) lacking REDD1, but not in wild type MEF, prolonged serum deprivation leads to recovery of mTORC1 signaling which is associated with cleavage of caspase-3 and increased cell death, both of which are prevented by inhibition of mTORC1 using rapamycin. Overall, the results support a model in which induction of REDD1 expression under starvation conditions acts to protect cells from inadvertent stimulation of mTORC1, and thus induction of cell death.
2. Materials and Methods
2.1 Cell culture
Rat 2 fibroblasts, wild-type (REDD1+/+) and REDD1 knockout MEF (REDD1−/−; kindly provided by Dr. Leif Ellison) were maintained at 37 °C and 5% CO2 in high glucose Dulbecco’s modified eagle medium (DMEM, Invitrogen) supplemented with 1% penicillin/streptomycin (Invitrogen) and 10% heat-inactivated fetal bovine serum (FBS, Atlas Biologicals) or Tet System Approved FBS (Clonetech), respectively. Activating transcription factor 4 knockout MEF (ATF4−/−; kindly provided by Drs. David Ron and Heather Harding) were maintained similarly with the addition of 55 μM β-mercaptoethanol (Invitrogen) and 1× nonessential amino acids (Invitrogen) as previously described (15). Where indicated cell culture medium was supplemented with 100 nM rapamycin, 1μM wortmannin, or 1 μM Akt inhibitor VIII (EMD Millipore). Transfections were performed using X-tremeGENE HP (Roche Applied Science) with a 3:1 ratio of reagent to DNA (μl/μg) according to the manufacturer’s instructions. The following plasmids were used in transfections: pCMV5 control plasmid, pCMV5-HA-caAkt encoding constitutively active Akt (purchased from Addgene; submitted by Dr. Mien-Chie Hung), and pCMV5-HA-dnAkt encoding dominant negative Akt (purchased from Addgene; submitted by Dr. Philip Tsichlis). To evaluate LC3 puncta formation, cells were seeded onto cover slips and transfected with GFP-LC3 plasmid. The next day cells were serum deprived as indicated and fixed with 4% paraformaldehyde in PBS. Fluorescence images were obtained with a Nikon Eclipse E800 fluorescence microscope. Cell viability was assessed by trypan blue dye exclusion.
2.2 Western blot analysis
Cells were harvested in SDS sample buffer and subjected to SDS-PAGE and Western blot analysis as previously described (16). Anti-REDD1 antibody was purchased from ProteinTech Group Inc., anti-active Caspase 3 antibody was from Millipore, anti-GAPDH and tubulin from Santa Cruz, and anti-ATF4 was generously provided by Dr. Michael Kilberg. Anti-p70S6K1 phospho-Thr389, 4E-BP1 phospho-Ser65, protein kinase RNA-like endoplasmic reticulum kinase (PERK) phospho-Thr980, eIF2α phospho-Ser51, ULK1 phospho-Ser757, and Akt phospho-Ser473 were from Cell Signaling Technology.
2.3 RNA analysis
RNA was extracted from cells with TRIzol reagent (Invitrogen) according to the manufacturer’s protocol. RNA (1 μg) was used to generate complementary cDNA using the High Capacity cDNA Reverse Transcription kit (Applied Biosystems). REDD1 and REDD2 mRNA in each sample was determined in triplicate by quantitative real-time PCR (qPCR) analysis using primers previously described for rat (10) or mouse (15). REDD1 mRNA expression was normalized to β-actin mRNA within each sample. XBP1 processing was assessed using PCR primers as previously described (17).
2.4 Analysis of REDD1 gene transcription
REDD1 gene transcription was assessed by nuclear run-on analysis. Briefly, nuclei from Rat2 fibroblasts were collected and prepared as previously described (18). Biotin-16-UTP (Roche Applied Science) or unlabeled UTP was added to reach a final concentration of 0.38 mM. Reactions were incubated for 30 min at 29 °C and stopped with the addition of 7.5 mM CaCl2 and DNase I (Roche Applied Science). RNA was isolated with TRIzol (Invitrogen) and Biotin-labeled RNA was isolated with streptavidin-conjugated magnetic beads (Dynabeads M-280 Streptavidin, Invitrogen) according to manufacturer’s instructions and used to generate cDNA. Beads were treated with RNase for 20 min and the cDNA containing supernatant was used qPCR analysis as described above.
2.4 Statistical analysis
Data are presented as means ± SEM. One-way analysis of variance and Student’s t test were used to compare differences among groups. p < 0.05 was considered statistically significant.
3. Results
3.1 Serum deprivation induces REDD1 transcription
To evaluate the response of cells to serum deprivation, Rat2 fibroblasts were grown to ~60–80% confluence in DMEM containing 10% heat-inactivated FBS and then transferred to medium that was devoid of FBS. As expected, mTORC1 signaling was rapidly (within 30 min) attenuated after placing cells in medium lacking serum, as evidenced by a reduction in phosphorylation of mTORC1 substrate p70S6K1 on Thr389 (Fig 1A). Similarly, phosphorylation of Akt on Ser473 was reduced after 30 min of serum deprivation. However unlike mTORC1 signaling, which remained repressed during 10 h of serum deprivation, phosphorylation of Akt on Ser473 increased 3.6-fold between 2 and 10 h of serum deprivation (compare Fig 1A lanes #7–8 with #11–12). Since, activation of Akt would be expected to enhance mTORC1 activity, a mechanism(s) must exist to prevent mTORC1 activation under conditions of prolonged serum deprivation. Thus, we sought to identify the mechanism(s) and physiological relevance of the discordant Akt/mTORC1 signaling under these conditions.
Figure 1. Serum deprivation induces expression of the mTORC1 inhibitor REDD1.

Rat2 fibroblasts were grown in complete medium containing 10% FBS and then transferred to medium that was devoid of FBS (SFM) as indicated. (A) Phosphorylation of p70S6K1 on Thr389 and Akt on Ser473 as well as expression of REDD1 and tubulin were assessed in whole cell lysates by Western blot analysis. Representative blots are shown. (B) Following 2 h of serum deprivation REDD1 protein was assessed in whole cell lysates by Western blot analysis and is expressed relative to tubulin. Expression of mRNA was assessed by qPCR analysis of REDD1 and GAPDH mRNA extracted from Rat2 fibroblasts. Results represent means ± SEM (n = 4) for two independent experiments. (C) Transcription of REDD1, actin, and GAPDH mRNA were evaluated in nuclei harvested from Rat2 fibroblasts following 2 h of serum deprivation by nuclear run-on assay as described under Materials and Methods. Results represent means ± SEM (n = 3). *p<0.05 vs respective control.
The stress-responsive protein REDD1 was previously identified as being responsible for inhibiting mTORC1 signaling downstream of Akt under conditions of cellular stress (19), and therefore the possibility that serum deprivation might induce REDD1 expression was assessed. As shown in Fig 1A, REDD1 protein was elevated within 2 h of serum deprivation and remained at an elevated level for at least 10 h. To explore the mechanism involved in induction of REDD1 during serum deprivation, REDD1 protein and mRNA were examined in cells incubated in complete growth medium or following 2 h of serum deprivation. Compared to cells maintained in complete medium, serum deprivation led to a 2.3-fold induction of REDD1 protein expression concomitant with a 1.7-fold induction of mRNA expression (Fig. 1B).
An increase in mRNA expression could be due to either enhanced transcription of the gene, reduced turnover of the message, or both. No significant difference in REDD1 mRNA half-life was observed in serum-deprived compared to control cells. Therefore, nuclear run-on analysis was performed to measure REDD1 gene transcription. Compared to cells grown in complete medium, REDD1 gene transcription was elevated 4-fold following 4 h of serum deprivation (Fig. 1C). A similar effect was not observed with actin mRNA transcription, which exhibited a trend toward repression, likely reflecting a reduction in transcription of most messages under serum deprived conditions.
3.2 ATF4 mediates REDD1 induction during serum deprivation
Our laboratory (20) and others (21) have previously demonstrated that REDD1 mRNA expression is enhanced in response to ER stress, due to enhanced expression of the transcription factor ATF4. Moreover, activation of ER stress by deprivation of serum and growth factors has been previously observed in other cell culture models (22–24), although the response is poorly characterized. Therefore, biomarkers of ER stress were examined to assess whether or not serum deprivation-induced ER stress might be involved in the induction of REDD1 expression. Phosphorylation of eIF2α on Ser51 as well as autophosphorylation of the cytoplasmic kinase domain of the eIF2α kinase, PERK, on Thr980 were rapidly enhanced in response to serum deprivation (Fig 2A). Moreover, processing of the mRNA encoding X-box binding protein 1 (XBP1), which involves the removal of a 26-base intron by the ER-resident inositol-requiring enzyme 1 (IRE1), was significantly increased during serum deprivation (Fig 2B). While the majority of XBP1 mRNA was present in the higher molecular weight unspliced form in cells maintained in serum-containing medium, following 4 h of serum deprivation the lower molecular weight spliced XBP1 mRNA was increased by 9.8-fold.
Figure 2. REDD1 induction by serum deprivation requires ATF4.
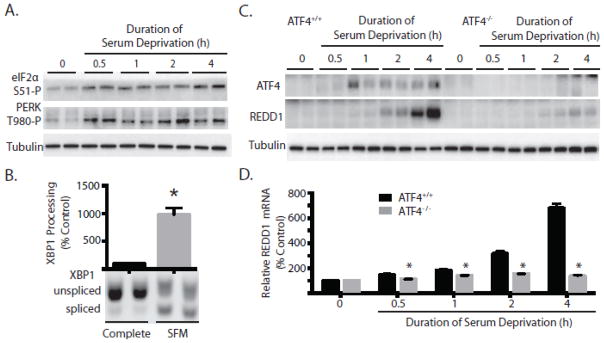
(A) Rat2 fibroblasts were grown in complete medium containing 10% FBS and then transferred to medium that was devoid of FBS (SFM) as indicated. Phosphorylation of eIF2α on Ser51 and PERK on Thr980 as well as tubulin expression were assessed in whole cell lysates by Western blot analysis. Results are representative from two independent experiments with each condition independently assessed twice within each experiment. (B) PCR analysis of XBP1 splicing was performed as described under Materials and Methods. Results represent means ± SEM (n = 4) for two independent experiments. ATF4+/+ and ATF4−/− mouse embryonic fibroblasts (MEF) were serum deprived for various periods of time as indicated in the figure. (C) Expression of ATF4, REDD1, and tubulin were assessed in whole cell lysates by Western blot analysis. Representative blots are shown. (D) qPCR analysis was performed on RNA extracted from ATF4+/+ (black bars) or ATF4−/− (gray bars) MEF for REDD1 relative to GAPDH mRNA. Results represent means ± SEM (n = 4) for two independent experiments with each condition independently assessed twice within each experiment. *p<0.05 vs respective control.
Expression of ATF4 is enhanced under conditions that promote phosphorylation of the translation initiation factor, eIF2α (25), and in agreement with a previous report (26), eIF2α phosphorylation was increased in cells deprived of serum (Fig. 2A). Therefore, the possibility that enhanced ATF4 expression might be involved in the induction of REDD1 expression in response to serum deprivation was investigated. ATF4+/+ and ATF4−/− MEF were grown in medium supplemented with serum and then serum deprived for various periods of time. As expected, upon serum deprivation, elevated ATF4 expression was only observed in ATF4+/+ MEF (Fig 2C). Notably, whereas REDD1 protein expression was markedly induced after 4 h of serum deprivation in ATF4+/+ MEF, a similar effect was not observed in ATF4−/− MEF (Fig 2C). To further assess the role of ATF4 in REDD1 gene transcription during serum deprivation, the expression of REDD1 mRNA relative to GAPDH was evaluated by qPCR. REDD1 mRNA expression was induced by 7.3-fold following 4 h of serum deprivation in ATF4+/+ MEF, whereas there was no change in ATF4−/− MEF (Fig 2D). The effect of serum deprivation was specific for REDD1, because REDD2 mRNA expression was not elevated in either cell type during serum deprivation (results not shown). Overall, these results demonstrate that serum deprivation produces ER-stress leading to induction of REDD1 transcription.
3.3 REDD1 sustains repression of mTORC1 signaling during prolonged serum deprivation
To provide evidence in support of the idea that induction of REDD1 expression acts to maintain repression of mTORC1 signaling during prolonged serum deprivation, phosphorylation of p70S6K1 on Thr389, 4E-BP1 on Ser65, and ULK1 on Ser757 was compared in lysates of REDD1+/+ and REDD−/− MEF. Phosphorylation of all three mTORC1 substrates was rapidly reduced in both REDD1+/+ and REDD1−/− MEF following serum deprivation (Fig 3A). Strikingly, with longer duration of serum deprivation (10 h), phosphorylation of all three proteins returned toward control values (i.e. serum-supplemented condition) in REDD1−/− but not in REDD1+/+ MEF. In fact from 2 to 10 h of serum deprivation (when REDD1 induction was most notable in REDD1+/+ MEF), phosphorylation of p70S6K1, rose by 640% in REDD1−/− MEF with no significant change in REDD1+/+ MEF (Fig 3B-D). Elevated phosphorylation of mTORC1 substrates in the absence of REDD1 demonstrates that REDD1 induction during serum deprivation was particularly important in maintaining mTORC1 repression with longer duration of serum deprivation.
Figure 3. REDD1 maintains inhibition of mTORC1 signaling during serum deprivation.

(A) REDD1+/+ and REDD1−/− mouse embryonic fibroblasts (MEF) were serum deprived as indicated. Phosphorylation of p70S6K1 on Thr389, 4E-BP1 on Ser65, and ULK1 on Ser757, as well as expression of REDD1 and tubulin were assessed in whole cell lysates by Western blot analysis. Representative blots are shown. Quantitation of phosphorylation of p70S6K1 on Thr389 (B), 4E-BP1 on Ser65 (C) and ULK1 Ser757 (D) from Western blots in A expressed relative to GAPDH. Results represent means ± SEM (n = 4) from two independent experiments with each condition independently assessed twice within each experiment. *p<0.05 vs respective control. (E) REDD1+/+ and REDD1−/− MEF were seeded onto cover slips and transfected with GFP-LC3 plasmid. The next day cells were serum deprived as indicated and fixed for fluorescence imaging using a Nikon Eclipse E800 fluorescence microscope. Representative images are shown.
3.4 REDD1 is permissive for autophagy in response to serum deprivation
Since autophagy is initiated in response to mTORC1 inhibition, the hypothesis was investigated that REDD1 contributes to its initiation during serum deprivation. Under normal growth conditions, mTORC1 phosphorylates ULK1 on Ser757, resulting in repression of autophagy (27). In MEF maintained in medium supplemented with serum, phosphorylation of ULK1 was elevated by 50% in REDD1−/− compared to REDD1+/+ MEF (Fig 3D). In response to serum deprivation, ULK1 phosphorylation was reduced in both cell types, such that there was no significant difference between REDD1−/− and REDD1+/+ MEF after 2 h of serum deprivation. Notably, phosphorylation of ULK1 was restored with prolonged serum deprivation in REDD1−/−, but not REDD1+/+ MEF (Fig 3D), suggesting that REDD1 acts to sustain autophagy during serum deprivation. Another marker of autophagy, autophagy marker light chain 3 (LC3) was also accessed to further evaluate this conclusion. During autophagy, the cytoplasmic form of this protein (LC3-I) is recruited to autophagosomes, where it is post-translationally modified by site-specific proteolysis and lipidation into LC3-II (28). When cells were transiently transfected with LC3-GFP, vesicular formation increased in both REDD1−/− and REDD1+/+ MEF after 4 h of serum deprivation (Fig 3E). Together these results demonstrate that REDD1 is permissive for autophagy during prolonged serum deprivation.
3.5 REDD1-mediated inhibition of mTORC1 is critical for cell survival during serum deprivation
Autophagy is often initiated as a survival response to cell starvation to prevent or delay cell death. To gain insight into the role of REDD1 induction in response to serum deprivation, cell viability was evaluated. After 10 h of serum deprivation, REDD1−/− MEF exhibited a 4-fold increase in cell death as compared to REDD1+/+ MEF (Fig 4A). To determine the role of mTORC1 in the increased REDD1−/− MEF cell death, serum-deprivation medium was supplemented with rapamycin to prevent the “inappropriate” mTORC1 activation. In the presence of rapamycin, REDD1−/− MEF cell death following 10 h of serum deprivation was reduced, such that it was no longer significantly different than that observed in REDD1+/+ MEF (Fig 4A). To examine the nature of cell death, cleavage of the apoptotic marker caspase 3 was assessed and found to be enhanced over 3-fold following 10 h of serum deprivation in REDD1 −/− MEF, whereas there was no change in REDD1+/+ MEF (Fig 4B-C). In addition to attenuating the serum-deprivation-induced reduction in cell viability (Fig 4A), mTORC1 inhibition with rapamycin also attenuated caspase 3 cleavage in REDD1 −/− MEF (Fig 4D).
Figure 4. REDD1-mediated inhibition of mTORC1 promotes cell survival during serum deprivation.

(A) Cell viability was assessed in REDD1+/+ and REDD1−/− MEF by trypan blue dye exclusion in complete medium or following 10 h in medium lacking serum (SFM) in the presence or absence of 100 nM rapamycin. Results represent means ± SEM (n = 4) from two independent experiments with each condition independently assessed twice within each experiment. (B) Caspase 3 cleavage was assessed in whole cell lysates by Western blot analysis. Representative blots are shown. (C) Quantitation of caspase 3 cleavage from Western blot in B. Results represent means ± SEM (n = 4) from two independent experiments with each condition independently assessed twice within each experiment. (D) Phosphorylation of caspase 3 cleavage, p70S6K1 on Thr389, REDD1 and GAPDH were assessed by Western blot analysis in cells treated as described in C. Representative blots are shown. *p<0.05 vs respective control.
3.6 REDD1 facilitates cell survival by promoting activation of Akt
One potential mechanism through which re-activation of mTORC1 could inhibit cell survival is through multiple negative feedback pathways that act to suppress Akt. It is well established that activation of Akt promotes cell survival and prevents apoptosis in response to a variety of stimuli (29). Recently, Jin et al (30) demonstrated that REDD1 plays a key role in activation of Akt to promote cell survival. Consequently, to further investigate the mechanism responsible for improved cell viability in response to REDD1 induction, Akt phosphorylation was evaluated in lysates of REDD1+/+ and REDD−/− MEF. Similar to Rat2 cells (Fig 1A), phosphorylation of Akt on Ser473 was rapidly reduced by serum deprivation (30 min) in REDD1+/+ MEF, but recovered with more prolonged deprivation (Fig 5A). In contrast, Akt phosphorylation did not recover in REDD1−/− MEF subjected to prolonged serum deprivation. Indeed, Akt phosphorylation continued to fall such that it was almost undetectable after 10 h of deprivation.
Figure 5. REDD1-induced Akt phosphorylation mediates cell survival during prolonged serum deprivation.

(A) REDD1+/+ and REDD1−/− mouse embryonic fibroblasts (MEF) were serum deprived as indicated. Phosphorylation of Akt on Ser473 and GAPDH expression were evaluated by Western blot analysis. Representative blots are shown. (B) Cell viability was assessed in REDD1+/+ and REDD1−/− MEF following 10 h of serum deprivation in the presence or absence of 1μM wortmannin or 1μM Akt inhibitor VIII. (C) Cell viability was assessed in REDD1+/+ and REDD1−/− MEF following 10 h of serum deprivation (SFM) with the transient overexpression of dominant negative Akt (dnAkt), constitutively active Akt (caAkt), or empty vector (EV). Results represent means ± SEM (n = 4) from two independent experiments with each condition independently assessed twice within each experiment. with each condition independently assessed twice within each experiment
To evaluate the role of REDD1-mediated Akt activation in serum deprivation-induced cell death, REDD1+/+ and REDD1−/− MEF were subjected to serum-deprivation in medium supplemented with inhibitors to block activation of Akt (31). Whereas REDD1−/− MEF exhibited increased cell death as compared to REDD1+/+ MEF following 10 h of serum deprivation; wortmannin and Akt inhibitor VIII increased cell death in REDD1+/+ MEF, such that it was no longer significantly different than in REDD1−/− MEF in the presence or absence of either inhibitor (Fig 5B). This finding provides support for the conclusion that activation of Akt is an important event in maintaining cell viability during serum deprivation. To provide further support for a role for Akt in maintaining cell viability during serum starvation, a kinase dead (K179M) dominant negative variant of Akt (dnAkt) was expressed in REDD1+/+ and REDD1−/− MEF. As shown in Fig 5C, expression of dnAkt increased cell death in REDD1+/+ such that it was no longer significantly different than that observed in REDD1−/− MEF. Conversely, a constitutively active variant of Akt (caAkt) reduced serum deprivation-induced cell death in REDD1−/− MEF to levels that were similar to those observed in REDD1+/+ MEF. Together, these findings support the conclusion that REDD1 plays a critical role in cell survival by coordinating activity of the Akt/mTORC1 signaling pathway in response to withdrawal of growth factors from cell culture medium.
4. Discussion
In the present study, phosphorylation of mTORC1 substrates was repressed within 30 min of switching cells to medium lacking serum. However, enhanced REDD1 protein expression was not detected until later time points, a finding consistent with the conclusion that REDD1 does not contribute to the initial repression of mTORC1 signaling associated with serum deprivation. Instead, the initial repression was likely mediated by a reduction in hormone-induced signaling through upstream kinases such as Akt. Indeed, the initial fall in mTORC1 signaling was mirrored by a reduction in Akt phosphorylation. If the initial serum deprivation-induced repression of mTORC1 signaling is mediated by a reduction in Akt signaling, what purpose does increased REDD1 induction serve? The results of the present study strongly support the conclusion that REDD1 acts to maintain repression of mTORC1 signaling during prolonged starvation periods. Thus, whereas repressed phosphorylation of S6K1, 4E-BP1, and ULK1 was maintained for at least 10 h in REDD1+/+ MEF, phosphorylation of the mTORC1 substrates was surprisingly restored in REDD1−/− MEF with prolonged serum deprivation.
One potential mechanism that could be responsible for the reactivation of mTORC1 involves induction of autophagy. In cells maintained in complete, serum-supplemented medium, mTORC1 strongly inhibits autophagy by regulating the activity of the ULK1 protein kinase complex that is required for formation of autophagosomes (27). Our results support the previous finding that autophagy is induced within 30 min of placing cells in serum-free medium as assessed by decreased phosphorylation of ULK1 on Ser638 and Ser758 (32). Paradoxically, even though mTORC1 is normally acutely activated in response to increased intracellular amino acid concentrations (33), during prolonged incubation in medium lacking serum mTORC1 signaling apparently remains insensitive to the amino acids that are derived from autophagy and/or proteasome activity. Due to its potent growth promoting functions, stimulation of mTORC1 under starvation conditions would be detrimental, resulting in development of a futile cycle in which amino acids and fatty acids generated by autophagy would be reincorporated into proteins and lipids, respectively. Thus, the present study suggests REDD1 functions to prevent inappropriate activation of mTORC1 under conditions that activate autophagy.
A recent report (34) showed that dexamethasone-induced cell death occurs to a significantly greater extent in REDD1-deficient compared to –sufficient cells, and that the increase in cell death in deficient cells is associated with repressed activation of autophagy. The results of other studies (e.g. 9,30) confirm that REDD1 acts to control cell survival, and that it does so by modulating apoptosis. Thus, in most cells induction of REDD1 expression acts to protect cells from stress-induced apoptosis, whereas reduced expression of the protein has the opposite effect. Consistent with this conclusion, in the present study, 10 h of serum deprivation had no effect on survival in REDD1+/+ MEF, but dramatically enhanced cell death in REDD1−/− MEF. The enhancement of cell death occurred concomitantly with cleavage of caspase-3, which was associated with reduced phosphorylation of Akt in REDD1−/− compared to REDD1+/+ MEF. Phosphorylation of Akt on both the activation loop at Thr308 by PDK1 (35) and phosphorylation of the carboxy-terminus at Ser473 by mTORC2 (36) is necessary for full activation of the kinase. Signaling through both PDK1 and mTORC2 is repressed through multiple negative feedback pathways mediated by mTORC1 and S6K1. Specifically, mTORC1 phosphorylates growth factor receptor bound protein (Grb10) to suppress insulin receptor-dependent phosphorylation of IRS-1 (37,38). In a complementary pathway, S6K1 phosphorylates IRS-1 on serine residues leading to its degradation (39) and also phosphorylates rictor, a protein unique to mTORC2 (40). Notably, in the present study, when the activity of Akt was maintained by expression of a constitutively active variant, cell death in REDD1−/− MEF was reduced to levels observed in REDD1+/+ MEF. Because Akt acts to repress caspase-3 cleavage and apoptosis by phosphorylating BCL2-Antagonist Of Cell Death (Bad) (29), it is tempting to speculate that maintenance of Akt phosphorylation promotes cell survival by repressing Bad-mediated induction of apoptosis.
Berlanga et al (41) demonstrated that general control non-derepressing kinase-2 (GCN2) is responsible for phosphorylation of eIF2α in HEK293T cells when maintained in medium lacking serum. However in the present study, serum deprivation failed to activate GCN2 in Rat2 cells, as assessed by phosphorylation of its activation loop on Thr898, whereas deprivation of both serum and leucine clearly caused enhanced GCN2 phosphorylation (data not shown). While poorly characterized, activation of ER stress in response to deprivation of serum and growth factors has been previously observed in multiple cell culture models (22–24). Serum deprivation produces a coordinated release of Ca+2 from the ER and enhances markers of ER stress, including expression of glucose-regulated protein 78 (GRP78, aka BiP) and caspase cleavage (39). Our laboratory (20) and others (21) have previously demonstrated that REDD1 mRNA expression is enhanced in response to ER stress, however this is the first report that withdrawal of growth factors in the form of serum deprivation results in induction of REDD1 transcription. Additionally, the present study supports the previous observation that activation of ER stress during serum deprivation plays a cytoprotective role (23), and implicates REDD1 as an important mediator of the response.
The induction of REDD1 expression in response to serum deprivation in the present study is consistent with findings from previous studies showing that in Drosophila, larvae subjected to a starvation regime exhibit induction of mRNA expression of the REDD1 orthologs scylla and charybdis (42). Furthermore, our laboratory has demonstrated that food deprivation promotes REDD1 expression in rat skeletal muscle, and that re-feeding rapidly (within 45 min) restores expression of the protein to the value observed in freely-fed rats (11). The present study extends the earlier ones and supports a model in which serum deprivation-induced induction of REDD1 expression occurs through a mechanism involving activation of the ER-resident eIF2α kinase PERK, and subsequent enhancement of ATF4 expression, and REDD1 functions to coordinate mTORC1/Akt signaling in a manner that facilitates cell survival (Fig 6).
Figure 6. REDD1-mediated Akt activation promotes cell survival during serum deprivation.
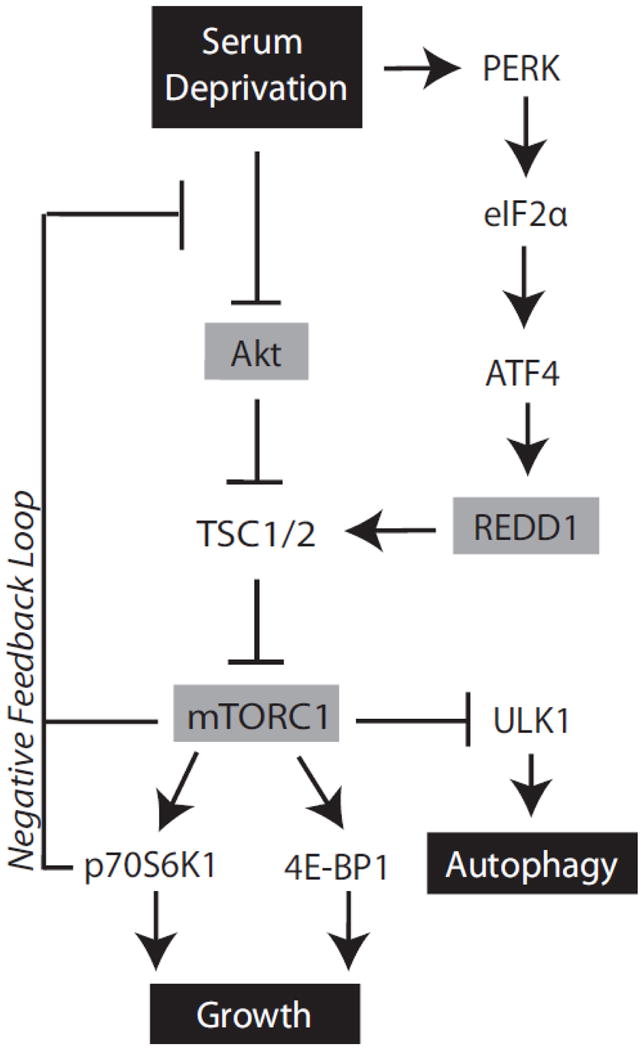
Working model for serum deprivation induced mTORC1 inhibition. Serum deprivation leads to activation of PKR-like ER-localized kinase (PERK), which phosphorylates the eIF2α subunit to promote expression of activating transcription factor 4 (ATF4), and elevated REDD1 mRNA transcription. REDD1-mediated inhibition of mTORC1 during prolonged serum deprivation facilitates relief of a negative feedback pathway to promote activation of Akt in a manner that promotes cell survival.
5. Conclusions
Taken together, the data from the present study provide evidence that REDD1 is a vital component in the response of cells to growth cessation induced by serum deprivation. In the absence of REDD1, mTORC1 fails to be appropriately restrained during prolonged serum deprivation and Akt signaling is suppressed, leading to reduced cell survival. Thus, these findings identify REDD1 expression as a key regulatory checkpoint that coordinates growth signaling inputs to activate pro-survival mechanisms and reduce susceptibility to cell death.
Highlights.
Expression of the mTORC1 inhibitor REDD1 was induced by serum deprivation.
In the absence of REDD1, mTORC1 signaling recovered during serum deprivation.
REDD1 maintained mTORC1 repression and facilitated autophagy.
REDD1 induction promoted phosphorylation of Akt and cell survival.
Acknowledgments
This work was supported by NIH grants DK15658 and DK13499 (to LSJ), and EY023612 (to MDD). The authors thank Dr. Leif Ellisen (Massachusetts General Hospital Cancer Center) for kindly providing REDD1 wild type and knockout MEF, Drs. David Ron and Heather Harding (New York University School of Medicine) for providing ATF4 knockout MEF, Dr. Catherine Coleman (The Pennsylvania State University College of Medicine) for providing HEK 293 Tet-on HA-REDD1 cells, and Dr. Michael Kilberg (University of Florida) for providing anti-ATF4 antibody. The authors also thank Holly Lacko for assistance in performance of the studies described herein.
Abbreviations
- 4E-BP1
eukaryotic initiation factor 4E binding protein 1
- ATF4
activating transcription factor 4
- ca
constitutively active
- dn
dominant negative
- ERK
extracellular signal-related protein kinase
- FBS
fetal bovine serum
- GCN2
general control non-derepressing 2
- IGF1
insulin-like growth factor 1
- LC3
autophagy marker light chain 3
- mTORC1
mammalian target of rapamycin in complex 1
- p70S6K1
70-kDa ribosomal S6 kinase 1
- PERK
protein kinase RNA-like endoplasmic reticulum kinase
- REDD1
Regulated in DNA Damage and Development 1
- ULK1
UNC-51-like kinase 1
- XBP1
X-box binding protein 1
Footnotes
Publisher's Disclaimer: This is a PDF file of an unedited manuscript that has been accepted for publication. As a service to our customers we are providing this early version of the manuscript. The manuscript will undergo copyediting, typesetting, and review of the resulting proof before it is published in its final citable form. Please note that during the production process errors may be discovered which could affect the content, and all legal disclaimers that apply to the journal pertain.
References
- 1.Laplante M, Sabatini DM. mTOR Signaling. Cold Spring Harb Perspect Biol. 2012:4. doi: 10.1101/cshperspect.a011593. [DOI] [PMC free article] [PubMed] [Google Scholar]
- 2.Laplante M, Sabatini DM. mTOR signaling in growth control and disease. Cell. 2012;149:274–293. doi: 10.1016/j.cell.2012.03.017. [DOI] [PMC free article] [PubMed] [Google Scholar]
- 3.Sarbassov DD, Ali SM, Sengupta S, Sheen JH, Hsu PP, Bagley AF, Markhard AL, Sabatini DM. Prolonged rapamycin treatment inhibits mTORC2 assembly and Akt/PKB. Mol Cell. 2006;22:159–168. doi: 10.1016/j.molcel.2006.03.029. [DOI] [PubMed] [Google Scholar]
- 4.Fingar DC, Salama S, Tsou C, Harlow E, Blenis J. Mammalian cell size is controlled by mTOR and its downstream targets S6K1 and 4EBP1/eIF4E. Genes Dev. 2002;16:1472–1487. doi: 10.1101/gad.995802. [DOI] [PMC free article] [PubMed] [Google Scholar]
- 5.Dennis MD, Baum JI, Kimball SR, Jefferson LS. Mechanisms involved in the coordinate regulation of mTORC1 by insulin and amino acids. J Biol Chem. 2011;286:8287–8296. doi: 10.1074/jbc.M110.209171. [DOI] [PMC free article] [PubMed] [Google Scholar]
- 6.Sancak Y, Peterson TR, Shaul YD, Lindquist RA, Thoreen CC, Bar-Peled L, Sabatini DM. The Rag GTPases bind raptor and mediate amino acid signaling to mTORC1. Science. 2008;320:1496–1501. doi: 10.1126/science.1157535. [DOI] [PMC free article] [PubMed] [Google Scholar]
- 7.Long X, Lin Y, Ortiz-Vega S, Yonezawa K, Avruch J. Rheb binds and regulates the mTOR kinase. Curr Biol. 2005;15:702–713. doi: 10.1016/j.cub.2005.02.053. [DOI] [PubMed] [Google Scholar]
- 8.Brugarolas J, Lei K, Hurley RL, Manning BD, Reiling JH, Hafen E, Witters LA, Ellisen LW, Kaelin WG., Jr Regulation of mTOR function in response to hypoxia by REDD1 and the TSC1/TSC2 tumor suppressor complex. Genes Dev. 2004;18:2893–2904. doi: 10.1101/gad.1256804. [DOI] [PMC free article] [PubMed] [Google Scholar]
- 9.Shoshani T, Faerman A, Mett I, Zelin E, Tenne T, Gorodin S, Moshel Y, Elbaz S, Budanov A, Chajut A, Kalinski H, Kamer I, Rozen A, Mor O, Keshet E, Leshkowitz D, Einat P, Skaliter R, Feinstein E. Identification of a novel hypoxia-inducible factor 1-responsive gene, RTP801, involved in apoptosis. Mol Cell Biol. 2002;22:2283–2293. doi: 10.1128/MCB.22.7.2283-2293.2002. [DOI] [PMC free article] [PubMed] [Google Scholar]
- 10.Wang H, Kubica N, Ellisen LW, Jefferson LS, Kimball SR. Dexamethasone represses signaling through the mammalian target of rapamycin in muscle cells by enhancing expression of REDD1. J Biol Chem. 2006;281:39128–39134. doi: 10.1074/jbc.M610023200. [DOI] [PubMed] [Google Scholar]
- 11.McGhee NK, Jefferson LS, Kimball SR. Elevated corticosterone associated with food deprivation upregulates expression in rat skeletal muscle of the mTORC1 repressor, REDD1. J Nutr. 2009;139:828–834. doi: 10.3945/jn.108.099846. [DOI] [PMC free article] [PubMed] [Google Scholar]
- 12.Sofer A, Lei K, Johannessen CM, Ellisen LW. Regulation of mTOR and cell growth in response to energy stress by REDD1. Mol Cell Biol. 2005;25:5834–5845. doi: 10.1128/MCB.25.14.5834-5845.2005. [DOI] [PMC free article] [PubMed] [Google Scholar]
- 13.Li XH, Ha CT, Fu D, Xiao M. REDD1 protects osteoblast cells from gamma radiation-induced premature senescence. PLoS One. 2012;7:e36604. doi: 10.1371/journal.pone.0036604. [DOI] [PMC free article] [PubMed] [Google Scholar]
- 14.Drummond MJ, Fujita S, Abe T, Dreyer HC, Volpi E, Rasmussen BB. Human muscle gene expression following resistance exercise and blood flow restriction. Med Sci Sports Exerc. 2008;40:691–698. doi: 10.1249/MSS.0b013e318160ff84. [DOI] [PMC free article] [PubMed] [Google Scholar]
- 15.Kimball SR, Do AN, Kutzler L, Cavener DR, Jefferson LS. Rapid turnover of the mTOR complex 1 (mTORC1) repressor REDD1 and activation of mTORC1 signaling following inhibition of protein synthesis. J Biol Chem. 2008;283:3465–3475. doi: 10.1074/jbc.M706643200. [DOI] [PMC free article] [PubMed] [Google Scholar]
- 16.Dennis MD, Kimball SR, Jefferson LS. Mechanistic target of rapamycin in complex 1 (mTORC1)-mediated phosphorylation is governed by competition between substrates for interaction with raptor. J Biol Chem. 2012;288:10–19. doi: 10.1074/jbc.M112.402461. [DOI] [PMC free article] [PubMed] [Google Scholar]
- 17.Iwakoshi NN, Lee AH, Vallabhajosyula P, Otipoby KL, Rajewsky K, Glimcher LH. Plasma cell differentiation and the unfolded protein response intersect at the transcription factor XBP-1. Nat Immunol. 2003;4:321–329. doi: 10.1038/ni907. [DOI] [PubMed] [Google Scholar]
- 18.Smale ST. Nuclear run-on assay. Cold Spring Harb Protoc. 2009;2009 doi: 10.1101/pdb.prot5329. pdb prot5329. [DOI] [PubMed] [Google Scholar]
- 19.Corradetti MN, Inoki K, Guan KL. The stress-inducted proteins RTP801 and RTP801L are negative regulators of the mammalian target of rapamycin pathway. J Biol Chem. 2005;280:9769–9772. doi: 10.1074/jbc.C400557200. [DOI] [PubMed] [Google Scholar]
- 20.Whitney ML, Jefferson LS, Kimball SR. ATF4 is necessary and sufficient for ER stress-induced upregulation of REDD1 expression. Biochem Biophys Res Commun. 2009;379:451–455. doi: 10.1016/j.bbrc.2008.12.079. [DOI] [PMC free article] [PubMed] [Google Scholar]
- 21.Jin HO, Seo SK, Woo SH, Kim ES, Lee HC, Yoo DH, An S, Choe TB, Lee SJ, Hong SI, Rhee CH, Kim JI, Park IC. Activating transcription factor 4 and CCAAT/enhancer-binding protein-beta negatively regulate the mammalian target of rapamycin via Redd1 expression in response to oxidative and endoplasmic reticulum stress. Free Radic Biol Med. 2009;46:1158–1167. doi: 10.1016/j.freeradbiomed.2009.01.015. [DOI] [PubMed] [Google Scholar]
- 22.Voccoli V, Mazzoni F, Garcia-Gil M, Colombaioni L. Serum-withdrawal-dependent apoptosis of hippocampal neuroblasts involves Ca++ release by endoplasmic reticulum and caspase-12 activation. Brain Res. 2007;1147:1–11. doi: 10.1016/j.brainres.2007.01.145. [DOI] [PubMed] [Google Scholar]
- 23.Lithanatudom P, Leecharoenkiat A, Wannatung T, Svasti S, Fucharoen S, Smith DR. A mechanism of ineffective erythropoiesis in beta-thalassemia/Hb E disease. Haematologica. 2010;95:716–723. doi: 10.3324/haematol.2009.015701. [DOI] [PMC free article] [PubMed] [Google Scholar]
- 24.Michallet AS, Mondiere P, Taillardet M, Leverrier Y, Genestier L, Defrance T. Compromising the unfolded protein response induces autophagy-mediated cell death in multiple myeloma cells. PLoS One. 2011;6:e25820. doi: 10.1371/journal.pone.0025820. [DOI] [PMC free article] [PubMed] [Google Scholar]
- 25.Dey S, Baird TD, Zhou D, Palam LR, Spandau DF, Wek RC. Both transcriptional regulation and translational control of ATF4 are central to the integrated stress response. J Biol Chem. 2010;285:33165–33174. doi: 10.1074/jbc.M110.167213. [DOI] [PMC free article] [PubMed] [Google Scholar]
- 26.Scheuner D, Patel R, Wang F, Lee K, Kumar K, Wu J, Nilsson A, Karin M, Kaufman RJ. Double-stranded RNA-dependent protein kinase phosphorylation of the alpha-subunit of eukaryotic translation initiation factor 2 mediates apoptosis. J Biol Chem. 2006;281:21458–21468. doi: 10.1074/jbc.M603784200. [DOI] [PubMed] [Google Scholar]
- 27.Alers S, Loffler AS, Wesselborg S, Stork B. Role of AMPK-mTOR-Ulk1/2 in the regulation of autophagy: cross talk, shortcuts, and feedbacks. Mol Cell Biol. 2012;32:2–11. doi: 10.1128/MCB.06159-11. [DOI] [PMC free article] [PubMed] [Google Scholar]
- 28.Kabeya Y, Mizushima N, Ueno T, Yamamoto A, Kirisako T, Noda T, Kominami E, Ohsumi Y, Yoshimori T. LC3, a mammalian homologue of yeast Apg8p, is localized in autophagosome membranes after processing. Embo J. 2000;19:5720–5728. doi: 10.1093/emboj/19.21.5720. [DOI] [PMC free article] [PubMed] [Google Scholar]
- 29.Datta SR, Dudek H, Tao X, Masters S, Fu H, Gotoh Y, Greenberg ME. Akt phosphorylation of BAD couples survival signals to the cell-intrinsic death machinery. Cell. 1997;91:231–241. doi: 10.1016/s0092-8674(00)80405-5. [DOI] [PubMed] [Google Scholar]
- 30.Jin HO, Hong SE, Kim JH, Choi HN, Kim K, An S, Choe TB, Hwang CS, Lee JH, Kim JI, Kim HA, Kim EK, Noh WC, Hong YJ, Hong SI, Lee JK, Park IC. Sustained overexpression of Redd1 leads to Akt activation involved in cell survival. Cancer Lett. 2013;336:319–324. doi: 10.1016/j.canlet.2013.03.021. [DOI] [PubMed] [Google Scholar]
- 31.Manning BD, Cantley LC. AKT/PKB signaling: navigating downstream. Cell. 2007;129:1261–1274. doi: 10.1016/j.cell.2007.06.009. [DOI] [PMC free article] [PubMed] [Google Scholar]
- 32.Shang L, Chen S, Du F, Li S, Zhao L, Wang X. Nutrient starvation elicits an acute autophagic response mediated by Ulk1 dephosphorylation and its subsequent dissociation from AMPK. Proc Natl Acad Sci U S A. 2011;108:4788–4793. doi: 10.1073/pnas.1100844108. [DOI] [PMC free article] [PubMed] [Google Scholar]
- 33.Christie GR, Hajduch E, Hundal HS, Proud CG, Taylor PM. Intracellular sensing of amino acids in Xenopus laevis oocytes stimulates p70 S6 kinase in a target of rapamycin-dependent manner. J Biol Chem. 2002;277:9952–9957. doi: 10.1074/jbc.M107694200. [DOI] [PubMed] [Google Scholar]
- 34.Molitoris JK, McColl KS, Swerdlow S, Matsuyama M, Lam M, Finkel TH, Matsuyama S, Distelhorst CW. Glucocorticoid elevation of dexamethasone-induced gene 2 (Dig2/RTP801/REDD1) protein mediates autophagy in lymphocytes. J Biol Chem. 2011;286:30181–30189. doi: 10.1074/jbc.M111.245423. [DOI] [PMC free article] [PubMed] [Google Scholar]
- 35.Alessi DR, Andjelkovic M, Caudwell B, Cron P, Morrice N, Cohen P, Hemmings BA. Mechanism of activation of protein kinase B by insulin and IGF-1. Embo J. 1996;15:6541–6551. [PMC free article] [PubMed] [Google Scholar]
- 36.Sarbassov DD, Guertin DA, Ali SM, Sabatini DM. Phosphorylation and regulation of Akt/PKB by the rictor-mTOR complex. Science. 2005;307:1098–1101. doi: 10.1126/science.1106148. [DOI] [PubMed] [Google Scholar]
- 37.Hsu PP, Kang SA, Rameseder J, Zhang Y, Ottina KA, Lim D, Peterson TR, Choi Y, Gray NS, Yaffe MB, Marto JA, Sabatini DM. The mTOR-regulated phosphoproteome reveals a mechanism of mTORC1-mediated inhibition of growth factor signaling. Science. 2011;332:1317–1322. doi: 10.1126/science.1199498. [DOI] [PMC free article] [PubMed] [Google Scholar]
- 38.Yu Y, Yoon SO, Poulogiannis G, Yang Q, Ma XM, Villen J, Kubica N, Hoffman GR, Cantley LC, Gygi SP, Blenis J. Phosphoproteomic analysis identifies Grb10 as an mTORC1 substrate that negatively regulates insulin signaling. Science. 2011;332:1322–1326. doi: 10.1126/science.1199484. [DOI] [PMC free article] [PubMed] [Google Scholar]
- 39.O’Reilly KE, Rojo F, She QB, Solit D, Mills GB, Smith D, Lane H, Hofmann F, Hicklin DJ, Ludwig DL, Baselga J, Rosen N. mTOR inhibition induces upstream receptor tyrosine kinase signaling and activates Akt. Cancer Res. 2006;66:1500–1508. doi: 10.1158/0008-5472.CAN-05-2925. [DOI] [PMC free article] [PubMed] [Google Scholar]
- 40.Julien LA, Carriere A, Moreau J, Roux PP. mTORC1-activated S6K1 phosphorylates Rictor on threonine 1135 and regulates mTORC2 signaling. Mol Cell Biol. 2010;30:908–921. doi: 10.1128/MCB.00601-09. [DOI] [PMC free article] [PubMed] [Google Scholar]
- 41.Berlanga JJ, Santoyo J, De Haro C. Characterization of a mammalian homolog of the GCN2 eukaryotic initiation factor 2alpha kinase. Eur J Biochem. 1999;265:754–762. doi: 10.1046/j.1432-1327.1999.00780.x. [DOI] [PubMed] [Google Scholar]
- 42.Reiling JH, Hafen E. The hypoxia-induced paralogs Scylla and Charybdis inhibit growth by down-regulating S6K activity upstream of TSC in Drosophila. Genes Dev. 2004;18:2879–2892. doi: 10.1101/gad.322704. [DOI] [PMC free article] [PubMed] [Google Scholar]