

Abstract
Spinal muscular atrophy is a genetic disease which severity depends on the amount of SMN protein, the product of the genes SMN1 and SMN2. Symptomatology goes from severe neuromuscular impairment leading to early death in infants to slow progressing motor deficits during adulthood. Much of the knowledge about the pathophysiology of SMA comes from studies using genetically engineered animal models of the disease. Here we investigated one of the milder models, the homozygous A2G SMA mice, in which the level of the protein is restored to almost normal levels by the addition of a mutated transgene to the severe SMN-deficient background. We examined neuromuscular function and found that calcium-dependent neurotransmitter release was significantly decreased. In addition, the amplitude of spontaneous endplate potentials was decreased, the morphology of NMJ altered, and slight changes in short-term synaptic plasticity were found. In spite of these defects, excitation contraction coupling was well preserved, possibly due to the safety factor of this synapse. These data further support that the quasi-normal restoration of SMN levels in severe cases preserves neuromuscular function, even when neurotransmitter release is significantly decreased at motor nerve terminals. Nevertheless, this deficit could represent a greater risk of motor impairment during aging or after injuries.
Keywords: motor neuron, neurodegeneration, neuromuscular junction, spinal muscular atrophy, synapse
Introduction
SMN (survival motor neuron) is an essential and ubiquitous protein which best known functions are its participation in the assembly of small nuclear ribonucleoproteins and in mRNA splicing (Fischer et al. 1997; Liu et al. 1997; Meister et al. 2001; Pellizzoni et al. 2002). A deficiency in SMN expression produces spinal muscular atrophy (SMA), one of the most severe diseases of genetic origin in childhood (Crawford & Pardo, 1996). The disease manifests by deterioration in motor function due to the selective loss of subsets of α-motor neurons in the spinal cord and reduction in excitatory inputs onto motor neurons (Ling et al. 2010; Park et al. 2010; Mentis et al. 2011; Martinez et al. 2012). There are several clinic forms of SMA which classification is based on the age of onset and the severity of the symptoms (Munsat & Davies, 1992). In SMA type I, by far the most frequent form of SMA, the disease is diagnosed within 6 months of birth and is characterized by profound generalized muscular weakness that usually results in death before 2 years of age. In SMA type II, onset of the disease occurs between 6 and 18 months of age and infants are unable to walk. SMA type III and type IV are less severe and symptoms start after 18 months of age (type III), or during adulthood (type IV). Although patients of type III and IV are able to walk without aid, at least for a time, their motor function progressively deteriorates.
The different clinic forms of SMA are directly related to the amount of SMN expressed in patients (McAndrew et al. 1997; Feldkotter et al. 2002; Harada et al. 2002). SMN is coded by two genes, SMN1 and SMN2 (Lefebvre et al. 1995), and whereas SMN1 produces full length SMN (SMN-FL), SMN2 produces only 10% of SMN-FL and 90% of a truncated form of the protein (SMNΔ7) (McAndrew et al. 1997). As the number of copies of SMN2 varies in the population, the pathology in patients with deleted or mutated SMN1 will depend greatly on the number of SMN2 copies in each individual (Coovert et al. 1997; Lefebvre et al. 1997). SMA type I or type II patients have one or two copies of SMN2, whereas type III or type IV patients have three or more copies of SMN2.
The generation of animal models of SMA has contributed enormously to the understanding of the pathophysiology of the disease. For example, it has been demonstrated that the homozygous absence of Smn, the homologous SMN gene in animals, is embryonically lethal in mice (Schrank et al. 1997; Hsieh-Li et al. 2000). This early lethality can be prevented by transgenic expression of the human gene SMN2 (Hsieh-Li et al. 2000; Monani et al. 2000b). Remarkably, mice expressing one or two SMN2 copies have pathologic characteristics similar to those of SMA type I patients (Hsieh-Li et al. 2000; Monani et al. 2000b), whereas mice expressing four copies of SMN2 have a normal life span and present minor alterations such as peripheral necrosis in ears and tail. On the other hand, expression of 8–16 SMN2 copies in null-Smn mice results in almost a normal phenotype (Hsieh-Li et al. 2000; Monani et al. 2000b). Therefore, as in humans, in mice the disease severity is inversely correlated with the SMN dosage.
Several SMA type I mouse models have been generated so far. One of the most used is the so-called SMNΔ7 (Le et al. 2005). Against a severe background (Smn−/−, plus 1–2 copies of SMN2), these mice express an additional gene (SMN1 SMNΔ7) which produces only truncated SMN protein. As a result, there is a slight increase in maximal survival (from 5 to 6 days when SMN1 SMNΔ7 is not incorporated up to 2 weeks after the transgene is included). Importantly, this provides a wider time window for studying the pathological changes that low levels of SMN produces. For example, it has been demonstrated that postnatal maturation of the NMJ does not take place in most affected muscles (Kariya et al. 2008; Murray et al. 2008; Kong et al. 2009; Ruiz et al. 2010), as evidenced at the presynaptic side by the anomalous distribution and significant decrease in synaptic vesicles and active zones, reduction in mitochondria, immature organization of neurofilaments (NF) and microtubules (Torres-Benito et al. 2011), and up to a ∼ 50% reduction in neurotransmitter release (Kong et al. 2009; Ling et al. 2010; Ruiz et al. 2010; Torres-Benito et al. 2011, 2012). At the postsynaptic side, small and immature end-plates are observed (Kariya et al. 2008; Murray et al. 2008; Kong et al. 2009; Ruiz et al. 2010). In addition to the NMJ changes, loss of proprioceptive sensory synaptic inputs on motor neurons is also found (Ling et al. 2010; Mentis et al. 2011). Following these changes, neurodegenerative signs such as NF accumulation in motor nerve terminals, muscle fiber denervation, and loss of spinal motor neurons are found (Michaud et al.; Hsieh-Li et al. 2000; Jablonka et al. 2000; Monani et al. 2000a, 2003; Le et al. 2005; Avila et al. 2007; Kariya et al. 2008; Bowerman et al. 2009; Park et al. 2010; Riessland et al. 2010; Torres-Benito et al. 2011; Ling et al. 2012).
Much less is known about the pathophysiology of the milder forms of SMA. However, several mouse models that resemble SMA type III have already been generated and are starting to provide valuable information (Jablonka et al. 2000; Monani et al. 2003; Kariya et al. 2008; Gladman et al. 2010; Park et al. 2010; Simon et al. 2010; Osborne et al. 2012). One of these models results in the expression of the SMN1 A2G mutated transgene on the severe Smn−/−;SMN2 background (Monani et al. 2003). A2G is a common missense mutation in the SMN1 gene in SMA patients (Parsons et al. 1998). Remarkably, the hemizygous expression of the SMN1 A2G in mouse ameliorates the SMA phenotype (from type I towards type III), significantly improving motor function and extending mean survival from 5 to 225 days. Even so, these mice still suffer from motor neuron loss, muscle atrophy, axonal NF accumulation and immature NMJs (Monani et al. 2003). In the present study, we investigated a milder SMA model which expresses the A2G transgene in homozygosis on the severe Smn−/−;SMN2 background (Monani et al. 2003). We found that at 1 year of age, homozygous A2G SMA mice, although smaller, did not present alterations in the maturation of the NMJ nor NF accumulation but did have a significant reduction in neurotransmitter release at motor nerve terminals of the transversus abdominis (TVA) muscle. In addition, NMJ morphology appeared slightly altered. However, assessment of motor function by electromyography showed no apparent impairment of hind limbs. These results allow a better understanding of the alterations present in very mild SMA models in which motor performance is not apparently affected initially but in which reduction in the neuromuscular transmission safety factor could limit motor function in case of injury, disease or aging.
Methods
Animal model
The A2G mouse line was kindly provided by Dr. A. Burghes (Department of Molecular Genetics, College of Biological Sciences, The Ohio State University, Columbus, OH, USA). Double transgenic Smn+/−;SMN2+/+;SMN A2G+/+ mice on a FVB/N background were interbred. Genotyping was done by PCR using tail DNA as previously described (Monani et al. 2003). Control mice were Smn+/+;SMN2+/+;SMN A2G+/+. Smn-deficient mice were Smn−/−;SMN2+/+;SMN A2G+/+ (referred to henceforth as homozygous A2G SMA mice). Only male mice older 1 year or older were used for experiments and controls were age-matched littermates of homozygous A2G SMA mice. All experiments were performed according to the guidelines of the European Council Directive for the Care of Laboratory Animals.
Electromyography
Compound muscular action potentials (CMAPs) were recorded as described (Ruiz et al. 2005; Simon et al. 2010) in anesthetized mice (tribromoethanol 2%, 0.15 mL per 10 g body weight, i.p.). Stimulating needle electrodes were placed at the sciatic notch and the head of the fibula. The active recording electrode (a circumferential surface electrode) was placed at midthigh. The reference electrode was inserted at the base of the fifth foot phalanx. A ground electrode was placed at the base of the tail. Supramaximal responses were first recorded, followed by responses to incremental currents, in very small steps, from subthreshold levels until the progressive recruitment of 10–15 responses. Each incremental current pulse was applied three times, and responses were considered stable and therefore acceptable if they were identical. The mean single motor unit action potential (SMUAP) was calculated averaging the size increments of the first 10 responses.
Muscle preparation
Mice were anesthetized with tribromoethanol (2%, 0.15 mL per 10 g body weight, i.p.) and killed by exsanguination. The TVA muscles were dissected with their nerve branches intact and pinned to the bottom of a 2-mL chamber, over a bed of cured silicone rubber (Sylgard, Dow Corning). Preparations were continuously perfused with a solution of the following composition (in mm): 125 NaCl, 5 KCl, 2 CaCl2, 1 MgCl2, 25 NaHCO3 and 15 glucose. The solution was continuously gassed with 95% O2 and 5% CO2, which maintained the pH at 7.35. The muscles were used either for intracellular electrical recordings or were fixed for performing immunohistochemistry.
Intracellular electrical recording and analysis
The nerve was stimulated by means of a suction electrode. The stimulation consisted of square-wave pulses of 0.5 ms duration and 2–40 V amplitude, at variable frequencies (0.5–100 Hz). A glass microelectrode (10–20 MΩ) filled with 3 m KCl was connected to an intracellular recording amplifier (Neuro Data IR283; Cygnus Technology) and used to impale single muscle fibers near the motor nerve endings. Evoked endplate potentials (EPPs) and miniature EPPs (mEPPs) were recorded from different NMJs within the muscle as described previously (Ruiz et al. 2010). Muscular contraction was prevented by including in the bath 3–4 μM μ-conotoxin GIIIB (Alomone Laboratories), a specific blocker of muscular voltage gated sodium channels. Recording was performed at room temperature (22–23 °C). The mean amplitudes of the EPP and mEPPs recorded at each NMJ were linearly normalized to −70 mV resting membrane potential. EPP amplitudes were corrected for nonlinear summation (Martin, 1955). The kinetics of EPP and mEPP were characterized by their rise time (10–90%) and decay time constant (calculated from the exponential fit of the decay phase). Quantal content (QC) was estimated by the direct method, which consists of recording mEPPs and EPPs (nerve stimulation 0.5 Hz) simultaneously and then calculating the ratio: QC = average peak EPP/average peak mEPP.
Immunohistochemistry
Dissected TVA muscles from control and A2G SMA mice were fixed with 4% paraformaldehyde (PFA) for 2 h. Muscles were bathed with 0.1 m glycine in phosphate-bufferd saline (PBS) for 20 min, then permeabilized with 1% (v/v) Triton X-100 in PBS for 30 min, and incubated then in a blocking solution containing 5% (w/v) bovine serum albumin (BSA), 1% Triton X-100 in PBS for 2 h. Samples were incubated overnight at 4 °C with a mouse primary antibody against 160 kDa neurofilament (NF; 1 : 750, Millipore). Next day, muscles were rinsed for 1 h in PBS containing 1% Triton X-100, incubated for 1 h both with 4 μg mL–1 Alexa 488-conjugated goat anti-mouse secondary antibody (Invitrogen) and 10 ng mL–1 rhodamine-bungarotoxin (Sigma), and rinsed again with PBS for 90 min. Finally, muscles were mounted in glycerol containing DABCO and imaged with an upright Olympus FV1000 confocal microscope. Z-stack projections were made from serial scanning every 0.5 μm to reconstruct the NMJ.
Statistics
Results are reported as means ± SEM, with n being the number of muscle fibers per group and N the number of mice per group. Student's t-test was performed as unpaired, two-tailed sets when the distribution was normal and the Mann–Whitney rank sum test was used when the distribution was not normal. Results were considered statistically different when P < 0.05.
Results
Homozygous expression of SMN1 A2G on the SMA severe mouse background extended survival for more than 1 year, as previously described (Monani et al. 2003). Body weight was, however, reduced (∼ 20%) in comparison with their control littermates (Fig. 1A) and mice presented shorter tails. No other external alterations, such as ear or tail necrosis (Hsieh-Li et al. 2000; Osborne et al. 2012), were apparent.
Fig. 1.
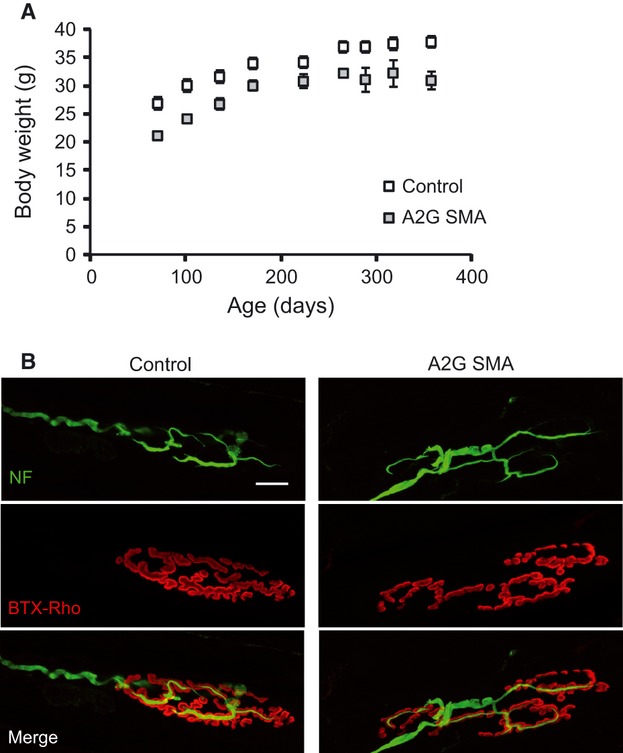
Body weight and NMJ in homozygous A2G SMA mice. (A) Body weight in control (open symbols) and homozygous A2G SMA (closed symbols) mice. (B) Representative NMJ confocal images from control and homozygous A2G SMA mice. Neurofilaments have been labeled by specific antibodies (green) and AChR have been labeled with BTX-Rho (red). Scale bar: 15 μm.
As motor performance was also normal and no signs of limb muscle wasting or strength loss were observed in homozygous A2G SMA mice (data not shown), we explored the morphological characteristics of the NMJ in TVA, one of the most affected muscles in the severe SMA mouse model SMNΔ7 (Murray et al. 2008; Ruiz et al. 2010; Torres-Benito et al. 2011). In the severe model, important defects in postnatal maturation of the pre- and postsynaptic motor terminals, together with axonal and terminal NF accumulation and denervation have been reported. In addition, in 8-month-old hemizygous A2G SMA mice poor maturation of end-plates has been also described at the oblique abdominal muscle (Kariya et al. 2008).
We stained postsynaptic receptors with bungarotoxin-rhodamine, and axons and intraterminal axonal branches with an antibody anti-NF, revealed by an Alexa488 secondary antibody. Figure 1B shows representative examples of NMJs from a 1-year-old control (left panel) and a littermate homozygous A2G SMA mouse. Contrary to what it was found in most severe mouse models, NMJs from homozygous SMA mice typically presented mature characteristics [i.e. acetylcholine receptors (AChRs) grouped in bands, and perforated end-plates], and no signs of denervation. However, ∼ 84% of NMJs showed a fragmented appearance and separated preterminal axonal branches (Fig. 1B, right), contrary to the pretzel-like form found in ∼ 63% of control littermates (Fig. 1B, left). In contrast, no difference in NF accumulation was observed between homozygous A2G SMA and control mice.
Synaptic transmission reduction in motor nerve terminals
To investigate whether synaptic transmission was affected in motor nerve terminals from the TVA in homozygous A2G SMA mice, we studied the properties of miniature (mEPP) and evoked (EPP) end-plate potentials in 1-year-old mice and compared them with those of their control littermates.
Smaller miniature end-plate potentials in A2G SMA mice
Spontaneous neurotransmitter release was investigated by recording the miniature end-plate potentials (mEPPs). In A2G SMA mice, the mEPPs were smaller than in controls, as can be observed directly from the recording traces (Fig. 2A) and from their different mEPP size distributions (Fig. 2B). This was further confirmed in the cumulative frequency distribution plot, which showed a significant shift to the left of the mutant curve with respect to that of controls (Fig. 2C), with median values of 0.39 mV in mutants and 0.57 mV in controls (P < 0.001; Mann–Whitney test). The origin of this difference was not clear but among the possible explanations are a decrease in the amount of neurotransmitter content (quantal size), a decrease in the number of postsynaptic acetylcholine receptors, and a decrease in the sensitivity of the postsynaptic receptors.
Fig. 2.

Spontaneous end-plate potentials in homozygous A2G SMA mice. (A) Representative recordings from the TVA muscle in control (black traces) and in homozygous A2G SMA mice (gray traces). (B) Frequency histograms of mEPP sizes in representative examples in both genotypes. (C) Cumulative mEPP size curves in both genotypes. (D) Frequency of mEPP occurrence. The numbers between parentheses are the number of fibers and the number of mice studied, respectively.
On the other hand, when the mean frequency of spontaneous neurotransmitter release per fiber was compared, no statistical difference between controls (1.11 ± 0.19 events/s; n = 18, N = 3) and A2G SMA mice (0.97 ± 0.21 events/s; n = 18,, N = 3; P = 0.56) was found (Fig. 2D).
Decrease in calcium-dependent neurotransmission in A2G SMA mice
Next, we investigated the postsynaptic electrical response (end-plate potential, EPP) following presynaptic single action potential elicited by the electrical stimulation of the nerve (Fig. 3A). The mean size of the EPP in each fiber was obtained from recordings lasting 180–200 s during which the nerve was stimulated repetitively at 0.5 Hz. In A2G SMA mice, the mean amplitude of the EPP was significantly less (P = 0.004; two tailed t-test) than in controls (23.28 mV ± 0.39; n = 18, N = 3, vs. 46.70 mV ± 0.48; n = 18, N = 3, respectively; Fig. 3B). We also compared quantal content (the amount of synaptic vesicles that fuse with the plasma membrane in response to an action potential) and found that it was reduced ∼ 21% in A2G SMA mice (P = 0.03) in comparison with controls (54.16 ± 4.58; n = 18, N = 3, vs. 68.89 ± 6.21; n = 18, N = 3, respectively; Fig. 3C).
Fig. 3.

Decreased calcium-dependent neurotransmitter release in motor nerve terminals of homozygous A2G SMA mice. (A) EPP traces from control (black trace) and homozygous A2G SMA TVA muscles (gray trace). Recordings were normalized to the same peak amplitude for comparison. Rising (left graph) and decay (right graph) times of evoked EPPs in control and homozygous A2G mice. (B,C) Mean EPP size (B) and quantal content (C) in control and homozygous A2G mice. *P < 0.05; ** P < 0.005.
The analysis of the kinetics of the EPP, quantified by measuring the rise time between the 10 and 90% of the rising phase, and the decay time constant of the falling phase, showed an small, but significant, slower rising phase in A2G SMA mice than in controls (1.09 ms ± 0.05; n = 18, N = 3, vs. 0.96 ms ± 0.05; n = 18, N = 3, respectively (P = 0.02; Fig. 3A, left graph), suggesting a slight impairment between pre- and postsynaptic coupling. No significant difference was found in the decay time constant (A2G SMA: 2.88 ms ± 0.24; n = 18, N = 3; controls: 2.58 ms ± 0.18; n = 18, N = 3; P = 0.22; Fig. 3A, right graph).
Small alterations in short-term plasticity
To explore the ability of A2G SMA motor terminals to change their synaptic strength, trains of repetitive stimuli of different frequencies and durations were applied to the nerve and the amplitude of the EPP measured in control and A2G SMA fibers. Figure 4A shows representative examples of postsynaptic responses and appears to illustrate no large differences between genotypes. This was confirmed by statistical analysis in a number of terminals as shown in the graph in Fig. 4B, representing the mean size of the EPPs along the train at 50 Hz in control and A2G SMA mice fibers, normalized to the size of the first response. At this frequency, the degree of facilitation and depression along the train was not different between genotypes.
Fig. 4.
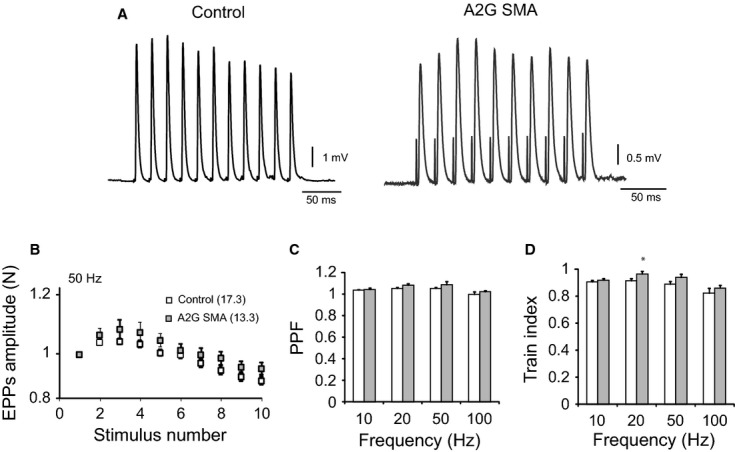
Short-term plasticity in homozygous A2G SMA mice. (A) Representative EPP recordings from the TVA muscle in control (black trace) and in homozygous A2G SMA mice (gray trace) during a train of stimuli at 50 Hz. (B) For each fiber, we constructed the mean curve observed for three sequential stimulus trains normalized to the first EPP, separated by 20-s intervals. (C) PPF quantification (EPP2/EPP1) at different frequencies (10–100 Hz) in control (white bars) and in homozygous A2G SMA mice (gray bars). (D) Normalized depression measured as train index, [(EPP9 + EPP10)/2]/EPP1, at different frequencies (10–100 Hz) in control (white bars) and in homozygous A2G SMA mice (gray bars) terminals. * P < 0.05.
We also measured the paired-pulse facilitation (EPP2/EPP1), which gives an indication of the initial vesicular release probability. No differences between controls and A2G SMA mice were found with 1-s stimulations at different frequencies (10–100 Hz; Fig. 4C). Finally, when the train index was calculated (see figure legend), which is an indication of the amount of short-term depression, a trend toward less depression in mutant in comparison with control terminals was observed, although this only reached statistical significance at 20 Hz (0.97 ± 0.02; n = 18, N = 3, vs. 0.91 ± 0.02; n = 23, N = 3; P = 0.04; Fig. 4D). These results show that short-term plasticity in A2G SMA mouse terminals was, in general, well preserved in spite of the decrease in quantal content.
No failures
In contrast to frequent failures in neurotransmission reported in 9-month-old hemizygous A2G SMA mice (Kariya et al. 2008), we found no signs of failures in 1-year-old homozygous mice at any of the stimulation frequencies explored (0.5–100 Hz; data not shown).
Electromyography
Although no signs of limb muscle weakness were apparent in homozygous A2G SMA mice, EMG recordings were performed to test whether a reduction in compound muscular action potential (CMAP) amplitude or alteration in the size of the motor units was detectable, as occurs in SMA patients (Swoboda et al. 2005) and in other mild SMA mouse models (Kariya et al. 2008; Simon et al. 2010).
Recordings were done by means of a surface ring electrode placed at the middle of the thigh in 1-year-old male mice homozygous for A2G and wild-type littermates. Maximum compound muscle action potential (CMAP) and motor unit (MU) recruitment were recorded after sciatic nerve stimulation.
As previously reported (Monani et al. 2003), no spontaneous activity (fibrillation or fasciculation potentials) in resting muscles was observed in homozygous A2G SMA mice (n = 5), suggesting no denervation or anomalous nerve excitability.
Recording of the maximal CMAP after supramaximal nerve stimulation in both mouse groups showed no significant differences in CMAP first peak amplitude between control and A2G SMA mice (37.8 ± 11.6 mV; n = 3; vs. 45.7 ± 3.4 mV; n = 5; respectively, P = 0.58), suggesting no differences in the number of functional motor units between genotypes (Fig. 5A).
Fig. 5.
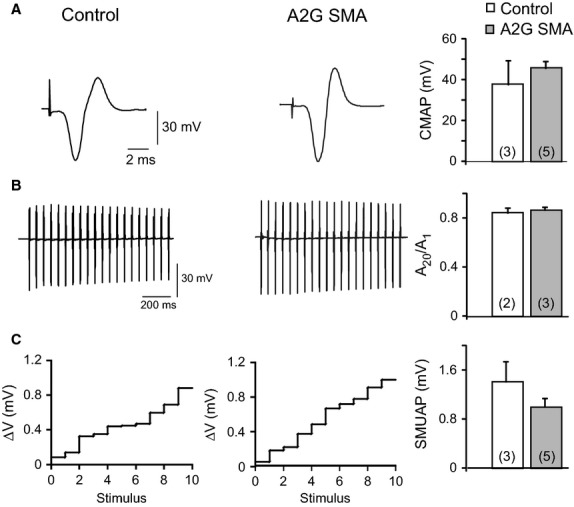
EMG characteristics of hind limb muscles in homozygous A2G SMA mice. (A) Representative recording of CMAP in both genotypes. Graph represents the quantification of the absolute first peak amplitude of CMAP in response to a supramaximal stimulation in control (white bars) and in homozygous A2G SMA mice (gray bars) terminals. (B) Representative recordings during a train of stimuli at 100 Hz in control (left trace) and in homozygous A2G SMA mice (right trace). The bar graph shows the depression of CMAP amplitudes (A20/A1) in both genotypes. (C) Amplitudes of SMUAPs in control and homozygous A2G mice in response to stimuli of increasing amplitude. Each number in the x-axis represents a stimulus that elicited an increment in the amplitude of the response. SMUAP mean size is showed in the graph in both studied groups. The numbers between parentheses are the number of fibers and the number of mice studied, respectively.
To test whether mutant muscles were more predisposed to fatigue, the nerve was supramaximally stimulated at 20 Hz for 1 s while the successive CMAP were recorded (Fig. 5B). The amount of fatigue was calculated as the percent of decrease in the CMAP peak amplitude at the end of the stimulation train relative to the first response. In control mice the signal depression was 17 ± 2% (N = 3) and in homozygous A2G SMA mice it was 16 ± 4% (N = 2); a non-statistical difference (P = 0.67).
Finally, to estimate the average single motor unit action potential (SMUAP) we applied 10 ‘successful’ successive stimuli of increasing strength and recorded the increment in the responses which represent the successive recruitment of single motor units. Examples of the sizes of the increments are shown in Fig. 5C, in control and A2G SMA mice. In neither of the genotypes were large steps observed, which is an indication that no giant motor units were recruited. Moreover, quantification of the average SMUAP amplitude in control and A2G SMA mice showed no statistical differences (1.4 ± 0.33 mV; N = 3 vs. 1 ± 0.14 mV; N = 5, respectively; P = 0.34), further supporting that there was no axonal sprouting, similar to what it has been reported in another mild SMA model (Gladman et al. 2010; but see Monani et al. 2003). Therefore, these data demonstrate that the average size of measured motor units was not different between genotypes and support that no significant loss of motor units occurs in A2G SMA mice.
Discussion
SMA is not only a neurodegenerative disease in children and adults but also a neurodevelopment disease when SMN levels are low before birth. At early stages of development, SMN is implicated in the control of neurite length, in the correct development of axonal growth cone, in motor axon guidance, and in the maturation and maintenance of synaptic contacts in motor circuits. Most of this information has been obtained from in vivo and in vitro SMA models in which SMN is much decreased. However, less is known about the pathological changes in mild animal models of the disease in which SMN is not greatly reduced. The aim of this work has been to investigate possible alterations in a very mild SMA mouse model, the homozygous A2G SMA mouse (Monani et al. 2003), with the aim of better understanding which properties are preserved and which are not in the milder forms of the disease.
In mouse models of slowly progressing motor neuron diseases, loss of motor neurons is partially compensated by axonal sprouting and reinnervation, a process in which CNTF (ciliary neurotrophic factor) participates (Simon et al. 2010; Selvaraj et al. 2012). This remodeling gives rise to anomalously large motor units that, in many instances, can be shown by electromyography (EMG). In addition, other anomalous features in motor neuron diseases, such as spontaneous activity and alterations in the normal size of CMAPs, are good indications of the degree of affectation and of the compensation capability of the system. For example, in contrast to hemizygous A2G SMA mice and to heterozygous (Smn+/−) mice, which present abnormal EMG activity (Monani et al. 2003; Simon et al. 2010), homozygous A2G SMA mice exhibited an apparent absence of EMG abnormalities in hind limb muscles. This result is not unexpected given the higher SMN expression level in A2G SMA mice in comparison with other type III SMA mouse models (Monani et al. 2003). The absence of spontaneous muscle electrical activity at rest in homozygous A2G SMA mice suggests that end-plates were not denervated and that motor axons were not anomalously excited. In patients, no spontaneous activity in the EMG has been reported in very mild type III SMA forms of the disease (Hausmanowa-Petrusewicz & Jozwik, 1986). In the same way, the size of the CMAP was not different between control and homozygous A2G SMA mice, which is indicative of either no alteration or the presence of compensatory large motor units resulting from sprouting and reinnervation, as occurs in Smn+/− mice (Simon et al. 2010). We favor the first possibility, as the mean size of motor units was not different between control and A2G SMA mice, contrary to what has been found in Smn+/− mice (Simon et al. 2010) and in other mouse models of motor neuron diseases, such in that of spinal muscular atrophy with respiratory distress type I (Ruiz et al. 2005) or in a model of ALS (Hegedus et al. 2009). Nevertheless, the presence of high threshold anomalously large motor units in this SMA model cannot be completely excluded, as the technique used for this estimation is based on the recruitment of 10–12 motor units with the lower thresholds. In fact, in a mouse model of ALS it has been shown that fast-twitch and fast-fatigable (FF) motor neurons, which usually have a higher threshold for activation, are lost first, followed by fast-twitch and fatigue-resistant (FR) motor neurons, whereas slow-twitch (S) are less affected (Pun et al. 2006). For the most severe form of SMA, a similar susceptibility may also exist (Kanning et al. 2010). In severe SMA mouse models it has been shown that large motor neurons, which usually have a high threshold for activation and belong to motor units of the FF type (Hashizume et al. 1988), are more vulnerable than smaller ones (Baumer et al. 2009). Accordingly, in severe SMA patients, type II muscle fibers, which normally are innervated by fast motor neurons, are atrophic, whereas slow type I muscle fibers are better preserved and even hypertrophic (Dubowitz, 1978). However, this sole hypothesis is not sufficient to explain why in severe SMA mouse models, muscles with predominant oxidative slow-twitch fibers, such as the TVA, are more affected than glycolytic fast-twitch muscles, such the LAL (Murray et al. 2008; Ruiz et al. 2010). Other proposed factors for motor neuron vulnerability have been the location of motor neurons at the spinal cord, the synapsing phenotype or the metabolic demand (Monani et al. 2000b; Kariya et al. 2008; Murray et al. 2008; Baumer et al. 2009; Ruiz et al. 2010; Ling et al. 2012). Finally, it is of interest to note that in SMA and ALS patients, extraocular muscles are very well preserved during the course of the disease (Kubota et al. 2000; Mitsumoto et al. 2006). Although these muscles have fast-twitch muscle fibers, they also have extremely small motor units. However, it is not clear whether this is indeed a protective factor.
In homozygous A2G SMA mice, the absence of pathological electromyography signs in hind limb muscles contrasts with the alterations in neuromuscular transmission observed in the TVA, namely smaller mEPPs and ∼ 21% reduction in the number of vesicles fused with the plasma membrane per action potential (quantal content). The reduction in mEPP size was unexpected considering the smaller size of homozygous mice in comparison with control littermates. Smaller muscle fibers normally have a higher input resistance, which implies a larger voltage change for the same amount of current flow. Nevertheless, our results are in accordance with a previously reported reduction in miniature postsynaptic currents in a severe SMA model (Martinez et al. 2012). Among the reasons that could explain this reduction are a decrease in synaptic vesicle ACh content, a reduction in the density of ACh postsynaptic receptors, or a combination of both. On the other hand, the reduction in quantal content in SMA mouse models is a constant in most muscles in different SMA mouse models (Torres-Benito et al. 2011; Ling et al. 2012). In the TVA, it is around 50% at 2 weeks of age in the SMNΔ7 model (Ruiz et al. 2010; Torres-Benito et al. 2011) but reduced only 21% in 1-year homozygous mice (Fig. 3C). Given the high safety factor in neuromuscular transmission, this deficit probably does not compromise function. Furthermore, repetitive stimulation of the nerve terminals did not result in larger synaptic depression than in control littermates. The lack of alteration in short-term synaptic plasticity, in spite of the decrease in quantum content, is not surprising given the capability of the neuromuscular system to adapt to chronic changes (Ferraiuolo et al. 2009). Also, at the observational level, no postural abnormalities or respiratory distress was observed in mutant mice as would be expected if the TVA function were deficient. It cannot be discarded, however, that some functional deficit could appear at mice older than 1 year, when age-related motor neuron loss occurs.
Paradoxically, in hemizygous A2G SMA mice at 8–9-month-old mice, an increase in quantal content was detected in the semitendinosus muscle in relation to littermate controls, in addition to frequent neurotransmission failures in a percentage of fibers (Kariya et al. 2008). These changes were accompanied by immature end-plates and NF accumulation in axonal motor branches of the gastrocnemius muscle (Kariya et al. 2008). We did not observe these alterations in the TVA muscle of the homozygous mice, probably because the homozygous model is a form of the disease that is even milder than the heterozygous Smn+/− (Jablonka et al. 2000; Simon et al. 2010). In accordance with the apparent lack of muscle weakness, our morphological and functional results showed no signs of denervation, contrary to what it is found in other mouse SMA models that present different degrees of impairment, from large neuromuscular denervation in severe SMNΔ7 mice (Ling et al. 2012) to reduced remodeling potential of NMJs in Smn2B/− mice, apparently in relation to the loss of terminal Schwann cells (Murray et al. 2012). On the other hand, we did not find any signs of sprouting and reinnervation, contrary to what it has been reported in SMA intermediate/mild models such as hemizygous A2G (Monani et al. 2003;) and in Smn+/− mice (Simon et al. 2010).
The ability of SMN1 A2G to rescue the SMA phenotype is of great interest. It has been shown previously that A2G does not efficiently self-associate, but it can form complexes when some amount of SMN (full-length) exists (Monani et al. 2003). Therefore, it is critical that SMN reaches a certain minimal threshold, as the requirement for this is higher during the embryonic and early postnatal period than in the adulthood, as demonstrated in the different therapeutic assays in SMA animal models (Lorson et al. 2010; Sendtner, 2010; Hua et al. 2011; Porensky et al. 2012). If the SMN level is below its critical threshold at birth and is not rapidly restored, the postnatal maturation of motor nerve terminals stops (Kariya et al. 2008; Torres-Benito et al. 2011). Besides this effect, neurodegeneration changes at the NMJ and other synapses takes place. Furthermore, when the SMN level is well below its normal threshold, the degenerative changes are so fast that there is no time for compensatory mechanisms such as sprouting and reinnervation. The correlation, if any, between synapse maturation defects and neurodegeneration is not clear as yet. It is evident that alteration of the NMJ can exist in apparently mature terminals, as in the SMA model in the present study. However, it could be also that an inappropriate maturation process of the NMJ could accelerate the neurodegeneration process.
In summary, we found that homozygous A2G SMA mice, in spite of having no apparent motor functional deficits and having mature NMJs, present a significant reduction in neurotransmitter release and morphological NMJ alterations (fragmentation). However, evaluation of neuromuscular coupling by electromyography showed no alterations in hind limb muscles. These results suggest that although in mild cases of SMA, motor symptoms could be initially absent or very mild, the safety factor at the NMJ is decreased by the reduction in neurotransmitter release. Therefore, complementary strategies for avoiding age-related or disease-related impairment of motor function might be required in patients with the milder form of the disease. For example, in future studies it might be of interest to test whether caloric restriction or programmed exercise could prevent NMJ alterations.
Acknowledgments
The authors thank A. Burghes for the generous gift of this mouse model. The financial support of the following research grants is gratefully acknowledged: Spanish Ministry of Science and Innovation BFU2010-21648, and Junta de Andalucía P09-CVI-4862.
References
- Avila AM, Burnett BG, Taye AA, et al. Trichostatin A increases SMN expression and survival in a mouse model of spinal muscular atrophy. J Clin Invest. 2007;117:659–671. doi: 10.1172/JCI29562. [DOI] [PMC free article] [PubMed] [Google Scholar]
- Baumer D, Lee S, Nicholson G, et al. Alternative splicing events are a late feature of pathology in a mouse model of spinal muscular atrophy. PLoS Genet. 2009;5:e1000773. doi: 10.1371/journal.pgen.1000773. [DOI] [PMC free article] [PubMed] [Google Scholar]
- Bowerman M, Anderson CL, Beauvais A, et al. SMN, profilin IIa and plastin 3: a link between the deregulation of actin dynamics and SMA pathogenesis. Mol Cell Neurosci. 2009;42:66–74. doi: 10.1016/j.mcn.2009.05.009. [DOI] [PubMed] [Google Scholar]
- Coovert DD, Le TT, McAndrew PE, et al. The survival motor neuron protein in spinal muscular atrophy. Hum Mol Genet. 1997;6:1205–1214. doi: 10.1093/hmg/6.8.1205. [DOI] [PubMed] [Google Scholar]
- Crawford TO, Pardo CA. The neurobiology of childhood spinal muscular atrophy. Neurobiol Dis. 1996;3:97–110. doi: 10.1006/nbdi.1996.0010. [DOI] [PubMed] [Google Scholar]
- Dubowitz V. Muscle disorders in childhood. Major Probl Clin Pediatr. 1978;16:1–282. iii-xiii. [PubMed] [Google Scholar]
- Feldkotter M, Schwarzer V, Wirth R, et al. Quantitative analyses of SMN1 and SMN2 based on real-time lightCycler PCR: fast and highly reliable carrier testing and prediction of severity of spinal muscular atrophy. Am J Hum Genet. 2002;70:358–368. doi: 10.1086/338627. [DOI] [PMC free article] [PubMed] [Google Scholar]
- Ferraiuolo L, De Bono JP, Heath PR, et al. Transcriptional response of the neuromuscular system to exercise training and potential implications for ALS. J Neurochem. 2009;109:1714–1724. doi: 10.1111/j.1471-4159.2009.06080.x. [DOI] [PubMed] [Google Scholar]
- Fischer U, Liu Q, Dreyfuss G. The SMN-SIP1 complex has an essential role in spliceosomal snRNP biogenesis. Cell. 1997;90:1023–1029. doi: 10.1016/s0092-8674(00)80368-2. [DOI] [PubMed] [Google Scholar]
- Gladman JT, Bebee TW, Edwards C, et al. A humanized Smn gene containing the SMN2 nucleotide alteration in exon 7 mimics SMN2 splicing and the SMA disease phenotype. Hum Mol Genet. 2010;19:4239–4252. doi: 10.1093/hmg/ddq343. [DOI] [PMC free article] [PubMed] [Google Scholar]
- Harada Y, Sutomo R, Sadewa AH, et al. Correlation between SMN2 copy number and clinical phenotype of spinal muscular atrophy: three SMN2 copies fail to rescue some patients from the disease severity. J Neurol. 2002;249:1211–1219. doi: 10.1007/s00415-002-0811-4. [DOI] [PubMed] [Google Scholar]
- Hashizume K, Kanda K, Burke RE. Medial gastrocnemius motor nucleus in the rat: age-related changes in the number and size of motoneurons. J Comp Neurol. 1988;269:425–430. doi: 10.1002/cne.902690309. [DOI] [PubMed] [Google Scholar]
- Hausmanowa-Petrusewicz I, Jozwik A. The application of the nearest neighbor decision rule in the evaluation of electromyogram in spinal muscular atrophy (SMA) of childhood. Electromyogr Clin Neurophysiol. 1986;26:689–703. [PubMed] [Google Scholar]
- Hegedus J, Putman CT, Gordon T. Progressive motor unit loss in the G93A mouse model of amyotrophic lateral sclerosis is unaffected by gender. Muscle Nerve. 2009;39:318–327. doi: 10.1002/mus.21160. [DOI] [PubMed] [Google Scholar]
- Hsieh-Li HM, Chang JG, Jong YJ, et al. A mouse model for spinal muscular atrophy. Nat Genet. 2000;24:66–70. doi: 10.1038/71709. [DOI] [PubMed] [Google Scholar]
- Hua Y, Sahashi K, Rigo F, et al. Peripheral SMN restoration is essential for long-term rescue of a severe spinal muscular atrophy mouse model. Nature. 2011;478:123–126. doi: 10.1038/nature10485. [DOI] [PMC free article] [PubMed] [Google Scholar]
- Jablonka S, Schrank B, Kralewski M, et al. Reduced survival motor neuron (Smn) gene dose in mice leads to motor neuron degeneration: an animal model for spinal muscular atrophy type III. Hum Mol Genet. 2000;9:341–346. doi: 10.1093/hmg/9.3.341. [DOI] [PubMed] [Google Scholar]
- Kanning KC, Kaplan A, Henderson CE. Motor neuron diversity in development and disease. Annu Rev Neurosci. 2010;33:409–440. doi: 10.1146/annurev.neuro.051508.135722. [DOI] [PubMed] [Google Scholar]
- Kariya S, Park GH, Maeno-Hikichi Y, et al. Reduced SMN protein impairs maturation of the neuromuscular junctions in mouse models of spinal muscular atrophy. Hum Mol Genet. 2008;17:2552–2569. doi: 10.1093/hmg/ddn156. [DOI] [PMC free article] [PubMed] [Google Scholar]
- Kong L, Wang X, Choe DW, et al. Impaired synaptic vesicle release and immaturity of neuromuscular junctions in spinal muscular atrophy mice. J Neurosci. 2009;29:842–851. doi: 10.1523/JNEUROSCI.4434-08.2009. [DOI] [PMC free article] [PubMed] [Google Scholar]
- Kubota M, Sakakihara Y, Uchiyama Y, et al. New ocular movement detector system as a communication tool in ventilator-assisted Werdnig-Hoffmann disease. Dev Med Child Neurol. 2000;42:61–64. doi: 10.1017/s0012162200000116. [DOI] [PubMed] [Google Scholar]
- Le TT, Pham LT, Butchbach ME, et al. SMNDelta7, the major product of the centromeric survival motor neuron (SMN2) gene, extends survival in mice with spinal muscular atrophy and associates with full-length SMN. Hum Mol Genet. 2005;14:845–857. doi: 10.1093/hmg/ddi078. [DOI] [PubMed] [Google Scholar]
- Lefebvre S, Burglen L, Reboullet S, et al. Identification and characterization of a spinal muscular atrophy-determining gene. Cell. 1995;80:155–165. doi: 10.1016/0092-8674(95)90460-3. [DOI] [PubMed] [Google Scholar]
- Lefebvre S, Burlet P, Liu Q, et al. Correlation between severity and SMN protein level in spinal muscular atrophy. Nat Genet. 1997;16:265–269. doi: 10.1038/ng0797-265. [DOI] [PubMed] [Google Scholar]
- Ling KK, Lin MY, Zingg B, et al. Synaptic defects in the spinal and neuromuscular circuitry in a mouse model of spinal muscular atrophy. PLoS ONE. 2010;5:e15457. doi: 10.1371/journal.pone.0015457. [DOI] [PMC free article] [PubMed] [Google Scholar]
- Ling KK, Gibbs RM, Feng Z, et al. Severe neuromuscular denervation of clinically relevant muscles in a mouse model of spinal muscular atrophy. Hum Mol Genet. 2012;21:185–195. doi: 10.1093/hmg/ddr453. [DOI] [PMC free article] [PubMed] [Google Scholar]
- Liu Q, Fischer U, Wang F, et al. The spinal muscular atrophy disease gene product, SMN, and its associated protein SIP1 are in a complex with spliceosomal snRNP proteins. Cell. 1997;90:1013–1021. doi: 10.1016/s0092-8674(00)80367-0. [DOI] [PubMed] [Google Scholar]
- Lorson CL, Rindt H, Shababi M. Spinal muscular atrophy: mechanisms and therapeutic strategies. Hum Mol Genet. 2010;19:R111–118. doi: 10.1093/hmg/ddq147. [DOI] [PMC free article] [PubMed] [Google Scholar]
- Martin AR. A further study of the statistical composition on the end-plate potential. J Physiol. 1955;130:114–122. doi: 10.1113/jphysiol.1955.sp005397. [DOI] [PMC free article] [PubMed] [Google Scholar]
- Martinez TL, Kong L, Wang X, et al. Survival motor neuron protein in motor neurons determines synaptic integrity in spinal muscular atrophy. J Neurosci. 2012;32:8703–8715. doi: 10.1523/JNEUROSCI.0204-12.2012. [DOI] [PMC free article] [PubMed] [Google Scholar]
- McAndrew PE, Parsons DW, Simard LR, et al. Identification of proximal spinal muscular atrophy carriers and patients by analysis of SMNT and SMNC gene copy number. Am J Hum Genet. 1997;60:1411–1422. doi: 10.1086/515465. [DOI] [PMC free article] [PubMed] [Google Scholar]
- Meister G, Buhler D, Pillai R, et al. A multiprotein complex mediates the ATP-dependent assembly of spliceosomal U snRNPs. Nat Cell Biol. 2001;3:945–949. doi: 10.1038/ncb1101-945. [DOI] [PubMed] [Google Scholar]
- Mentis GZ, Blivis D, Liu W, et al. Early functional impairment of sensory-motor connectivity in a mouse model of spinal muscular atrophy. Neuron. 2011;69:453–467. doi: 10.1016/j.neuron.2010.12.032. [DOI] [PMC free article] [PubMed] [Google Scholar]
- Michaud M, Arnoux T, Bielli S, et al. Neuromuscular defects and breathing disorders in a new mouse model of spinal muscular atrophy. Neurobiol Dis. 2010;38:125–135. doi: 10.1016/j.nbd.2010.01.006. [DOI] [PubMed] [Google Scholar]
- Mitsumoto H, Floyd A, Tang MX, et al. Transcranial magnetic stimulation for upper motor neuron involvement in amyotrophic lateral sclerosis (ALS) Suppl Clin Neurophysiol. 2006;59:327–332. doi: 10.1016/s1567-424x(09)70048-0. [DOI] [PubMed] [Google Scholar]
- Monani UR, Coovert DD, Burghes AH. Animal models of spinal muscular atrophy. Hum Mol Genet. 2000a;9:2451–2457. doi: 10.1093/hmg/9.16.2451. [DOI] [PubMed] [Google Scholar]
- Monani UR, Sendtner M, Coovert DD, et al. The human centromeric survival motor neuron gene (SMN2) rescues embryonic lethality in Smn(−−) mice and results in a mouse with spinal muscular atrophy. Hum Mol Genet. 2000b;9:333–339. doi: 10.1093/hmg/9.3.333. [DOI] [PubMed] [Google Scholar]
- Monani UR, Pastore MT, Gavrilina TO, et al. A transgene carrying an A2G missense mutation in the SMN gene modulates phenotypic severity in mice with severe (type I) spinal muscular atrophy. J Cell Biol. 2003;160:41–52. doi: 10.1083/jcb.200208079. [DOI] [PMC free article] [PubMed] [Google Scholar]
- Munsat TL, Davies KE. International SMA consortium meeting. 26–28 June 1992, Bonn, Germany. Neuromuscul Disord. 1992;2:423–428. doi: 10.1016/s0960-8966(06)80015-5. [DOI] [PubMed] [Google Scholar]
- Murray LM, Comley LH, Thomson D, et al. Selective vulnerability of motor neurons and dissociation of pre- and post-synaptic pathology at the neuromuscular junction in mouse models of spinal muscular atrophy. Hum Mol Genet. 2008;17:949–962. doi: 10.1093/hmg/ddm367. [DOI] [PubMed] [Google Scholar]
- Murray LM, Beauvais A, Bhanot K, et al. Defects in neuromuscular junction remodelling in the Smn(2B/–) mouse model of spinal muscular atrophy. Neurobiol Dis. 2012;49C:57–67. doi: 10.1016/j.nbd.2012.08.019. [DOI] [PubMed] [Google Scholar]
- Osborne M, Gomez D, Feng Z, et al. Characterization of behavioral and neuromuscular junction phenotypes in a novel allelic series of SMA mouse models. Hum Mol Genet. 2012;21:4431–4447. doi: 10.1093/hmg/dds285. [DOI] [PMC free article] [PubMed] [Google Scholar]
- Park GH, Maeno-Hikichi Y, Awano T, et al. Reduced survival of motor neuron (SMN) protein in motor neuronal progenitors functions cell autonomously to cause spinal muscular atrophy in model mice expressing the human centromeric (SMN2) gene. J Neurosci. 2010;30:12005–12019. doi: 10.1523/JNEUROSCI.2208-10.2010. [DOI] [PMC free article] [PubMed] [Google Scholar]
- Parsons DW, McAndrew PE, Iannaccone ST, et al. Intragenic telSMN mutations: frequency, distribution, evidence of a founder effect, and modification of the spinal muscular atrophy phenotype by cenSMN copy number. Am J Hum Genet. 1998;63:1712–1723. doi: 10.1086/302160. [DOI] [PMC free article] [PubMed] [Google Scholar]
- Pellizzoni L, Yong J, Dreyfuss G. Essential role for the SMN complex in the specificity of snRNP assembly. Science. 2002:1775–1779. doi: 10.1126/science.1074962. 298. [DOI] [PubMed] [Google Scholar]
- Porensky PN, Mitrpant C, McGovern VL, et al. A single administration of morpholino antisense oligomer rescues spinal muscular atrophy in mouse. Hum Mol Genet. 2012;21:1625–1638. doi: 10.1093/hmg/ddr600. [DOI] [PMC free article] [PubMed] [Google Scholar]
- Pun S, Santos AF, Saxena S, et al. Selective vulnerability and pruning of phasic motoneuron axons in motoneuron disease alleviated by CNTF. Nat Neurosci. 2006;9:408–419. doi: 10.1038/nn1653. [DOI] [PubMed] [Google Scholar]
- Riessland M, Ackermann B, Forster A, et al. SAHA ameliorates the SMA phenotype in two mouse models for spinal muscular atrophy. Hum Mol Genet. 2010;19:1492–1506. doi: 10.1093/hmg/ddq023. [DOI] [PubMed] [Google Scholar]
- Ruiz R, Lin J, Forgie A, et al. Treatment with trkC agonist antibodies delays disease progression in neuromuscular degeneration (nmd) mice. Hum Mol Genet. 2005;14:1825–1837. doi: 10.1093/hmg/ddi189. [DOI] [PubMed] [Google Scholar]
- Ruiz R, Casanas JJ, Torres-Benito L, et al. Altered intracellular Ca2+ homeostasis in nerve terminals of severe spinal muscular atrophy mice. J Neurosci. 2010;30:849–857. doi: 10.1523/JNEUROSCI.4496-09.2010. [DOI] [PMC free article] [PubMed] [Google Scholar]
- Schrank B, Gotz R, Gunnersen JM, et al. Inactivation of the survival motor neuron gene, a candidate gene for human spinal muscular atrophy, leads to massive cell death in early mouse embryos. Proc Natl Acad Sci U S A. 1997;94:9920–9925. doi: 10.1073/pnas.94.18.9920. [DOI] [PMC free article] [PubMed] [Google Scholar]
- Selvaraj BT, Frank N, Bender FL, et al. Local axonal function of STAT3 rescues axon degeneration in the pmn model of motoneuron disease. J Cell Biol. 2012;199:437–451. doi: 10.1083/jcb.201203109. [DOI] [PMC free article] [PubMed] [Google Scholar]
- Sendtner M. Therapy development in spinal muscular atrophy. Nat Neurosci. 2010;13:795–799. doi: 10.1038/nn.2565. [DOI] [PubMed] [Google Scholar]
- Simon CM, Jablonka S, Ruiz R, et al. Ciliary neurotrophic factor-induced sprouting preserves motor function in a mouse model of mild spinal muscular atrophy. Hum Mol Genet. 2010;19:973–986. doi: 10.1093/hmg/ddp562. [DOI] [PubMed] [Google Scholar]
- Swoboda KJ, Prior TW, Scott CB, et al. Natural history of denervation in SMA: relation to age, SMN2 copy number, and function. Ann Neurol. 2005;57:704–712. doi: 10.1002/ana.20473. [DOI] [PMC free article] [PubMed] [Google Scholar]
- Torres-Benito L, Neher MF, Cano R, et al. SMN requirement for synaptic vesicle, active zone and microtubule postnatal organization in motor nerve terminals. PLoS ONE. 2011;6:e26164. doi: 10.1371/journal.pone.0026164. [DOI] [PMC free article] [PubMed] [Google Scholar]
- Torres-Benito L, Ruiz R, Tabares L. Synaptic defects in SMA animal models. Dev Neurobiol. 2012;72:126–133. doi: 10.1002/dneu.20912. [DOI] [PubMed] [Google Scholar]