

Abstract
Objective:
Young adults meeting hypertension diagnostic criteria have a lower prevalence of a hypertension diagnosis than middle-aged and older adults. The purpose of this study was to compare the rates of a new hypertension diagnosis for different age groups and identify predictors of delays in the initial diagnosis among young adults who regularly use primary care.
Methods:
A 4-year retrospective analysis included 14 970 patients, at least 18 years old, who met clinical criteria for an initial hypertension diagnosis in a large, Midwestern, academic practice from 2008 to 2011. Patients with a previous hypertension diagnosis or prior antihypertensive medication prescription were excluded. The probability of diagnosis at specific time points was estimated by Kaplan–Meier analysis. Cox proportional hazard models (hazard ratio; 95% confidence interval) were fit to identify predictors of delays to an initial diagnosis, with a subsequent subset analysis for young adults (18–39 years old).
Results:
After 4 years, 56% of 18–24-year-olds received a diagnosis compared with 62% (25–31-year-olds), 68% (32–39-year-olds), and more than 70% (≥40-year-olds). After adjustment, 18–31-year-olds had a 33% slower rate of receiving a diagnosis (18–24 years hazard ratio 0.66, 0.53–0.83; 25–31 years hazard ratio 0.68, 0.58–0.79) compared with adults at least 60 years. Other predictors of a slower diagnosis rate among young adults were current tobacco use, white ethnicity, and non-English primary language. Young adults with diabetes, higher blood pressures, or a female provider had a faster diagnosis rate.
Conclusion:
Provider and patient factors are critical determinants of poor hypertension diagnosis rates among young adults with regular primary care use.
Keywords: delayed diagnosis, hypertension, young adults
INTRODUCTION
Hypertension is one of the leading preventable causes of death in the United States [1]. Blood pressures from young adulthood predict the incidence of future cardiovascular events [2]. Among young adults (18–39 years), approximately 20% of men and 15% of women have diagnosed hypertension, with an expected increase in prevalence due to high obesity rates [3].
According to the National Health and Nutrition Examination Survey (NHANES), rates of hypertension control have improved in the United States (defined per NHANES as an average SBP of <140 mmHg and diastolic pressure of <90 mmHg among patients with hypertension or self-reported current use of blood pressure-lowering medication) [4,5]. However, young adults have consistently low prevalence of hypertension control (38%) compared with middle-aged (40–59 years) and older (≥60 years) adults whose prevalence of control is 54 and 53%, respectively [4,6]. This is concerning because young adults with uncontrolled hypertension are at risk for chronic kidney disease and premature strokes, particularly in the presence of diabetes [3,7,8].
Unfortunately, prior studies report low hypertension diagnosis prevalence in young adults meeting criteria for hypertension [6,9]. Reasons for this disparity are largely unknown. Limited studies identifying barriers to hypertension diagnosis in young adults have focused on lower primary care use and the lack of a regular source of primary care as contributing factors [6,10]. However, a previous study demonstrated that young adult and middle-aged women (18–49 years) are less likely to be diagnosed with hypertension within an obstetrics/gynecology clinic compared to internal medicine [11], suggesting that, even with healthcare utilization, encounter context may impact timely hypertension diagnosis. Studies in middle-aged and older primary care patients also demonstrated that insufficient clinic time and competing comorbidities contribute to diagnosis delays (clinical inertia) [12,13]. The purpose of our study was to determine the rate of initial hypertension diagnosis and predictors that contribute to faster or slower rates of diagnosis among younger and older adults with regular primary care who meet clinical hypertension criteria.
METHODS
Sample
This study was approved by the University of Wisconsin-Madison Institutional Review Board with a waiver of consent. The current study was a secondary analysis of clinical and administrative data from a large, Midwestern, multidisciplinary academic group practice. To construct the study sample (Fig. 1), we first identified all patients at least 18 years old who met established criteria from the Wisconsin Collaborative for Healthcare Quality (WCHQ) [14,15] for being ‘currently managed’ in the practice between 1 January 2008 and 31 December 2011. WCHQ criteria are used in a statewide public reporting initiative to describe quality of care delivered by physician groups in Wisconsin. Patients are defined as currently managed by a primary care practice if a patient had at least two billable office encounters in an outpatient, nonurgent primary care setting, or one primary care encounter and one office encounter in an urgent care setting (regardless of diagnosis code), within 3 years, with at least one visit occurring in the prior 2 years [16]. These criteria were assessed for each of four calendar years for each patient. Patients were then evaluated for the first date they met clinical blood pressure eligibility criteria to receive a hypertension diagnosis. Patients were enrolled in the study on the first day they met criteria for blood pressure eligibility and for being currently managed. Blood pressure eligibility criteria were based on electronic medical record (EMR) data: at least three outpatient blood pressure measurements from three separate dates, at least 30 days apart, within a 2-year span (SBP ≥140 mmHg or DBP ≥90 mmHg) [1]; or two elevated blood pressures [11,17] (SBP ≥160 mmHg or DBP ≥100 mmHg), at least 30 days apart, but within a 2-year period. If more than one blood pressure was taken at a visit, the average was used [1]. Hospital and emergency room blood pressures were excluded. Patients continued to accrue time in the study until receiving a hypertension diagnostic code, the study ended, or censoring. Patients were censored if they died (censored day of death), were no longer currently managed (censored at the end of the year) [14,15], or achieved hypertension control prior to a diagnosis or hypertension treatment, defined as three consecutive normal blood pressures on three separate dates (<130/80 mmHg with diabetes or chronic kidney disease, otherwise <140/90 mmHg). The 365 days prior to study enrollment were used as a ‘baseline period’ to assess patients’ baseline comorbidities and utilization.
FIGURE 1.
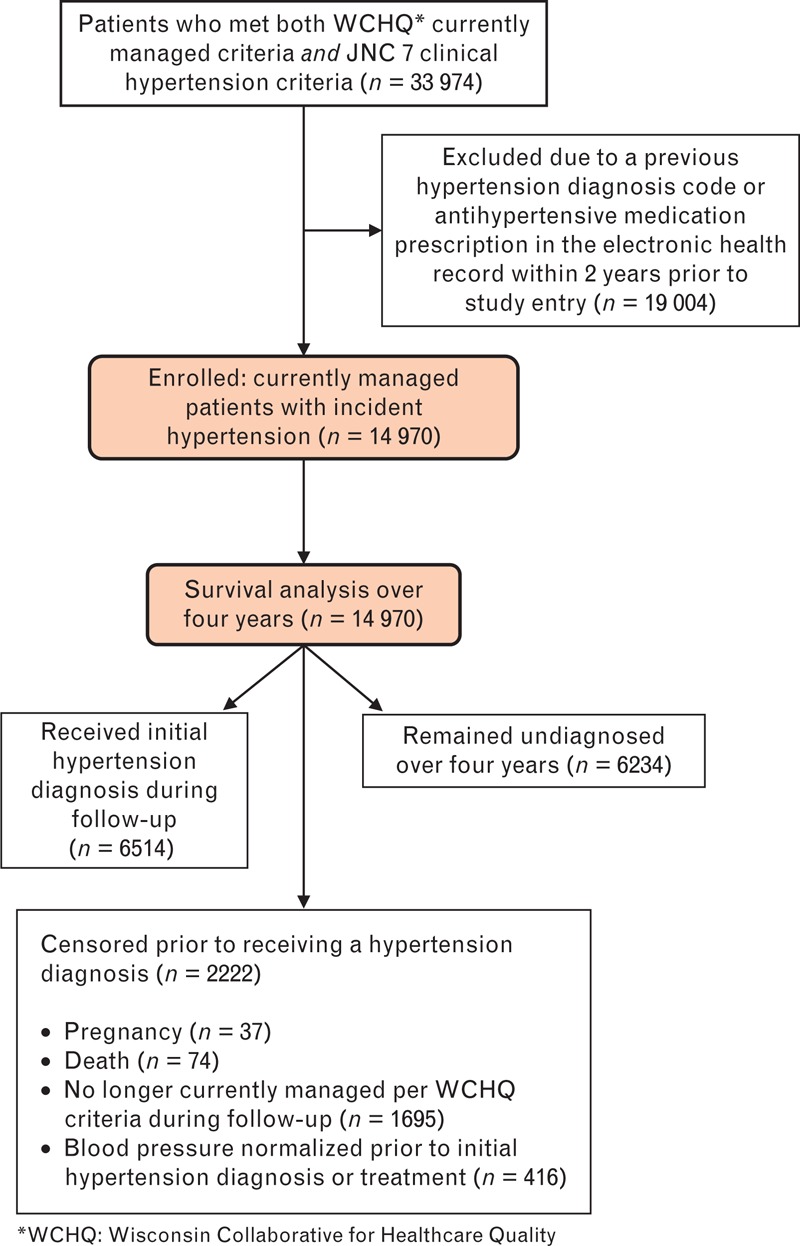
Study sample: enrollment and analysis. JNC 7, the Seventh Report of the Joint National Committee on Prevention, Detection, Evaluation, and Treatment of High Blood Pressure; WCHQ, Wisconsin Collaborative for Healthcare Quality.
To include patients only with incident hypertension, patients were excluded from analysis if, prior to the study start date, they had a hypertension diagnosis recorded in their EMR as defined by Tu et al. criteria [18] [ICD-9 code 401.x (essential hypertension), 402.x (hypertensive heart disease), 403.x (hypertensive renal disease), 404.x (hypertensive heart and renal disease), 405.x (secondary hypertension)], or any antihypertensive medication prescription. Patients who were pregnant during the study were excluded 1 year before, during, and 1 year after pregnancy using a modified approach developed by Manson et al.[19].
Primary outcome variable
The dependent variable was time (days) from the first date a patient met eligibility criteria to their initial hypertension diagnosis; results are reported in months. Diagnosis was defined by the first outpatient EMR entry of an ICD-9 code for hypertension, following Tu et al. criteria [18], an ICD-9 code of 796.2 for an ‘elevated blood pressure without a diagnosis of hypertension’ [20], or an antihypertensive medication prescription (if it preceded the date of the first hypertension ICD-9 code).
Explanatory variables
The selection of explanatory variables to identify barriers to a hypertension diagnosis was guided by an established conceptual model of clinical inertia [21] and clinical judgment. Patient-related variables included age, sex, marital status, baseline tobacco use, baseline BMI, primary spoken language at home, ever receiving Medicaid, and stage of hypertension per the Seventh Report of the Joint National Committee on Prevention, Detection, Evaluation, and Treatment of High Blood Pressure (JNC 7 criteria; Stage 1: 140–159/90–99 mmHg; Stage 2: ≥160/100 mmHg) [1]. Patients’ baseline comorbidities were defined based upon ICD-9 codes per previously published, validated criteria. The Chronic Condition Warehouse algorithm was used to identify ischemic heart disease [22,23]; established algorithms were used to identify the presence of hyperlipidemia [24], diabetes mellitus [25], anxiety [26], chronic kidney disease [27], and peripheral vascular disease [28]. For low prevalence conditions, we created an indicator variable for the presence of any of the following [22,23]: atrial fibrillation, congestive heart failure, stroke/transient ischemic attack, other neurological disorders, collagen vascular disease, alcohol abuse, and deficiency anemia.
We constructed variables to describe baseline healthcare utilization patterns, which may influence the likelihood of receiving a hypertension diagnosis. The Johns Hopkins Adjusted Clinical Group (ACG) Case-Mix System (version 10.0) uses encounter data to generate a summary index score that reflects a patient's risk of subsequent resource utilization [29]. Additional measures included the number of primary care, specialty, and urgent care visits at baseline. Primary care visits included family medicine, internal medicine, obstetrics/gynecology, and pediatrics/adolescent medicine physicians (faculty, residents, fellows), nurse practitioners, and physician assistants [30,31].
Patients were assigned to a primary care provider based on patterns of outpatient face-to-face Evaluation & Management visits to physicians in the group as reported in professional service claims [16]. Each provider's age was obtained from the provider group's human resources office and the American Medical Association. Providers’ specialties and sexes were acquired from human resources offices. The year of study entry was included as an explanatory variable (2008, 2009, 2010, 2011) to adjust for healthcare system and provider behavior over time [32].
Manual chart abstraction
Lifestyle counseling is a cornerstone to hypertension management, especially for young adults, but was not coded in the electronic health record. Therefore, we randomly selected 500 young adults (18–39 years old) and conducted a manual chart abstraction to assess the presence of documented lifestyle counseling within 1 year of meeting JNC7 clinical criteria for incident hypertension. The providers’ progress notes and patient instructions were manually abstracted within the electronic health record for each face-to-face ambulatory visit to assess for the presence of any counseling topics per JNC7 guideline recommendations.
Statistical analysis
Analyses were conducted using Stata 10.0 (Stata-Corp, College Station, Texas, USA). Descriptive analysis was conducted for the manual chart abstraction data. Categorical variables were summarized using percentages; continuous variables were summarized using means (standard deviations). Univariate Kaplan–Meier survival curves were computed for age groups (18–24, 25–31, 32–39, 40–59, and ≥60 years) to evaluate the probability of obtaining a diagnosis as a function of time since meeting criteria. A multivariable Cox proportional hazards regression analysis was conducted using robust estimates of the variance to obtain adjusted hazard ratios and 95% confidence intervals (CIs) for explanatory variables associated with receiving an initial hypertension diagnosis among all age groups and young adults (18–39 years). Tests were considered significant at P <0.05. Explanatory variables were considered for inclusion if statistically significant at P < 0.2 in Pearson correlations [33] and if the proportional-hazards assumption for the resultant model was not violated. Theoretically motivated interactions were tested between variables. The proportional-hazards assumption for the model was tested using a generalized linear regression of the scaled Schoenfeld residuals on functions of time [34].
RESULTS
Descriptive data
Overall, 14 970 patients met criteria for analysis (Table 1). Young adults (18–39 years) constituted 27% of the total sample. Among the 4023 young adults, 60% were male. Young adults had a higher percentage of ethnic minorities, current tobacco users, Medicaid use, and higher BMI than adults at least 40 years. Younger adults had more primary care and urgent care visits than patients at least 60 years old. Family medicine providers were more likely the provider for young adults than internal medicine providers. Provider age varied among patients; older providers were more likely to care for older adults.
TABLE 1.
Baseline demographics by age group
| Total population N = 14970 | By age group | ||||||
| 18–24 years N = 573 (3.8%) | 25–31 years N = 1365 (9.1%) | 32–39 years N = 2085 (14%) | 40–59 years N = 7396 (49%) | ≥60 years N = 3551 (23%) | P value | ||
| Patient characteristics | |||||||
| Age, years, mean (SD) | 50 (15) | 22 (2.1) | 29 (2.0) | 36 (2.4) | 50 (5.6) | 69 (7.8) | <0.001 |
| Female, n (%) | 7409 (49) | 227 (40) | 554 (41) | 843 (40) | 3702 (50) | 2083 (59) | <0.001 |
| Marital status, n (%) | <0.001 | ||||||
| Single | 4169 (28) | 520 (91) | 795 (58) | 700 (34) | 1658 (22) | 496 (14) | |
| Married/partnered | 8910 (60) | 44 (7.7) | 516 (38) | 1238 (59) | 4857 (66) | 2255 (64) | |
| Separated/divorced/widowed/other | 1891 (13) | 9 (1.6) | 54 (4.0) | 147 (7.1) | 881 (12) | 800 (23) | |
| Race/ethnicity, n (%) | <0.001 | ||||||
| White | 13224 (88) | 474 (83) | 1136 (83) | 1732 (83) | 6561 (89) | 3321 (94) | |
| Black | 714 (4.8) | 52 (9.1) | 108 (7.9) | 165 (7.9) | 352 (4.8) | 37 (1.0) | |
| Othera | 1032 (6.9) | 47 (8.2) | 121 (8.9) | 188 (9.0) | 483 (6.5) | 193 (5.4) | |
| Tobacco use, n (%) | <0.001 | ||||||
| Current tobacco use | 2653 (18) | 150 (26) | 357 (26) | 454 (22) | 1397 (19) | 295 (8.3) | |
| Former tobacco use | 3686 (25) | 67 (12) | 275 (20) | 434 (21) | 1672 (23) | 1238 (35) | |
| Never used tobacco | 6375 (43) | 283 (49) | 516 (38) | 879 (42) | 3191 (43) | 1506 (42) | |
| Unknown/missing | 2256 (15) | 73 (13) | 217 (16) | 318 (15) | 1136 (15) | 512 (14) | |
| BMI, kg/m2, mean (SD) | 31 (8.4) | 33 (12) | 33 (8.4) | 33 (8.1) | 31 (6.8) | 29 (10) | <0.001 |
| Female, mean (SD) | 31 (8.1) | 35 (11) | 34 (9.5) | 35 (9.0) | 31 (7.7) | 28 (6.3) | <0.001 |
| Male, mean (SD) | 31 (5.9) | 30 (7.8) | 31 (6.9) | 32 (6.6) | 31 (5.5) | 29 (4.8) | <0.001 |
| Primary spoken language, n (%) | <0.001 | ||||||
| English | 13798 (92) | 512 (89) | 1200 (88) | 1899 (91) | 6872 (93) | 3315 (93) | |
| Other | 1172 (7.8) | 61 (11) | 165 (12) | 186 (8.9) | 524 (7.1) | 236 (6.7) | |
| JNC 7 stage of hypertension,b n (%) | 0.043 | ||||||
| Stage 1: 140–159/90–99 mmHg | 11460 (77) | 456 (80) | 1062 (78) | 1622 (78) | 5591 (76) | 2729 (77) | |
| Stage 2: ≥160/100 mmHg | 3510 (23) | 117 (20) | 303 (22) | 463 (22) | 1805 (24) | 822 (23) | |
| Baseline comorbid conditions, n (%) | |||||||
| Hyperlipidemia | 2968 (20) | 18 (3.1) | 76 (5.6) | 226 (11) | 1494 (20) | 1154 (33) | <0.001 |
| Diabetes mellitus | 771 (5.2) | 19 (3.3) | 26 (1.9) | 78 (3.7) | 370 (5.0) | 278 (7.8) | <0.001 |
| Anxiety | 2008 (13) | 115 (20) | 267 (20) | 322 (15) | 995 (13) | 309 (8.7) | <0.001 |
| Chronic kidney disease | 166 (1.1) | 2 (0.4) | 8 (0.6) | 17 (0.8) | 65 (0.9) | 74 (2.1) | <0.001 |
| Ischemic heart disease | 272 (1.8) | 1 (0.2) | 2 (0.2) | 7 (0.3) | 86 (1.2) | 176 (5.0) | <0.001 |
| Peripheral vascular disease | 224 (1.5) | 0 (0.0) | 3 (0.2) | 6 (0.3) | 63 (0.9) | 152 (4.3) | <0.001 |
| On Medicaid ever,c n (%) | 1449 (9.7) | 115 (20) | 260 (19) | 339 (16) | 659 (8.9) | 76 (2.1) | <0.001 |
| ACGd score, young, mean (SD) | 1.6 (2.0) | 1.1 (1.4) | 1.0 (1.3) | 1.1 (1.2) | 1.6 (1.9) | 2.4 (2.5) | <0.001 |
| Baseline ambulatory visit counts, annual, mean (SD) | |||||||
| Primary care visits | 2.6 (2.5) | 2.9 (3.2) | 2.7 (2.7) | 2.7 (2.6) | 2.5 (2.4) | 2.4 (2.2) | <0.001 |
| Specialty care visits | 2.3 (3.1) | 2.0 (3.0) | 2.1 (2.7) | 2.0 (2.7) | 2.1 (2.9) | 3.0 (3.8) | <0.001 |
| Urgent care visits | 0.5 (1.1) | 0.9 (1.6) | 1.0 (1.6) | 0.8 (1.2) | 0.5 (1.0) | 0.3 (0.7) | <0.001 |
| Provider characteristics | |||||||
| Female, n (%) | 6742 (45) | 256 (45) | 624 (46) | 942 (45) | 3340 (45) | 1580 (44) | 0.21 |
| Specialty providing majority of ambulatory care, n (%) | <0.001 | ||||||
| Internal medicine | 5492 (37) | 108 (19) | 390 (29) | 593 (28) | 2628 (36) | 1773 (50) | |
| Family medicine/family practice | 7507 (50) | 321 (56) | 777 (57) | 1221 (59) | 3791 (51) | 1397 (39) | |
| Other | 1971 (13) | 144 (25) | 198 (15) | 271 (13) | 977 (13) | 381 (11) | |
| Age,e years, mean (SD) | 46 (11) | 44 (11) | 42 (10) | 44 (11) | 46 (11) | 49 (11) | <0.001 |
N, numerator.
aOther ethnicities: Hispanic/Latino (1.9%); Asian (1.5%); Native Hawaiian/Pacific Islander (0.5%); American Indian/Alaska Native (0.3%); Unknown (2.7%).
bJNC 7 Stage of hypertension = severity of blood pressure elevation at study entry.
cOn Medicaid at any point during the baseline or study period.
dACG = Adjusted Clinical Group Case-Mix Assessment System.
eAMA is the source for the raw physician data (provider ages only); statistics, tables, or tabulations were prepared by User-Customer (M.A.S., H.M.S.) using AMA Masterfile data (Identification of who owns the file and who used the file is required by the AMA data use agreement).
Average follow-up was a mean (standard deviation) of 17 (13) months: 18–24-year-olds 15 (12), 25–31-year-olds 15 (12), 32–39-year-olds 16 (13), 40–59-year-olds 17 (13), at least 60-year-olds 17 (13). In the first 3 years, 14% (n = 574) of 18–39-year-olds were censored due to no longer meeting currently managed criteria, compared with 10% (n = 1121) of adults at least 40 years old.
Hypertension diagnosis rates
Kaplan–Meier curves demonstrated that young adults had a lower diagnosis rate than middle-aged and older adults (Fig. 2). After 2 years, only 39% of 18–24-year-olds compared with 43% (25–31-year-olds), 49% (32–39-year-olds), and 54% (≥40-year-olds) received a diagnosis. After 4 years, 56% of 18–24-year-olds compared with 62% (25–31-year-olds), 68% (32–39-year-olds), 71% (40–59-year-olds), and 73% (≥60-year-olds) received a diagnosis. Among patients who received a hypertension diagnosis, the mean time to diagnosis was 6 months or less (Table 2) with no significant difference by age groups.
FIGURE 2.
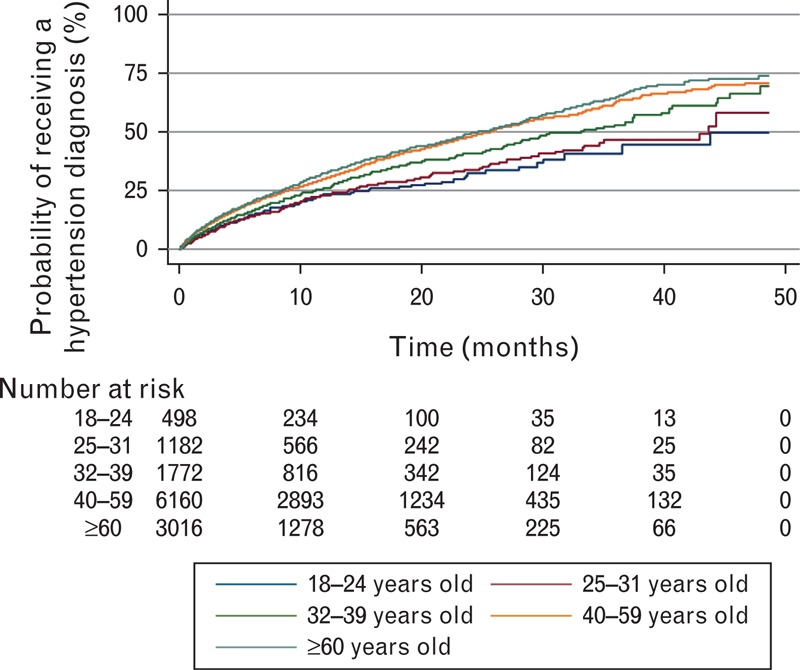
Kaplan–Meier estimates: likelihood of a hypertension diagnosis over 4 years.
TABLE 2.
Time to a hypertension diagnosis in months, among diagnosed patients
| Diagnosed population (N) | Median (months) | Mean (months) | Standard deviation | |
| Total population | 6514 | 1.5 | 5.6 | 8.4 |
| By age group | ||||
| 18–24 years old | 188 | 0.9 | 4.6 | 7.7 |
| 25–31 years old | 465 | 1.1 | 5.1 | 8.1 |
| 32–39 years old | 826 | 1.3 | 5.4 | 8.3 |
| 40–59 years old | 3412 | 1.4 | 5.7 | 8.4 |
| ≥60 years old | 1623 | 1.9 | 6.0 | 8.8 |
Predictors of time to hypertension diagnosis (all adults)
Unadjusted Cox proportional hazards models (Table 3) demonstrated that 18–39-year-olds had a slower rate of receiving an initial hypertension diagnosis. Adjusting for patient demographics, comorbidities, and provider factors, adults 18–24 years (hazard ratio 0.66; 0.53–0.83), 25–31 years (hazard ratio 0.68; 0.58–0.79), and 32–39 years (hazard ratio 0.85; 0.75–0.96) had slower rates of receiving a diagnosis than adults at least 60 years old.
TABLE 3.
Hazard ratios and 95% confidence intervals of independent predictors of a hypertension diagnosis (all participants, N = 14970)
| Variable | Unadjusted HR | 95% CI | P value | Adjusted HR | 95% CI | P value |
| Patient factors | ||||||
| Age | ||||||
| 18–24 years | 0.60 | (0.50–0.73) | <0.001 | 0.66 | (0.53–0.83) | <0.001 |
| 25–31 years | 0.63 | (0.56–0.72) | <0.001 | 0.68 | (0.58–0.79) | <0.001 |
| 32–39 years | 0.78 | (0.71–0.87) | <0.001 | 0.85 | (0.75–0.96) | 0.007 |
| 40–59 years | 0.95 | (0.88–1.0) | 0.13 | 0.98 | (0.90–1.1) | 0.56 |
| ≥60 years | 1.0 | – | – | 1.0 | – | – |
| Race/ethnicity | ||||||
| White | 1.0 | – | – | |||
| Black | 1.4 | (1.2–1.6) | <0.001 | |||
| Other | 1.1 | (0.99–1.3) | 0.07 | |||
| Marital status | ||||||
| Single | 1.0 | – | – | |||
| Married/partnered | 1.0 | (0.96–1.1) | 0.31 | |||
| Separated/divorced/widowed/other | 1.1 | (0.98–1.2) | 0.10 | |||
| Tobacco use | ||||||
| Current tobacco use | 0.89 | (0.81–0.98) | 0.023 | |||
| Former tobacco use | 1.0 | (0.96–1.1) | 0.39 | |||
| Never used tobacco | 1.0 | – | – | |||
| Unknown/missing | 1.1 | (1.0–1.2) | 0.029 | |||
| BMI | 1.004 | (1.001–1.007) | 0.023 | |||
| On Medicaid during baseline or study period | 1.2 | (1.1–1.4) | 0.002 | |||
| Comorbid conditions | ||||||
| Diabetes mellitus | 1.4 | (1.2–1.6) | <0.001 | |||
| Anxiety | 1.1 | (0.97–1.2) | 0.17 | |||
| Chronic kidney disease | 1.5 | (1.1–2.0) | 0.010 | |||
| Low prevalence conditiona | 1.1 | (0.93–1.2) | 0.35 | |||
| ACGb risk score, young index | 1.02 | (1.00–1.04) | 0.09 | |||
| Intermittent normal blood pressures in baseline | 0.79 | (0.73–0.85) | <0.001 | |||
| JNC 7 Stage of hypertensionc | ||||||
| Stage 1: 140–159/90–99 mmHg | 1.0 | – | – | |||
| Stage 2: ≥160/100 mmHg | 2.0 | (1.6–2.7) | <0.001 | |||
| Study start year | ||||||
| 2008 | 1.2 | (1.0–1.4) | 0.021 | |||
| 2009 | 1.0 | (0.89–1.2) | 0.65 | |||
| 2010 | 1.0 | (0.85–1.2) | 0.99 | |||
| 2011 | 1.0 | – | – | |||
| 2008 start year x Stage 2 hypertensionint | 0.72 | (0.55–0.95) | 0.021 | |||
| 2009 start year x Stage 2 hypertensionint | 0.89 | (0.66–1.2) | 0.45 | |||
| 2010 start year x Stage 2 hypertensionint | 0.86 | (0.62–1.2) | 0.37 | |||
| 2011 start year x Stage 2 hypertensionint | 1.0 | – | – | |||
| Total ambulatory visit counts, annual mean | ||||||
| Primary care visits | 0.99 | (0.98–1.0) | 0.55 | |||
| Urgent Care visits | 0.96 | (0.921–0.996) | 0.030 | |||
| Provider factors | ||||||
| Primary specialty | ||||||
| Internal medicine | 1.0 | – | – | |||
| Family medicine/family practice | 1.0 | (0.94–1.1) | 0.77 | |||
| Other | 0.98 | (0.88–1.1) | 0.66 | |||
| Provider age | ||||||
| Lowest provider age quartile | 1.0 | – | – | |||
| 2nd provider age quartile | 1.0 | (0.91–1.1) | 0.99 | |||
| 3rd provider age quartile | 0.87 | (0.79–0.96) | 0.005 | |||
| Highest provider age quartile | 0.87 | (0.79–0.95) | 0.003 | |||
| Provider sex | ||||||
| Female | 1.2 | (1.1–1.3) | <0.001 | |||
CI, confidence interval; HR, hazard ratio.
aDue to low prevalence, an indicator variable was created for the presence of any of the following comorbidities: atrial fibrillation, congestive heart failure, stroke/transient ischemic attack, other neurological disorders, collagen vascular disease, alcohol abuse, or deficiency anemia.
bACG = Adjusted Clinical Group Case-Mix Assessment System.
cJNC 7 Stage of Hypertension = severity of blood pressure elevation at study entry.
Patients with slower diagnosis rates had higher urgent care use, intermittently normal baseline blood pressures, or currently used tobacco. Patients with faster diagnosis rates had diabetes, chronic kidney disease, a higher BMI, were African–American, or received Medicaid. Providers in the third and highest age quartiles (≥46 years) had lower diagnosis rates; female providers had higher rates.
Patients with stage 2 hypertension had faster diagnosis rates than patients with stage 1 hypertension. However, the effect of stage 2 hypertension on time to diagnosis differed by study start year (χ2 = 9.47; P = 0.024). Patients with stage 2 hypertension and a 2008 enrollment year had a 28% slower diagnosis rate than stage 2 patients with a 2011 start year. There was not a significant interaction between study start year and age (χ2 = 14.8; P = 0.253). The global test P value for the proportional-hazards assumption was 0.057 for all adults (Table 3).
Predictors of time to hypertension diagnosis among young adults
Unadjusted Cox proportional hazards limited to young adults (18–39 years old) demonstrated that 18–24-year-olds (hazard ratio 0.77; 0.63–0.95) and 25–31-year-olds (hazard ratio 0.81; 0.70–0.94) received diagnoses at slower rates than 32–39-year-olds (Table 4). After adjustment, age remained a significant predictor of a slower diagnosis rate among 18–31-year-olds than among 32–39-year-olds.
TABLE 4.
Hazard ratios and 95% confidence intervals of independent predictors of a hypertension diagnosis (young adults, N = 4023)
| Variable | Unadjusted HR | 95% CI | P value | Adjusted HR | 95% CI | P value |
| Patient factors | ||||||
| Age | ||||||
| 18–24 years | 0.77 | (0.63–0.95) | 0.014 | 0.76 | (0.61–0.95) | 0.018 |
| 25–31 years | 0.81 | (0.70–0.94) | 0.004 | 0.79 | (0.68–0.93) | 0.004 |
| 32–39 years | 1.0 | – | – | 1.0 | – | – |
| Sex | ||||||
| Female | 1.2 | (1.03–1.42) | 0.023 | |||
| Race/ethnicity | ||||||
| White | 0.73 | (0.57–0.94) | 0.013 | |||
| Black | 1.1 | (0.76–1.5) | 0.70 | |||
| Other | 1.0 | – | – | |||
| Tobacco use | ||||||
| Current tobacco use | 0.76 | (0.62–0.93) | 0.007 | |||
| Former tobacco use | 0.95 | (0.79–1.1) | 0.61 | |||
| Never used tobacco | 1.0 | – | – | |||
| Unknown/missing | 1.0 | (0.83–1.2) | 0.90 | |||
| BMI | 1.006 | (0.999–1.014) | 0.11 | |||
| Primary spoken language | ||||||
| English | 1.0 | – | – | |||
| Other | 0.59 | (0.43–0.79) | 0.001 | |||
| On Medicaid during baseline or study period | 1.2 | (0.96–1.4) | 0.12 | |||
| Comorbid conditions | ||||||
| Diabetes mellitus | 1.6 | (1.1–2.3) | 0.006 | |||
| Anxiety | 1.2 | (1.0–1.5) | 0.049 | |||
| ACGa risk score, young index | 1.0 | (0.97–1.1) | 0.38 | |||
| Intermittent normal blood pressures in baseline | 0.74 | (0.63–0.87) | <0.001 | |||
| JNC 7 Stage of hypertensionb | ||||||
| Stage 1: 140–159/90–99 mmHg | 1.0 | – | – | |||
| Stage 2: ≥160/100 mmHg | 1.8 | (1.5–2.1) | <0.001 | |||
| Study start year | ||||||
| 2008 | 1.0 | – | – | |||
| 2009 | 1.1 | (0.92–1.3) | 0.31 | |||
| 2010 | 0.87 | (0.71–1.1) | 0.21 | |||
| 2011 | 0.83 | (0.63–1.1) | 0.17 | |||
| Total ambulatory visit counts, annual mean | ||||||
| Primary care visits | 0.88 | (0.79–0.99) | 0.036 | |||
| Specialty visits | 1.0 | (0.99–1.1) | 0.10 | |||
| Urgent care visits | 0.94 | (0.87–1.0) | 0.15 | |||
| Provider factors | ||||||
| Primary specialty | ||||||
| Internal medicine | 1.0 | – | – | |||
| Family medicine/family practice | 0.91 | (0.76–1.1) | 0.26 | |||
| Other | 0.93 | (0.74–1.2) | 0.52 | |||
| Provider age | ||||||
| Lowest provider age quartile | 1.0 | – | – | |||
| 2nd provider age quartile | 1.1 | (0.88–1.3) | 0.57 | |||
| 3rd provider age quartile | 0.93 | (0.75–1.1) | 0.47 | |||
| Highest provider age quartile | 0.97 | (0.79–1.2) | 0.75 | |||
| Provider sex | ||||||
| Female | 1.3 | (1.1–1.5) | 0.001 | |||
CI, confidence interval; HR, hazard ratio.
aACG = Adjusted Clinical Group Case-Mix Assessment System.
bJNC 7 Stage of Hypertension = severity of blood pressure elevation at study entry.
Cox proportional hazard models restricted to young adults (18–39) demonstrated slower diagnosis rates among 18–39-year-olds who had a non-English primary home language, intermittently normal baseline blood pressures, were white, or current tobacco users. Young adults had a faster diagnosis rate if they had diabetes, Stage 2 hypertension, a female primary care provider, or were female. Study start year was not a significant predictor among young adults (χ2 = 5.98; P = 0.113). Provider specialty was not associated with diagnosis rates among young adults. The global test P value for the proportional-hazards assumption was 0.172 among young adults (Table 4).
Documented lifestyle counseling among young adults
Among a subgroup of 500 randomly selected young adults, mean age 32 years (SD = 5.6 years), 45% (n = 225) did not have any documented lifestyle counseling within 1 year of meeting criteria for incident hypertension. The majority of young adults (53%) had a documented family history of hypertension or premature coronary artery disease.
DISCUSSION
Our sentinel findings demonstrate that young adults who meet criteria for a hypertension diagnosis, even with regular primary care use, have a slower rate of receiving an initial diagnosis than middle-aged and older adults. Kaplan–Meier curves demonstrated that at 4 years, 56% of 18–24-year-olds, 62% (25–31-year-olds), and 68% (32–39-year-olds) received an initial hypertension diagnosis. However, among adults who received a hypertension diagnosis, the time to diagnosis between age groups was not remarkably different.
Previous research suggests that the lack of a regular source of primary care is a significant contributor to gaps in hypertension control among young adults [6]. We demonstrated that even among adults with regular primary care access, 18–39-year-olds were unlikely to receive a hypertension diagnosis compared with adults at least 40 years old. This study extends previous research examining predominantly middle-aged and older adults describing clinical inertia in diagnosing hypertension [12,13,35]. Our research determined multifactorial predictors of clinical inertia contributing to a slower rate of hypertension diagnosis in the young adult population. However, none of the variables fully explained the diagnostic inertia related to age.
In our study, among young adults, language and ethnicity were significantly associated with a delayed hypertension diagnosis. Young adults whose primary home language was not English had a 41% slower diagnosis rate. This supports previous research in predominantly older adults that language barriers significantly affect the diagnosis of hypertension [36]. This highlights the importance of addressing communication barriers to improve cardiovascular risk factor management among adults whose primary language is not English. In contrast, African–Americans had a faster diagnosis rate than patients of white ethnicity. Results from the National Health Interview Survey demonstrated that African–Americans are more likely to know they have hypertension [4]. Interestingly, patient behavior, specifically tobacco use, significantly decreased the rate of diagnosis. Young adults currently using tobacco had a 24% slower rate of receiving a diagnosis. A similar trend was previously documented among young female current tobacco users [11]. Among patient comorbidities, young adults with diabetes had a faster rate of hypertension diagnosis. As almost 90% of patients with diabetes have one or more additional chronic conditions, this finding may reflect concordant risk perceptions for diabetes and hypertension as a cue for care [37].
Provider factors also contributed to hypertension diagnosis delays. Contrary to previous literature, a provider's specialty was not a significant predictor for an initial diagnosis in young adults [11]. However, female providers had a faster rate of diagnosis in young adults. In previous research, female providers have demonstrated greater ‘partnership-building skills’ and longer visits than male providers [38]. In addition, young adults with Stage 1 hypertension had a slower rate of diagnosis than patients with higher blood pressures. According to previous studies, primary care providers may have a higher threshold than 140/90 mmHg for the diagnosis and treatment of hypertension, despite JNC7 guidelines [39]. Finally, young adults with intermittently normal blood pressures at baseline had a 26% slower diagnosis rate, emphasizing the need for out-of-office blood pressures to evaluate variability [40].
Predictors of receiving a hypertension diagnosis in the larger population were similar to findings observed among young adults. Provider age predicted a slower diagnosis rate for adults overall, but not when examining delays solely among young adults. Interestingly, there was an interaction between stage of hypertension and year of study entry, reflecting faster diagnosis rates for patients with Stage 2 hypertension during later study years. Although reasons for this interaction are likely multifactorial (e.g. healthcare system interventions), it represents a change in practice patterns over time [32]. However, this interaction was not significant among young adults, highlighting a continued gap in hypertension management between younger and older adult populations.
These critical findings underscore the need for healthcare system interventions tailored to young adults to improve the diagnosis of hypertension. Young adults were censored primarily due to no longer meeting criteria for being currently managed, reflecting well documented transitions in this population (insurance, college, etc.) [41]. Interventions such as decreased time between follow-up visits or outreach between visits may improve the care of young adults with elevated blood pressures. The negative health effects of chronically elevated blood pressure should be routinely communicated, especially among young adults with multiple cardiovascular risk factors [38].
We asked the institution's ambulatory quality improvement committee to comment on our results on why approximately 40% of young adults with hypertension remain undiagnosed over 4 years. The committee included primary care physicians and nurse practitioners from two different clinics and quality improvement administrative directors. Both physicians highlighted time as a major factor. According to one physician, ‘it is not possible to address everything in a 15-min visit’. One quality director emphasized the need for a greater number of ‘nurse blood pressure follow-up clinic visits’. Another physician shared the importance of ‘following the guidelines’ to direct appropriate follow-up for hypertension management and highlighted that ‘each provider does things differently in their own clinic’. One nurse practitioner was concerned about ‘trusting the blood pressure’ if the blood pressure measurement technique varied between clinics. Even from this single committee, the need is demonstrated for system-level interventions to improve hypertension control among young adults.
A major strength of this study is the evaluation of a young adult patient population with incident hypertension that was receiving regular primary care within a large multispecialty group practice. A limitation is the potential for misclassification of hypertension and comorbidities using administrative data; however, previously established and published algorithms were utilized to help address this concern.
As lifestyle modification counseling is critical to hypertension management per JNC 7 guidelines [1], we are aware that some providers may have provided lifestyle counseling but did not code a hypertension diagnosis. However, we demonstrated through manual chart abstraction that 45% of the 500 randomly selected young adults did not have documented counseling. Although we were unable to capture verbal counseling provided during the encounter, we did capture all provider notes, written patient instructions, and handouts provided through the integrated electronic health record system. Previous research that used videotaped encounters to assess lifestyle counseling also demonstrated low lifestyle counseling rates [42].
Finally, our sample was limited to a single Midwestern healthcare system and predictors may differ among other populations, healthcare systems, and geographic regions. However, the healthcare system included in this study is one of the 10 largest physician practice groups in the United States, including over 300 primary care physicians and 43 primary care clinics. The primary care clinics are located in both urban and rural settings, span across multiple counties, and are owned and operated by various entities including a hospital, a multispecialty physician group, and an academic health center. In addition, the inclusion of patient demographic, comorbidity, and utilization data in addition to provider data from this heterogeneous group of clinics improves the generalizability and clinical applicability of our data.
In conclusion, young adults, even with regular primary care use, have a significantly slower rate of receiving an initial hypertension diagnosis than middle-aged and older adults. Multiple factors contribute to poor hypertension diagnosis rates among young adults. Primary care interventions, tailored to young adults, are needed to improve hypertension control rates.
ACKNOWLEDGEMENTS
The authors gratefully acknowledge Katie Ronk for data preparation and Jamie LaMantia and Colleen Brown for article preparation.
Research reported in this study was supported by the Clinical and Translational Science Award (CTSA) program, previously through the National Center for Research Resources (NCRR) under award number UL1RR025011, and now by the National Center for Advancing Translational Sciences (NCATS) of the National Institutes of Health under award number U54TR000021. H.J. is supported by the National Heart, Lung, and Blood Institute of the National Institutes of Health under award number K23HL112907, and also by the University of Wisconsin Centennial Scholars Program of the University of Wisconsin School of Medicine and Public Health. C.B. is supported by the National Institute of Arthritis and Musculoskeletal and Skin Diseases of the National Institutes of Health under award number K23AR062381. N.P. is supported by the National Institute on Aging of the National Institutes of Health under award number K08AG029527. The content is solely the responsibility of the authors and does not necessarily represent the official views of the National Institutes of Health.
Additional funding for this project was provided by the University of Wisconsin Health Innovation Program and the University of Wisconsin School of Medicine and Public Health from The Wisconsin Partnership Program.
Conflicts of interest
H.J., C.B., N.P., and A.S. have clinical appointments with an academic group practice that has a financial interest in delivering care to the general population from which study participants were drawn. For the remaining authors, no conflicts of interest were declared.
Reviewers’ Summary Evaluations
Reviewer 1
The strengths of the article are that this was a large data audit that identified a population group of young adults who could benefit from more proactive intervention to prevent cardiovascular disease and other complications from hypertension. Enhanced physician education and awareness of the need not only to monitor but control blood pressure by initiating antihypertensive therapy sooner is required to achieve optimal blood pressure control. The main weakness of the article is its retrospective design that can only provide evidence of associations between the factors investigated and earlier and later diagnosis of hypertension.
Reviewer 2
The paper by Johnson et al. reports the results of a study aimed at assessing the rate of initial hypertension diagnosis and factors that contribute to slower or faster rates of diagnosis in relation to different age's strata in a primary care setting. The authors found that young age, current smoking and white ethnicity were independent predictors of a slower hypertension diagnosis. On the whole, this finding indicates that the risk of cardiovascular complications due to hypertension is underestimated in young people. Despite some limitations, including a retrospective design and the use electronic health record data to define patients with hypertension and other comorbidities, this study supports the view that management of hypertension needs to be improved in young individuals.
Footnotes
Correspondence to Heather M. Johnson, MD, MS, Assistant Professor of Medicine, Division of Cardiovascular Medicine, H4/512 CSC, MC 3248, 600 Highland Avenue, Madison, WI 53792, USA. Tel: +1 608 335 3146; fax: +1 608 263 0405; e-mail: hm2@medicine.wisc.edu
Abbreviations: CI, confidence interval; EMR, electronic medical record; JNC 7, The Seventh Report of the Joint National Committee on Prevention, Detection, Evaluation, and Treatment of High Blood Pressure; WCHQ, Wisconsin Collaborative for Healthcare Quality
Some of the findings reported in the study were presented in abstract form at the 2012 American Heart Association Scientific Sessions on 6 November 2012.
REFERENCES
- 1.Chobanian AV, Bakris GL, Black HR, Cushman WC, Green LA, Izzo JL, Jr, et al. The Seventh Report of the Joint National Committee on Prevention, Detection, Evaluation, and Treatment of High Blood Pressure: the JNC 7 report. JAMA 2003; 289:2560–2572 [DOI] [PubMed] [Google Scholar]
- 2.Vasan RS, Massaro JM, Wilson PW, Seshadri S, Wolf PA, Levy D, D’Agostino RB. Antecedent blood pressure and risk of cardiovascular disease: the Framingham Heart Study. Circulation 2002; 105:48–53 [DOI] [PubMed] [Google Scholar]
- 3.Tran CL, Ehrmann BJ, Messer KL, Herreshoff E, Kroeker A, Wickman L, et al. Recent trends in healthcare utilization among children and adolescents with hypertension in the United States. Hypertension 2012; 60:296–302 [DOI] [PMC free article] [PubMed] [Google Scholar]
- 4.Go AS, Mozaffarian D, Roger VL, Benjamin EJ, Berry JD, Borden WB, et al. Heart disease and stroke statistics – 2013 update: a report from the American Heart Association. Circulation 2013; 127:e6–e245 [DOI] [PMC free article] [PubMed] [Google Scholar]
- 5.Yoon PW, Gillespie CD, George MG, Wall HK. Control of hypertension among adults – National Health and Nutrition Examination Survey, United States, 2005–2008. MMWR Morb Mortal Wkly Rep 2012; 61 Suppl:19–25 [PubMed] [Google Scholar]
- 6.Egan BM, Zhao Y, Axon RN. US trends in prevalence, awareness, treatment, and control of hypertension, 1988-2008. JAMA 2010; 303:2043–2050 [DOI] [PubMed] [Google Scholar]
- 7.Crews DC, Plantinga LC, Miller ER, 3rd, Saran R, Hedgeman E, Saydah SH, et al. Prevalence of chronic kidney disease in persons with undiagnosed or prehypertension in the United States. Hypertension 2010; 55:1102–1109 [DOI] [PMC free article] [PubMed] [Google Scholar]
- 8.Kissela BM, Khoury JC, Alwell K, Moomaw CJ, Woo D, Adeoye O, et al. Age at stroke: temporal trends in stroke incidence in a large, biracial population. Neurology 2012; 79:1781–1787 [DOI] [PMC free article] [PubMed] [Google Scholar]
- 9.Daugherty SL, Masoudi FA, Ellis JL, Ho PM, Schmittdiel JA, Tavel HM, et al. Age-dependent gender differences in hypertension management. J Hypertens 2011; 29:1005–1011 [DOI] [PMC free article] [PubMed] [Google Scholar]
- 10.Steckelings UM, Stoppelhaar M, Sharma AM, Wittchen HU, Krause P, Küpper B, et al. HYDRA: possible determinants of unsatisfactory hypertension control in German primary care patients. Blood Press 2004; 13:80–88 [DOI] [PubMed] [Google Scholar]
- 11.Schmittdiel J, Selby JV, Swain B, Daugherty SL, Leong TK, Ho M, et al. Missed opportunities in cardiovascular disease prevention?: low rates of hypertension recognition for women at medicine and obstetrics-gynecology clinics. Hypertension 2011; 57:717–722 [DOI] [PMC free article] [PubMed] [Google Scholar]
- 12.Faria C, Wenzel M, Lee KW, Coderre K, Nichols J, Belletti DA. A narrative review of clinical inertia: focus on hypertension. J Am Soc Hypertens 2009; 3:267–276 [DOI] [PubMed] [Google Scholar]
- 13.Gil-Guillén V, Orozco-Beltrán D, Peréz RP, Alfonso JL, Redón J, Pertusa-Martínez S, et al. Clinical inertia in diagnosis and treatment of hypertension in primary care: quantification and associated factors. Blood Press 2010; 19:3–10 [DOI] [PubMed] [Google Scholar]
- 14.Hatahet MA, Bowhan J, Clough EA. Wisconsin Collaborative for Healthcare Quality (WCHQ): lessons learned. WMJ 2004; 103:45–48 [PubMed] [Google Scholar]
- 15.Sheehy A, Pandhi N, Coursin DB, Flood GE, Kraft SA, Johnson HM, Smith MA. Minority status and diabetes screening in an ambulatory population. Diabetes Care 2011; 34:1289–1294 [DOI] [PMC free article] [PubMed] [Google Scholar]
- 16.Thorpe CT, Flood GE, Kraft SA, Everett CM, Smith MA. Effect of patient selection method on provider group performance estimates. Med Care 2011; 49:780–785 [DOI] [PMC free article] [PubMed] [Google Scholar]
- 17.Myers MG, Tobe SW, McKay DW, Bolli P, Hemmelgarn BR, McAlister FA. New algorithm for the diagnosis of hypertension. Am J Hypertens 2005; 18:1369–1374 [DOI] [PubMed] [Google Scholar]
- 18.Tu K, Campbell NR, Chen ZL, Cauch-Dudek KJ, McAlister FA. Accuracy of administrative databases in identifying patients with hypertension. Open Med 2007; 1:e18–e26 [PMC free article] [PubMed] [Google Scholar]
- 19.Manson JM, McFarland B, Weiss S. Use of an automated database to evaluate markers for early detection of pregnancy. Am J Epidemiol 2001; 154:180–187 [DOI] [PubMed] [Google Scholar]
- 20.Hansen ML, Gunn PW, Kaelber DC. Underdiagnosis of hypertension in children and adolescents. JAMA 2007; 298:874–879 [DOI] [PubMed] [Google Scholar]
- 21.O’Connor PJ, Sperl-Hillen JM, Johnson PE, Rush WA, Blitz G. Henriksen K, Battles JB, Marks ES, Lewin DI. Clinical inertia and outpatient medical errors. Advances in patient safety: from research to implementation (Volume 2: Concepts and Methodology). Rockville, MD:Agency of Healthcare Research and Quality (US); 2005. 293–308 [Google Scholar]
- 22.Chronic Conditions Data Warehouse. 2011 Chronic Condition Reference List. Buccaneer, West Des Moines, IA: Available at: http://www.ccwdata.org/cs/groups/public/documents/document/ccw_conditionreferencelist2011.pdf [Accessed 26 March 2013] [Google Scholar]
- 23.Johnson ML, Petersen LA, Sundaravaradan R, Byrne MM, Hasche JC, Osemene NI, et al. The association of Medicare drug coverage with use of evidence-based medications in the Veterans Health Administration. Ann Pharmacother 2009; 43:1565–1575 [DOI] [PubMed] [Google Scholar]
- 24.Borzecki AM, Wong AT, Hickey EC, Ash AS, Berlowitz DR. Identifying hypertension-related comorbidities from administrative data: what's the optimal approach? Am J Med Qual 2004; 19:201–206 [DOI] [PubMed] [Google Scholar]
- 25.Hebert PL, Geiss LS, Tierney EF, Engelgau MM, Yawn BP, McBean AM. Identifying persons with diabetes using Medicare claims data. Am J Med Qual 1999; 14:270–277 [DOI] [PubMed] [Google Scholar]
- 26.Marciniak MD, Lage MJ, Dunayevich E, Russell JM, Bowman L, Landbloom RP, Levine LR. The cost of treating anxiety: the medical and demographic correlates that impact total medical costs. Depress Anxiety 2005; 21:178–184 [DOI] [PubMed] [Google Scholar]
- 27.Foley RN, Murray AM, Li S, Herzog CA, McBean AM, Eggers PW, Collins AJ. Chronic kidney disease and the risk for cardiovascular disease, renal replacement, and death in the United States Medicare population, 1998 to 1999. J Am Soc Nephrol 2005; 16:489–495 [DOI] [PubMed] [Google Scholar]
- 28.Newton KM, Wagner EH, Ramsey SD, McCulloch D, Evans R, Sandhu N, Davis C. The use of automated data to identify complications and comorbidities of diabetes: a validation study. J Clin Epidemiol 1999; 52:199–207 [DOI] [PubMed] [Google Scholar]
- 29.Starfield B, Weiner J, Mumford L, Steinwachs D. Ambulatory care groups: a categorization of diagnoses for research and management. Health Serv Res 1991; 26:53–74 [PMC free article] [PubMed] [Google Scholar]
- 30.Druss BG, Marcus SC, Olfson M, Tanielian T, Pincus HA. Trends in care by nonphysician clinicians in the United States. N Engl J Med 2003; 348:130–137 [DOI] [PubMed] [Google Scholar]
- 31.Pham HH, Schrag D, Hargraves JL, Bach PB. Delivery of preventive services to older adults by primary care physicians. JAMA 2005; 294:473–481 [DOI] [PubMed] [Google Scholar]
- 32.Smith MA, Wright A, Queram C, Lamb GC. Public reporting helped drive quality improvement in outpatient diabetes care among Wisconsin physician groups. Health Aff (Millwood) 2012; 31:570–577 [DOI] [PMC free article] [PubMed] [Google Scholar]
- 33.Mickey RM, Greenland S. The impact of confounder selection criteria on effect estimation. Am J Epidemiol 1989; 129:125–137 [DOI] [PubMed] [Google Scholar]
- 34.Grambsch PM, Therneau TM. Proportional hazards tests and diagnostics based on weighted residuals. Biometrika 1994; 81:515–526 [Google Scholar]
- 35.Selby JV, Lee J, Swain BE, Tavel HM, Ho PM, Margolis KL, et al. Trends in time to confirmation and recognition of new-onset hypertension, 2002-2006. Hypertension 2010; 56:605–611 [DOI] [PMC free article] [PubMed] [Google Scholar]
- 36.Eamranond PP, Patel KV, Legedza AT, Marcantonio ER, Leveille SG. The association of language with prevalence of undiagnosed hypertension among older Mexican Americans. Ethn Dis 2007; 17:699–706 [PubMed] [Google Scholar]
- 37.Piette JD, Kerr EA. The impact of comorbid chronic conditions on diabetes care. Diabetes Care 2006; 29:725–731 [DOI] [PubMed] [Google Scholar]
- 38.Jolles EP, Clark AM, Braam B. Getting the message across: opportunities and obstacles in effective communication in hypertension care. J Hypertens 2012; 30:1500–1510 [DOI] [PubMed] [Google Scholar]
- 39.Hyman DJ, Pavlik VN. Self-reported hypertension treatment practices among primary care physicians: blood pressure thresholds, drug choices, and the role of guidelines and evidence-based medicine. Arch Intern Med 2000; 160:2281–2286 [DOI] [PubMed] [Google Scholar]
- 40.Pickering TG, Hall JE, Appel LJ, Falkner BE, Graves J, Hill MN, et al. Recommendations for blood pressure measurement in humans and experimental animals: part 1: blood pressure measurement in humans: a statement for professionals from the Subcommittee of Professional and Public Education of the American Heart Association Council on High Blood Pressure Research. Circulation 2005; 111:697–716 [DOI] [PubMed] [Google Scholar]
- 41.Park MJ, Paul Mulye T, Adams SH, Brindis CD, Irwin CE., Jr The health status of young adults in the United States. J Adolesc Health 2006; 39:305–317 [DOI] [PubMed] [Google Scholar]
- 42.Milder IE, Blokstra A, de Groot J, van Dulmen S, Bemelmans WJ. Lifestyle counseling in hypertension-related visits: analysis of video-taped general practice visits. BMC Fam Pract 2008; 9:58. [DOI] [PMC free article] [PubMed] [Google Scholar]