

Abstract
Telomeres play a central role in cellular aging, and shorter telomere length has been associated with age-related disorders including diabetes. However, a causal link between telomere shortening and diabetes risk has not been established. In a well-characterized longitudinal cohort of American Indians participating in the Strong Heart Family Study, we examined whether leukocyte telomere length (LTL) at baseline predicts incident diabetes independent of known diabetes risk factors. Among 2,328 participants free of diabetes at baseline, 292 subjects developed diabetes during an average 5.5 years of follow-up. Compared with subjects in the highest quartile (longest) of LTL, those in the lowest quartile (shortest) had an almost twofold increased risk of incident diabetes (hazard ratio [HR] 1.83 [95% CI 1.26–2.66]), whereas the risk for those in the second (HR 0.87 [95% CI 0.59–1.29]) and the third (HR 0.95 [95% CI 0.65–1.38]) quartiles was statistically nonsignificant. These findings suggest a nonlinear association between LTL and incident diabetes and indicate that LTL could serve as a predictive marker for diabetes development in American Indians, who suffer from disproportionately high rates of diabetes.
Introduction
Telomeres are specialized DNA sequences and their associated protective proteins at the end of chromosomes. Telomere length shortens progressively during each round of cell division to a critical length, called the Hayflick limit (1), beyond which replicative senescence will be triggered. In humans, telomere length declines significantly with age, and shorter leukocyte telomere length (LTL) has been associated with type 2 diabetes (T2D) (2–4) and its related conditions, such as obesity (5,6), insulin resistance (7), impaired glucose tolerance (8), and atherosclerosis (9,10). However, these results were primarily derived from cross-sectional analyses and therefore raise an important question as to whether telomere loss is a cause or a consequence of diabetes or whether it is simply an epiphenomenon. To date, we are aware of only one prior study investigating the prospective association of LTL with risk of diabetes in postmenopausal women participating in the Women’s Health Initiative (WHI), but the association substantially attenuated after accounting for known risk factors (11). The prospective association of telomere shortening with diabetes risk remains largely undetermined. The goal of this study was to evaluate the prospective association between baseline LTL and incident diabetes after 5.5 years of follow-up in a longitudinal study of American Indians participating in the Strong Heart Family Study (SHFS).
Research Design and Methods
The SHFS is a family-based prospective study designed to identify genetic factors for cardiovascular disease (CVD), diabetes, and associated risk factors in American Indians. The study was initiated in 2001–2003 by recruiting 3,665 individuals (14–93 years old) from 94 multigenerational families residing in Arizona, North and South Dakota, and Oklahoma. Study design and methods of the SHFS have previously been described (12,13). The SHFS protocol was approved by the Institutional Review Boards from the Indian Health Service and the participating centers. All subjects gave informed consent.
The current study included 3,190 participants who attended clinical examinations at both baseline (2001–2003) and 5-years’ follow-up (2006–2009). After exclusion of subjects with prevalent diabetes (N = 638) or CVD (N = 156) at baseline and those with missing clinical data (N = 68), a total of 2,328 American Indian men and women were included in the current analysis.
Definition of Incident Diabetes
According to the 1997 American Diabetes Association criteria (14), diabetes was defined as fasting plasma glucose ≥7.0 mmol/L) or receiving insulin or oral hyperglycemic treatment. Impaired fasting glucose (IFG) was defined as a fasting glucose of 6.1–7.0 mmol/L. Fasting glucose <6.1 mmol/L was defined as normal. Incident diabetes was defined as subjects who were free of diabetes at baseline and developed T2D at the end of follow-up. Incident cases of diabetes were identified through follow-up of participants in examinations conducted at the end of follow-up and verified by review of medical records as previously described (15–17). Incidence of diabetes was also confirmed by record review by the SHFS Morbidity Committee (15). Over a mean 5.5 years of follow-up, 292 subjects (among 2,328 subjects free of diabetes and CVD at baseline) were confirmed to have incident diabetes, resulting in a 5-year incident rate of 12.5%.
Assessments of Diabetes Risk Factors
Fasting plasma glucose, insulin, lipids, lipoproteins, and inflammatory biomarkers were measured by standard laboratory methods (13,18). Subjects were classified as normal (BMI <25 kg/m2), overweight (25–29.9 kg/m2), or obese (BMI ≥30 kg/m2) according to National Institutes of Health guidelines (19). Hypertension was defined as blood pressure levels ≥140/90 mmHg or use of antihypertension medications. Cigarette smoking was classified as current smokers, former smokers, and nonsmokers. Alcohol consumption was determined by self-reported history of alcohol intake, the type of alcoholic beverages consumed, frequency of alcohol consumption, and average quantity consumed per day and per week. Participants are classified as current drinkers, former drinkers, and never drinkers. Dietary intake was assessed using the block food frequency questionnaire (20). Level of physical activity was assessed by the mean number of steps per day on a pedometer calculated by averaging the total number of steps recorded each day during the 7-day period.
Measurement of LTL
Genomic DNA from peripheral blood was isolated according to standard methods. LTL, as measured by the ratio of telomeric product/single copy gene (T/S ratio), was assessed by E.B.’s laboratory at the University of California, San Francisco, using a high-throughput telomere length assay system. Primers for the telomere PCR (T runs) are tel1b [5′-CGGTTT(GTTTGG)5GTT-3′] with a final concentration of 100 nmol/L and tel2b [5′-GGCTTG(CCTTAC)5CCT-3′] with a final concentration of 900 nmol/L. The primers for the single-copy gene (human β-globin) PCR (S runs) are hbg1 [5′ GCTTCTGACACAACTGTGTTCACTAGC-3′] at a final concentration of 300 nmol/L and hbg2 [5′-CACCAACTTCATCCACGTTCACC-3′] at a final concentration of 700 nmol/L. All primers were purchased from the Integrated DNA Technologies (Coralville, Iowa) in a standard desalted form. The LTL assay determines the T/S ratio obtained using quantitative PCR (qPCR) according to protocols described previously (21,22).
The rationale of this method is that the longer the telomeres are in each sample, the more PCR product will be generated in PCR reactions using primers specific for the telomeric DNA. This can be quantified by qPCR using a serially diluted standard DNA and the standard curve method. To normalize the quantity of the input DNA, a single-copy gene was amplified in parallel as well. The ratio of the telomeric product versus the single-copy gene reflects the average length of the telomeres. The qPCR amplification curves were analyzed by the Roche LightCycler software (Roche Applied Science, Indianapolis, IN), which uses the second derivative maximum method to determine the crossing point (Cp) values. All standard serial dilution Cps from all 182 qPCR runs were averaged to form the reference set of Cps to which all runs were normalized. This was done for the S runs and T runs separately. The average PCR efficiencies of S and T runs were 95 and 84%, respectively, and the Cp values were scaled accordingly. Each DNA sample was assayed three times. For the first assay, the DNA sample was diluted and aliquoted into a well in four separate 384-well PCR plates: two for T measurements (T1 and T2) and two for S measurements (S1 and S2). This was done two more times for T3–6 and S3–6 measurements. T/S ratio was calculated by dividing the mean of the two T concentrations and the two S concentrations [for the first assay, (T/S)1 = (T1 + T2) / (S1 + S2)]. Three of these T/S ratios, (T/S)1–3, were averaged, and SD and percentage of coefficient of variation (%CV) were calculated. In cases where this interassay %CV were >7%, an individual S or T Cp value (S1–6 or T1–6) that reduced the %CV most if removed was discounted; 3.3% of Cp values were considered outliers by this criteria. The T/S ratios were normalized to the mean of all samples and reported.
For quality control, seven control DNA samples from various cancer cell lines were included in each assay plate. These control samples allowed us to create standard curves, which were then integrated into a composite standard curve used for T and S concentration calculations. In addition, 4.1% of the total sample was assayed in duplicate. Telomere lengths of the replicate samples were highly correlated (r = 0.95, P < 0.0001). Laboratory technicians were blinded to any knowledge of clinical data. In our analysis, the intra-assay %CV was 4.6% and the interassay %CV (assay to assay) was 6.9%. Methods for the calculation of intra- and interassay CV are described in Supplementary Data.
Statistical Analyses
Descriptive data analyses were conducted using a generalized estimating equation (GEE) for continuous variables and χ2 test for categorical variables. A GEE was used here to account for the lack of independence among family members. All analyses were performed using SAS, version 9.3 (SAS Institute)
To evaluate whether baseline LTL predicts future onset of diabetes, we first conducted spline regression using continuous LTL as a predictor in the Cox proportional hazards model according to methods previously described (23). The rationale of this analysis is based on previous studies demonstrating a nonlinear relationship of LTL with risk of several diseases, e.g., cancer (24), coronary heart disease (25), and anemia (26). Thus, it is possible that the effect of telomeric aging on diabetes risk may also be nonlinear, which should be better characterized by spline regression. We then constructed a Cox regression model, in which time (in days) to incident diabetes was the dependent variable and LTL (quartiles) was the independent variable, adjusting for significant predictors selected by the Bayesian information criterion. The quadratic term of age was added to the model to capture nonlinearity of age with LTL or risk of diabetes and to minimize possible collinearity in the regression function.
In this study, we are interested in both the process of diabetes development (i.e., diabetes-free time) and diabetes outcome (i.e., occurrence of diabetes) at the end of follow-up. For this purpose, we used Cox proportional hazards regression analysis to capture both the “time” and the “event” components. In the Cox regression model, we used the clinical examination date on which a new case of diabetes was identified as the date of diagnosis; otherwise, follow-up was censored at the end of follow-up for participants who remained free of diabetes (27). The correlation among family members was accounted for using the frailty model implemented in SAS PROC PHREG, which has been extended to interval censored data for survival analysis (28). The proportional hazards assumption was tested by Schoenfeld residuals.
Sensitivity Analyses
To examine whether outliers of LTL influence our results, we excluded participants whose telomere lengths were outside ±3 SD. To investigate whether menopausal status affects the association between LTL and diabetes risk, we conducted a separate analysis among postmenopausal women, defined as those who had undergone either natural or surgical menopause. Natural menopause was defined as at least 12 months since the last menstrual period. If menopause was surgical, the participants were asked if only their uterus had been removed. Women who reported hysterectomy but no oophorectomy or who did not know whether their ovaries had been removed were included if they were ≥53 years old (29). The rationale for including these subjects was based on the fact that 90% of the menopausal women in the Strong Heart Study had attained natural menopause by age 53 years (30). To examine whether including patients on diabetes treatment influenced our results, we further adjusted for diabetes medication (insulin, oral hyperglycemic agents, both insulin and oral hyperglycemic agents, or none) in the statistical analysis. The potential batch effect (interassay variability) was controlled by including a covariate indicating assay plates.
Results
Baseline Characteristics According to Study Center and Diabetes Status in 3,665 American Indians Participating in the SHFS
Table 1 presents the baseline characteristics of SHFS study participants according to study center. The participants were aged 14–93 years at baseline, with an average (SD) age of 39.9 (17) years. The mean follow-up period was 5.5 years. Compared with subjects from Oklahoma or North and South Dakota, participants from Arizona were younger, more likely to be physically inactive and obese, and had lower HDL, higher plasma high-sensitivity C-reactive protein (hsCRP), and a higher rate of diabetes. However, their LDL and total cholesterol levels were lower compared with participants from Oklahoma and North and South Dakota. In contrast, subjects from North and South Dakota were more likely to be current smokers and current drinkers compared with those from Oklahoma and Arizona.
Table 1.
Baseline characteristics according to study center in 3,665 American Indian men and women participating in the SHFS (2001–2003)
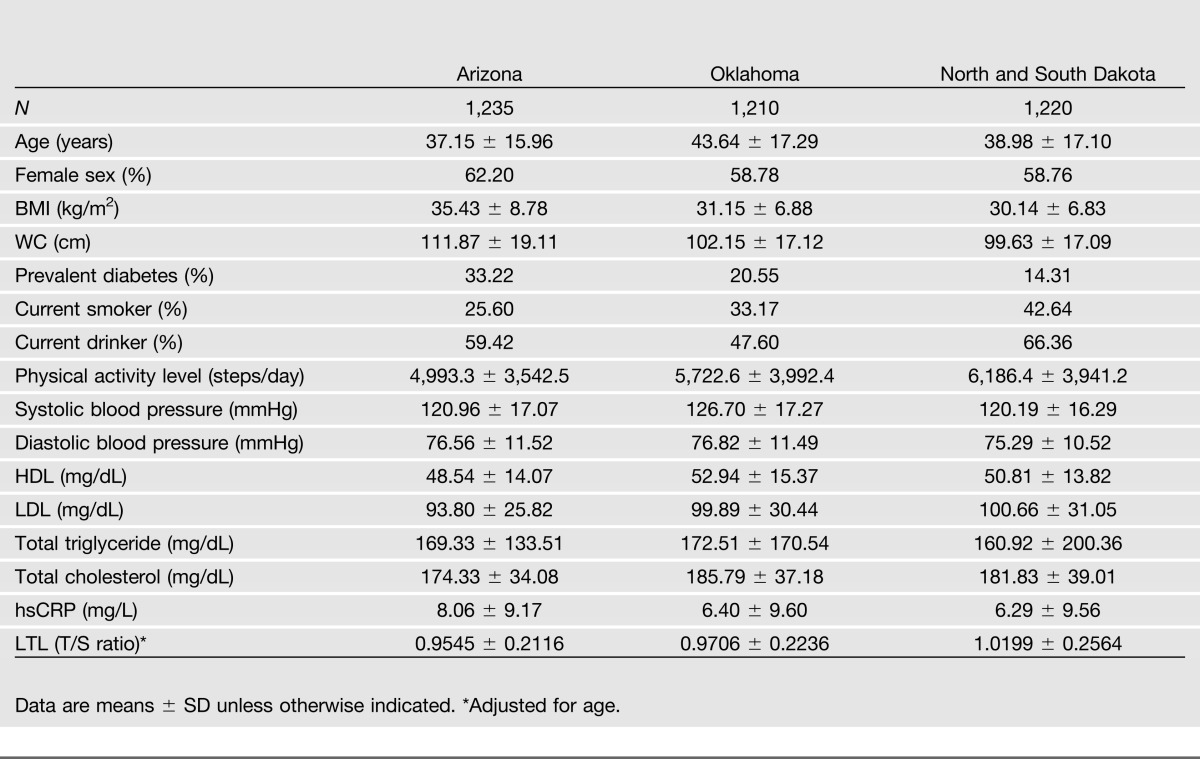
Mean LTL at baseline varied across study centers. Participants from Arizona had the shortest telomere length (mean T/S ratio = 0.95) compared with those from OK (mean T/S ratio = 0.97) and DK (mean T/S ratio = 1.02). Within each center, diabetic individuals were older, had significantly shorter LTL, higher BMI, larger waist circumference (WC), higher systolic blood pressure, higher levels of hsCRP and triglyceride, and lower levels of HDL. However, there appears to be no statistically significant difference in LDL level between diabetic and nondiabetic participants. In addition, diabetic individuals were physically inactive and less likely to be current drinkers than nondiabetic subjects. Demographic characteristics stratified by diabetes status in each center are shown in Supplementary Tables 1–3.
Baseline Characteristics According to LTL Quartiles Among 2,328 Participants Who Attended Both of the SHFS Clinical Visits at Baseline (2001–2003) and Follow-up (2006–2009)
Table 2 illustrates the distribution of diabetes-related factors according to LTL quartiles among participants attending both clinical visits at baseline and 5-year follow-up. As expected, LTL significantly decreases with age in that older American Indians had shorter LTL than their younger counterparts (P < 0.0001). LTL also significantly differs by traditional T2D risk factors including BMI, WC, systolic blood pressure, and hsCRP (age-adjusted P for trend ≤0.02). However, there was no significant difference in other risk factors across the LTL quartiles.
Table 2.
Baseline characteristics according to LTL quartiles among 2,328 study participants attending both clinical visits at baseline (2001–2003) and follow-up (2006–2009) of the SHFS
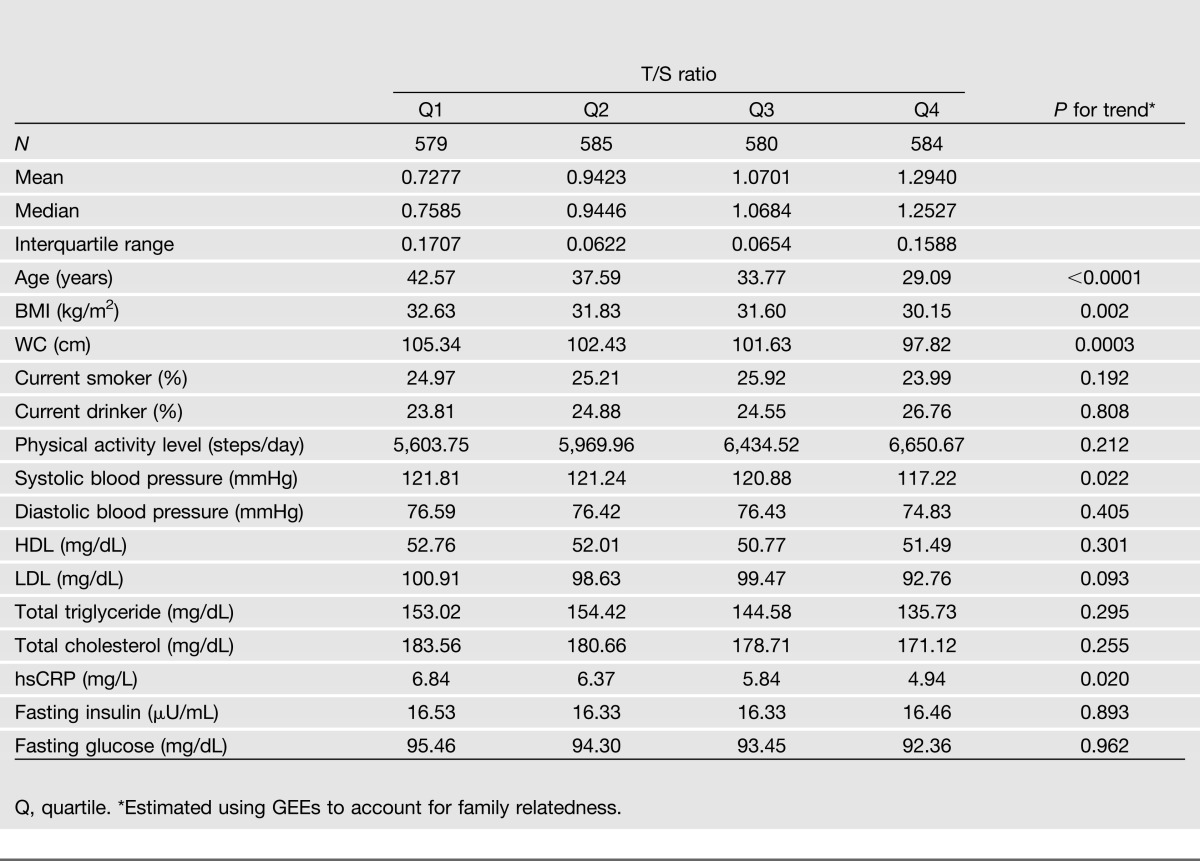
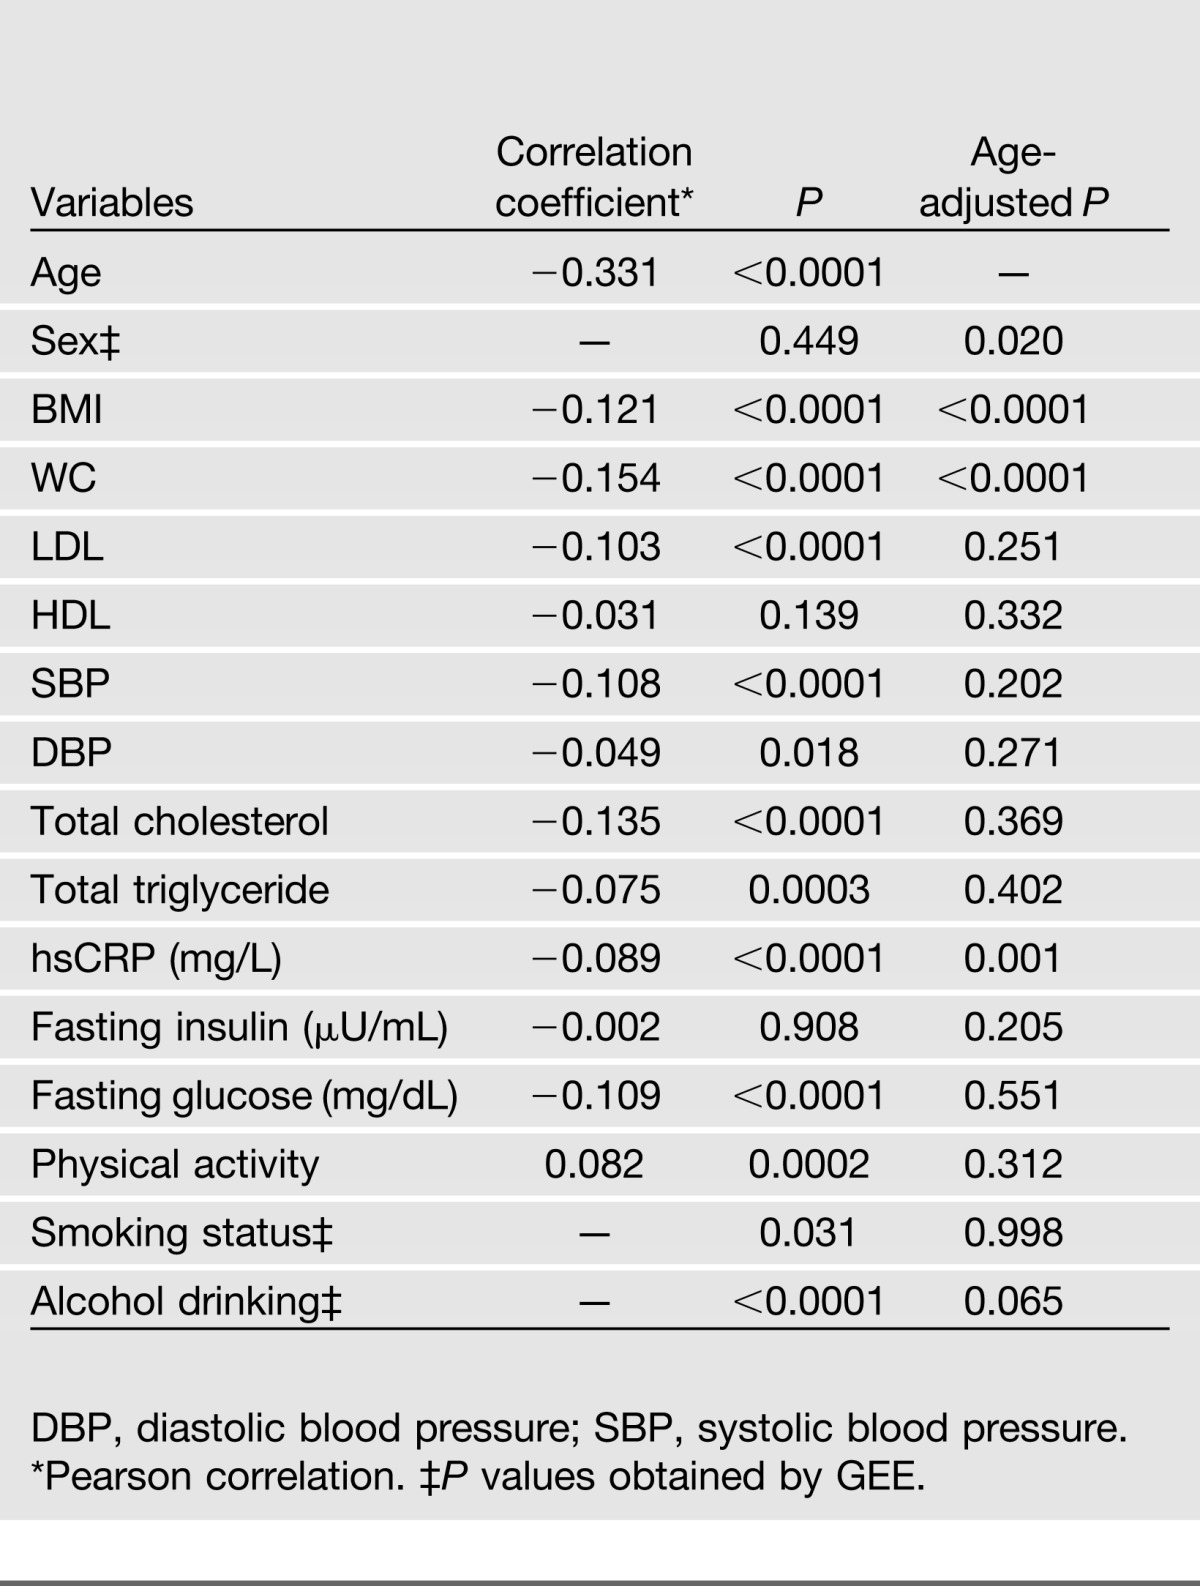
Table 3 presents the clinical correlates of LTL among 2,328 subjects participating in both clinical visits. LTL was inversely correlated with age, BMI, WC, LDL, blood pressure, total cholesterol, total triglyceride, fasting glucose, and hsCRP and positively correlated with level of physical activity, but LTL was not correlated with HDL or fasting insulin. Apart from BMI, WC, and hsCRP, most of these correlations substantially attenuated after adjusting for age. Women appeared to have longer LTL than men (1.012 vs. 1.005, age-adjusted P = 0.02) in the entire sample, but this sex difference disappeared among participants who developed diabetes during follow-up (age-adjusted P = 0.49), probably due to the small number of participants who developed incident diabetes. LTL did not differ in terms of the status for cigarette smoking and alcohol drinking.
Table 3.
Clinical correlates of LTL among 2,328 participants who attended both SHFS clinical visits
Prospective Association of LTL With Incident Diabetes
Proportional hazards assumptions are met for telomere length and all other variables. Among 2,328 initially nondiabetic participants who attended both clinical examinations, 292 developed T2D at the end of follow-up. Participants who developed diabetes exhibited significantly shorter LTL at baseline compared with those remaining free of the disease (mean T/S ratio 0.96 vs. 1.02, age-adjusted P value = 0.007). Except for LTL, sex, age, BMI, fasting glucose, and plasma triglyceride at baseline were selected to be significant predictors of diabetes risk based on the Bayesian information criterion.
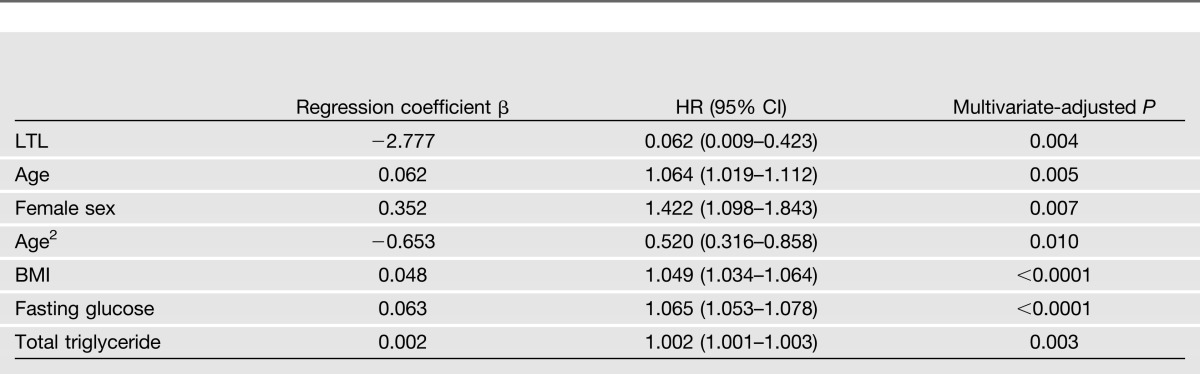
Cox spline regression using LTL as a continuous variable showed that longer LTL was significantly associated with reduced risk of diabetes (β = −2.78; hazard ratio [HR] 0.06 [95% CI 0.01–0.42], multivariate-adjusted P = 0.004) after adjustment for sex, age, BMI, fasting glucose, and plasma triglyceride at baseline. Results of multivariate Cox spline regression using LTL as a continuous variable are shown in Table 4.
Table 4.
Multivariate Cox spline regression for telomere length (continuous) and diabetes risk among 2,328 American Indians participating in both clinical visits of the SHFS
Results of Cox regression according to LTL quartiles demonstrate that subjects in the lowest quartile of LTL (shortest) had an almost twofold increased risk of developing diabetes compared with those in the highest (longest) LTL quartile (HR 1.83 [95% CI 1.26–2.66], multivariate-adjusted P < 0.0001). However, subjects in the second (HR 0.87 [95% CI 0.59–1.29]) and the third (HR 0.95 [95% CI 0.65–1.38]) quartiles did not show significantly elevated risk for diabetes in comparison with those in the fourth quartile, suggesting that subjects in the higher LTL quartiles (quartiles 2–4) had similar survival probabilities. As such, we combined subjects in the second, third, and fourth quartiles into one group and compared them with those in the first quartile, which showed that subjects in the lowest quartile of LTL are almost twice as likely to develop diabetes as those in higher quartiles [HR 1.98 (95% CI 1.51–2.60), quartile 1 vs. (quartiles 2 + 3 + 4)]. Similar results were observed when LTL was categorized into tertiles [HR 1.57 (95% CI 1.21–2.05), tertile 1 vs. (tertiles 2 + 3)]. Multivariate-adjusted HRs and corresponding 95% CIs according to LTL quartiles are shown in Table 5. Kaplan-Meier survival curves are plotted in Figure 1.
Table 5.
Multivariate-adjusted HR (95% CI) for diabetes risk according to LTL quartiles among 2,328 American Indians participating in both clinical visits of the SHFS
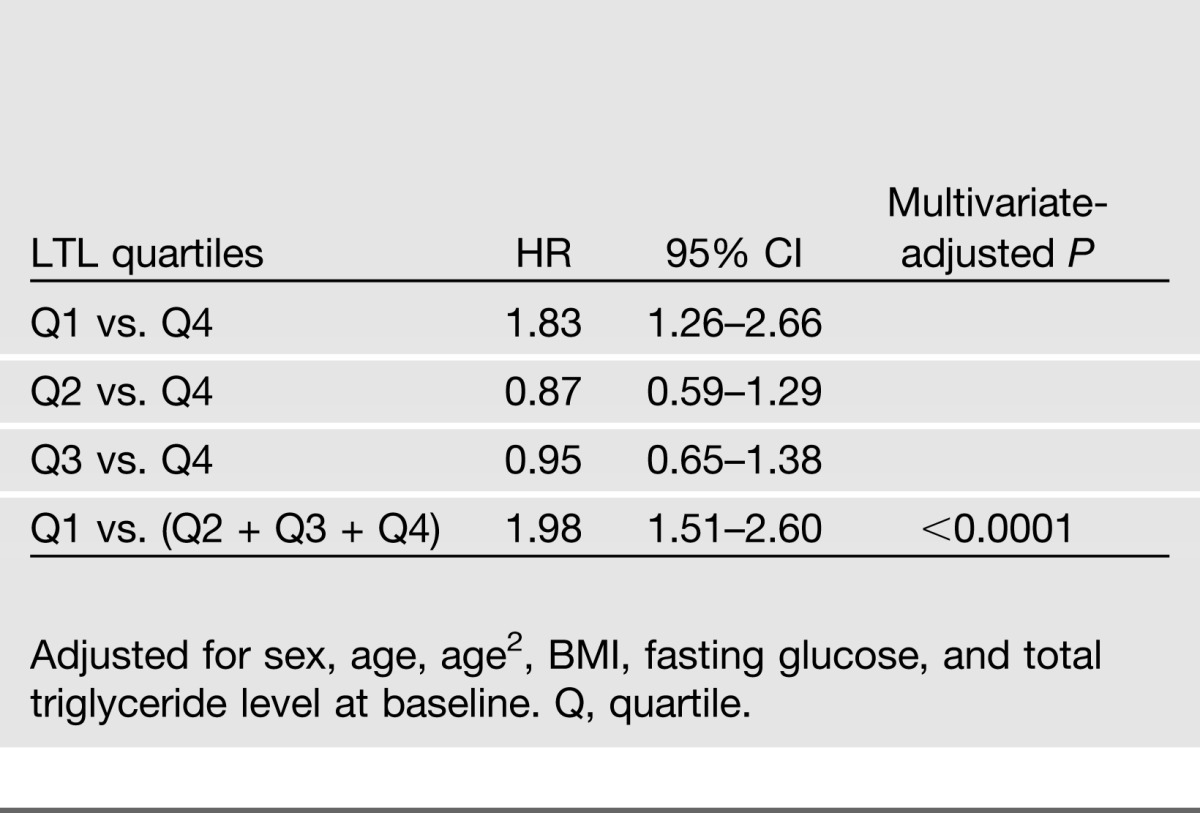
Figure 1.

Kaplan-Meier plots for survival function of diabetes in American Indians, stratified by quartiles of LTL (T/S ratio). Quartile 1, 0.2780–0.8706; quartile 2, 0.8706–1.0059; quartile 3, 1.0059–1.1431; quartile 4, 1.1431–2.2173.
Results of Sensitivity Analyses
To assess the robustness of our findings, we conducted a series of sensitivity analyses; these showed that removing outliers of LTL did not affect our results (Supplementary Table 4), suggesting that the observed association between LTL and diabetes risk is unlikely to be driven by outliers. Secondary analysis in postmenopausal women (N = 281) indicated that shorter LTL remained a significant predictor of diabetes risk (Supplementary Table 5). Additional adjustment for diabetes treatment did not affect our results.
Discussion
In a large, family-based longitudinal cohort of American Indians, LTL significantly predicted the onset of future T2D. During an average 5.5 years of follow-up, subjects in the lowest quartile were almost twice as likely to develop diabetes as those in the highest quartile. Participants who developed diabetes exhibited significantly shorter LTL at baseline compared with those remaining free of the disease, suggesting that shorter LTL may be not the result of diabetes but, rather, an early risk factor that predisposes to disease manifestation later in life. This corroborates the research findings of previous work in this field (31,32) and supports a potential causal or contributory role of LTL in the development of diabetes in American Indians. The prognostic significance of LTL in diabetes development was independent of known diabetes risk factors, suggesting that it may influence diabetes risk through biological pathways beyond established risk factors.
Shorter LTL has been an important characteristic of T2D in cross-sectional studies (3,8,33–36). However, none of these analyses have been able to conclusively distinguish causal from consequential telomere attrition. To date, longitudinal studies examining the causal relationship between LTL and development of diabetes are scarce. A recent study in postmenopausal women participating in the WHI study (11) found a modest association between LTL and diabetes risk, but this association was substantially attenuated after adjustment for known risk factors. The authors postulated that the lack of an independent association between LTL and diabetes risk may be due to the relatively short period of follow-up (6 years). This explanation, however, seems inconsistent with our study, which has a similar—even shorter—follow-up period (average 5.5 years). Several possible mechanisms may underlie the discrepant results between WHI and our study. First, based on a previous report, it is probable that menopause may alter the trajectory of telomere attrition and thus could possibly offset the relationship between telomere length and diabetes as well as indices that accompany diabetes (e.g., inflammation) (37). But this seems unlikely because in our study the effect of telomere shortening on diabetes risk remains significant in postmenopausal women. Second, genetic factors may contribute, at least in part, to the inconsistent findings between WHI and the current study. LTL has been shown to be highly heritable, with heritability estimates ranging from 36 to 84% (38–41). American Indians may have different genetic background from other ethnicities, which could result in a differential effect of telomere shortening on disease risk. Third, our study participants are ~20 years younger (mean age ∼40 years old) than subjects participating in the WHI study (mean age ∼62 years old). The questions of whether and how this age difference affects the relationship between LTL and diabetes risk warrant further investigation. Moreover, random measurement error of telomere length could also mask an association between telomere attrition and disease risk. In addition, the nonuniform results may also be partially explained by the not entirely similar characteristics of the studied populations in the two studies. It is also probable that the different findings between WHI and our study could be attributable to other as yet unknown mechanisms.
Compared with participants in the fourth quartile of LTL, subjects in the first quartile had significantly increased risk of incident diabetes, but those in the second and third quartiles showed no significant difference in survival probability, indicating a nonlinear relationship of LTL with diabetes risk in American Indians. This observation corroborates previous studies demonstrating a nonlinear association of telomere length with cancer (24), incident coronary heart disease (25), and severe aplastic anemia (26). The nonlinear relationship between LTL and diabetes risk suggests a potential threshold effect of telomeric aging on disease risk, providing support for the Hayflick limit hypothesis of telomeres (1).
In our study, there appears to be a critical threshold value for LTL between the first and the second telomere quartiles, across which diabetes risk will increase significantly. Study participants appear to form two distinct groups (quartile 1 vs. quartiles 2–4), and risk of diabetes differs significantly between groups, but subjects within the same group share similar survival probability. Therefore, comparison of the first LTL quartile with other quartiles (Q2–Q4) exhibited significant difference in diabetes risk, but comparisons within the higher quartiles (Q2–Q4) showed no significant results. This observation is consistent with the threshold hypothesis of telomere length (i.e., the Hayflick limit), beyond which replicative senescence is triggered, and a cascade of negative biological processes, such as loss of telomere capping activity, chromosomal instability, and apoptosis, will occur, thereby contributing to diseases.
Inflammation and oxidative stress have been postulated as important contributors to biological aging and diabetes (42). Risk factors associated with these two processes may affect the relationship between telomeres and diabetes. Apart from LTL and age, the current study also identified several T2D predictors, such as BMI, fasting glucose, and total triglyceride. The precise biological mechanisms that are responsible for such effects remain to be determined. It is possible that these unfavorable factors could promote inflammation, oxidative stress, and insulin resistance by provoking age-dependent telomere shortening, thereby contributing to increased risk of diabetes. In our analysis, most of the associations between traditional diabetes risk factors and LTL substantially attenuated after adjustment for age, providing support that telomeric aging may be a harbinger of diabetes. Our findings highlight enhanced biological aging among American Indians, which appear to be tracked by changes in BMI and elevated levels of fasting glucose and triglyceride, suggesting that these factors may also contribute to premature aging and subsequent diabetes risk.
Several previous studies reported sex difference in LTL among diabetic patients. In this study, women exhibited longer LTL than men in the entire cohort, but there was no sex difference among participants who developed diabetes, probably due to the small number of cases of incident diabetes. We identified a marginal difference in LTL between never and ever smokers (1.02 vs. 1.00, P = 0.05), supporting the pro-aging effect of cigarette smoking reported in a previous study (43).
Our study has several limitations. First, we measured LTL using a PCR-based assay that does not quantify absolute telomere length; hence, we were unable to examine the differences in absolute telomere length. Although the %CV of telomere length is relatively low in our study, random measurement error still exists, and this may result in an inability to capture differences in LTL between subsets of our study participants. Second, telomere lengths exhibit a wide range of interindividual variation, and they also vary among cells in the same tissue and among chromosomes in the same cell (44). In this study, we only measured telomere length in blood leukocytes—not the target organs of diabetes such as pancreas, skeleton muscle, and liver. However, existing studies have demonstrated that telomere length in different tissues may be highly correlated (45). Moreover, the current study does not explain the mechanisms responsible for linking the shortened telomere length to the development of diabetes. Third, our findings were derived from a cohort of American Indians who suffer from a disproportionately higher rate of diabetes. As such, the observed association of LTL with diabetes risk might be suggestive rather than definitive. Generalization to other populations with low prevalence of diabetes should be approached cautiously. Finally, the prospective association of LTL with diabetes risk identified in our study may not necessarily mean causality because baseline factors influencing diabetes, either unmeasured or improperly measured, may influence this apparently causal relationship.
In summary, this study demonstrates that shorter LTL significantly and independently predicts increased risk of future diabetes among American Indians participating in the SHFS, suggesting that LTL may serve as a prognostic biomarker of diabetes in American Indians. Though our findings are derived in a single ethnic group and confirmation in other ethnic origins and different environment are necessary, the discovery of LTL as a prognostic determinant, independent of known diabetes risk factors, may improve our ability to predict disease risk and may lead to a better understanding of the mechanisms underlying the association between biological aging and diabetes as well as a wide range of metabolic disorders.
Article Information
Acknowledgments. The authors thank the Strong Heart Study participants, Indian Health Service facilities, and participating tribal communities for their extraordinary cooperation and involvement, which has contributed to the success of the Strong Heart Study.
Funding. This study was supported by National Institutes of Health grants R01DK091369, K01AG034259, and R21HL092363 and cooperative agreement grants U01HL65520, U01HL41642, U01HL41652, U01HL41654, and U01HL65521.
Duality of Interest. No potential conflicts of interest relevant to this article were reported.
Author Contributions. J.Z. conceived the study, conducted the statistical analyses, and wrote the manuscript. Y. Zhu contributed to statistical analyses. J.L. and T.M. performed telomere assays and contributed to drafting the manuscript. E.B., Y. Zhang, S.A.C., L.G.B., E.T.L., and B.V.H. contributed to discussion and reviewed and edited the manuscript. J.Z. is the guarantor of this work and, as such, had full access to all the data in the study and takes responsibility for the integrity of the data and the accuracy of the data analysis.
Footnotes
This article contains Supplementary Data online at http://diabetes.diabetesjournals.org/lookup/suppl/doi:10.2337/db13-0744/-/DC1.
The views expressed in this article are those of the authors and do not necessarily reflect those of the Indian Health Service.
See accompanying commentary, p. 65.
References
- 1.Hayflick L. The limited in vitro lifetime of human diploid cell strains. Exp Cell Res 1965;37:614–636 [DOI] [PubMed] [Google Scholar]
- 2.Salpea KD, Talmud PJ, Cooper JA, et al. Association of telomere length with type 2 diabetes, oxidative stress and UCP2 gene variation. Atherosclerosis 2010;209:42–50 [DOI] [PMC free article] [PubMed] [Google Scholar]
- 3.Adaikalakoteswari A, Balasubramanyam M, Mohan V. Telomere shortening occurs in Asian Indian Type 2 diabetic patients. Diabet Med 2005;22:1151–1156 [DOI] [PubMed] [Google Scholar]
- 4.Zee RY, Castonguay AJ, Barton NS, Germer S, Martin M. Mean leukocyte telomere length shortening and type 2 diabetes mellitus: a case-control study. Transl Res 2010;155:166–169 [DOI] [PubMed] [Google Scholar]
- 5.Buxton JL, Walters RG, Visvikis-Siest S, Meyre D, Froguel P, Blakemore AI. Childhood obesity is associated with shorter leukocyte telomere length. J Clin Endocrinol Metab 2011;96:1500–1505 [DOI] [PMC free article] [PubMed] [Google Scholar]
- 6.Moreno-Navarrete JM, Ortega F, Sabater M, Ricart W, Fernández-Real JM. Telomere length of subcutaneous adipose tissue cells is shorter in obese and formerly obese subjects. Int J Obes (Lond) 2010;34:1345–1348 [DOI] [PubMed] [Google Scholar]
- 7.Gardner JP, Li S, Srinivasan SR, et al. Rise in insulin resistance is associated with escalated telomere attrition. Circulation 2005;111:2171–2177 [DOI] [PubMed] [Google Scholar]
- 8.Adaikalakoteswari A, Balasubramanyam M, Ravikumar R, Deepa R, Mohan V. Association of telomere shortening with impaired glucose tolerance and diabetic macroangiopathy. Atherosclerosis 2007;195:83–89 [DOI] [PubMed] [Google Scholar]
- 9.O’Donnell CJ, Demissie S, Kimura M, et al. Leukocyte telomere length and carotid artery intimal medial thickness: the Framingham Heart Study. Arterioscler Thromb Vasc Biol 2008;28:1165–1171 [DOI] [PMC free article] [PubMed] [Google Scholar]
- 10.Salpea KD, Humphries SE. Telomere length in atherosclerosis and diabetes. Atherosclerosis 2010;209:35–38 [DOI] [PMC free article] [PubMed] [Google Scholar]
- 11.You NC, Chen BH, Song Y, et al. A prospective study of leukocyte telomere length and risk of type 2 diabetes in postmenopausal women. Diabetes 2012;61:2998–3004 [DOI] [PMC free article] [PubMed] [Google Scholar]
- 12.North KE, Howard BV, Welty TK, et al. Genetic and environmental contributions to cardiovascular disease risk in American Indians: the Strong Heart Family Study. Am J Epidemiol 2003;157:303–314 [DOI] [PubMed] [Google Scholar]
- 13.Lee ET, Welty TK, Fabsitz R, et al. The Strong Heart Study. A study of cardiovascular disease in American Indians: design and methods. Am J Epidemiol 1990;132:1141–1155 [DOI] [PubMed] [Google Scholar]
- 14.The Expert Committee on the Diagnosis and Classification of Diabetes Mellitus Report of the Expert Committee on the Diagnosis and Classification of Diabetes Mellitus. Diabetes Care 2002;25(Suppl. 1):s5–s20 [DOI] [PubMed] [Google Scholar]
- 15.Howard BV, Lee ET, Cowan LD, et al. Rising tide of cardiovascular disease in American Indians. The Strong Heart Study. Circulation 1999;99:2389–2395 [DOI] [PubMed] [Google Scholar]
- 16.Lee ET, Cowan LD, Welty TK, et al. All-cause mortality and cardiovascular disease mortality in three American Indian populations, aged 45-74 years, 1984-1988. The Strong Heart Study. Am J Epidemiol 1998;147:995–1008 [DOI] [PubMed] [Google Scholar]
- 17.Kizer JR, Bella JN, Palmieri V, et al. Left atrial diameter as an independent predictor of first clinical cardiovascular events in middle-aged and elderly adults: the Strong Heart Study (SHS). Am Heart J 2006;151:412–418 [DOI] [PubMed] [Google Scholar]
- 18.Clauss A. Rapid physiological coagulation method in determination of fibrinogen. Acta Haematol 1957;17:237–246 [in German] [DOI] [PubMed] [Google Scholar]
- 19.Expert Panel on the Identification, Evaluation, and Treatment of Overweight in Adults. Clinical guidelines on the identification, evaluation, and treatment of overweight and obesity in adults: executive summary. Am J Clin Nutr 1998;68:899–917 [DOI] [PubMed] [Google Scholar]
- 20.Willett W. Food frequency methods. In Nutritional Epidemiology. New York, Oxford University Press, 1998, p. 74–91 [Google Scholar]
- 21.Cawthon RM. Telomere measurement by quantitative PCR. Nucleic Acids Res 2002;30:e47. [DOI] [PMC free article] [PubMed] [Google Scholar]
- 22.Lin J, Epel E, Cheon J, et al. Analyses and comparisons of telomerase activity and telomere length in human T and B cells: insights for epidemiology of telomere maintenance. J Immunol Methods 2010;352:71–80 [DOI] [PMC free article] [PubMed] [Google Scholar]
- 23.Heinzl H, Kaider A. Gaining more flexibility in Cox proportional hazards regression models with cubic spline functions. Comput Methods Programs Biomed 1997;54:201–208 [DOI] [PubMed] [Google Scholar]
- 24.Cui Y, Cai Q, Qu S, et al. Association of leukocyte telomere length with colorectal cancer risk: nested case-control findings from the Shanghai Women’s Health Study. Cancer Epidemiol Biomarkers Prev 2012;21:1807–1813 [DOI] [PMC free article] [PubMed] [Google Scholar]
- 25.Ye S, Shaffer JA, Kang MS, et al. Relation between leukocyte telomere length and incident coronary heart disease events (from the 1995 Canadian Nova Scotia Health Survey). Am J Cardiol 2013;111:962–967 [DOI] [PMC free article] [PubMed] [Google Scholar]
- 26.Scheinberg P, Cooper JN, Sloand EM, Wu CO, Calado RT, Young NS. Association of telomere length of peripheral blood leukocytes with hematopoietic relapse, malignant transformation, and survival in severe aplastic anemia. JAMA 2010;304:1358–1364 [DOI] [PMC free article] [PubMed] [Google Scholar]
- 27.Wilson PW, Meigs JB, Sullivan L, Fox CS, Nathan DM, D’Agostino RB., Sr Prediction of incident diabetes mellitus in middle-aged adults: the Framingham Offspring Study. Arch Intern Med 2007;167:1068–1074 [DOI] [PubMed] [Google Scholar]
- 28.Pan W. Extending the iterative convex minorant to the Cox model for interval censored data. J Comput Graph Stat 1999;8:109–120 [Google Scholar]
- 29.Zhang Y, Howard BV, Cowan LD, et al. The effect of estrogen use on levels of glucose and insulin and the risk of type 2 diabetes in American Indian postmenopausal women : the Strong Heart Study. Diabetes Care 2002;25:500–504 [DOI] [PubMed] [Google Scholar]
- 30.Cowan LD, Go OT, Howard BV, et al. Parity, postmenopausal estrogen use, and cardiovascular disease risk factors in American Indian women: the Strong Heart Study. J Womens Health 1997;6:441–449 [DOI] [PubMed] [Google Scholar]
- 31.Benetos A, Kark JD, Susser E, et al. Tracking and fixed ranking of leukocyte telomere length across the adult life course. Aging Cell 2013;12:615–621 [DOI] [PMC free article] [PubMed] [Google Scholar]
- 32.Daniali L, Benetos A, Susser E, et al. Telomeres shorten at equivalent rates in somatic tissues of adults. Nat Commun 2013;4:1597. [DOI] [PMC free article] [PubMed] [Google Scholar]
- 33.Sampson MJ, Winterbone MS, Hughes JC, Dozio N, Hughes DA. Monocyte telomere shortening and oxidative DNA damage in type 2 diabetes. Diabetes Care 2006;29:283–289 [DOI] [PubMed] [Google Scholar]
- 34.Fitzpatrick AL, Kronmal RA, Gardner JP, et al. Leukocyte telomere length and cardiovascular disease in the cardiovascular health study. Am J Epidemiol 2007;165:14–21 [DOI] [PubMed] [Google Scholar]
- 35.Shen Q, Zhao X, Yu L, et al. Association of leukocyte telomere length with type 2 diabetes in mainland Chinese populations. J Clin Endocrinol Metab 2012;97:1371–1374 [DOI] [PubMed] [Google Scholar]
- 36.Monickaraj F, Aravind S, Gokulakrishnan K, et al. Accelerated aging as evidenced by increased telomere shortening and mitochondrial DNA depletion in patients with type 2 diabetes. Mol Cell Biochem 2012;365:343–350 [DOI] [PubMed] [Google Scholar]
- 37.Aviv A, Valdes A, Gardner JP, Swaminathan R, Kimura M, Spector TD. Menopause modifies the association of leukocyte telomere length with insulin resistance and inflammation. J Clin Endocrinol Metab 2006;91:635–640 [DOI] [PubMed] [Google Scholar]
- 38.Slagboom PE, Droog S, Boomsma DI. Genetic determination of telomere size in humans: a twin study of three age groups. Am J Hum Genet 1994;55:876–882 [PMC free article] [PubMed] [Google Scholar]
- 39.Andrew T, Aviv A, Falchi M, et al. Mapping genetic loci that determine leukocyte telomere length in a large sample of unselected female sibling pairs. Am J Hum Genet 2006;78:480–486 [DOI] [PMC free article] [PubMed] [Google Scholar]
- 40.Vasa-Nicotera M, Brouilette S, Mangino M, et al. Mapping of a major locus that determines telomere length in humans. Am J Hum Genet 2005;76:147–151 [DOI] [PMC free article] [PubMed] [Google Scholar]
- 41.Atzmon G, Cho M, Cawthon RM, et al. Evolution in health and medicine Sackler colloquium: genetic variation in human telomerase is associated with telomere length in Ashkenazi centenarians. Proc Natl Acad Sci USA 2010;107(Suppl. 1):1710–1717 [DOI] [PMC free article] [PubMed] [Google Scholar]
- 42.Licastro F, Candore G, Lio D, et al. Innate immunity and inflammation in ageing: a key for understanding age-related diseases. Immun Ageing 2005;2:8. [DOI] [PMC free article] [PubMed] [Google Scholar]
- 43.Valdes AM, Andrew T, Gardner JP, et al. Obesity, cigarette smoking, and telomere length in women. Lancet 2005;366:662–664 [DOI] [PubMed] [Google Scholar]
- 44.Blackburn EH. The end of the (DNA) line. Nat Struct Biol 2000;7:847–850 [DOI] [PubMed] [Google Scholar]
- 45.Gadalla SM, Cawthon R, Giri N, Alter BP, Savage SA. Telomere length in blood, buccal cells, and fibroblasts from patients with inherited bone marrow failure syndromes. Aging (Albany, NY Online) 2010;2:867–874 [DOI] [PMC free article] [PubMed] [Google Scholar]