

This article highlights the significant breakthroughs made in understanding the critical genetic alterations and signaling pathways underlying the pathogenesis of renal cell carcinoma.
Keywords: Renal cell carcinoma, Prognostic factors, Biology, Diagnosis
Abstract
In the past 15 years, there has been an increased understanding of the tumor biology of renal cell carcinoma (RCC). The identification of vascular endothelial growth factor (VEGF), its related receptor (VEGFR), and the mammalian target of rapamycin as dysregulated signaling pathways in the development and progression of RCC has resulted in the rational development of pharmaceutical agents capable of specifically targeting key steps in these pathways. Clinical trials have demonstrated survival benefit with these agents, particularly in clear cell RCC patients. However, metastatic RCC will progress in all patients, resulting in a critical need to determine patient risk and optimize treatment. The goal of this article is to highlight the significant breakthroughs made in understanding the critical genetic alterations and signaling pathways underlying the pathogenesis of RCC. The discovery of prognostic factors and development of comprehensive nomograms to stratify patient risk and predictive biomarkers to facilitate individualized treatment selection and predict patient response to therapy also are reviewed.
Introduction
Renal cell carcinoma (RCC) accounts for approximately 3% of all cancer diagnoses in the U.S. each year [1]. In the U.S. in 2010, 58,000 individuals were diagnosed with RCC and approximately 13,000 died [1]. Despite these sobering statistics, significant progress has been made in our understanding of the tumor biology of RCC in the past 15 years. What was once historically thought of as a single disease entity is now correctly recognized as a group of heterogeneous malignancies with distinct genetic abnormalities and natural histories. Five major subtypes are currently recognized: clear cell, papillary (type I and type II), chromophobe, collecting duct, and unclassified RCC (Table 1) [2]. This classification was made possible by advances in genetics and molecular biology that have provided insight into the alterations underlying these renal cortical tumor types and the subsequent downstream molecular pathways involved in their tumorigenesis. The goals of this review article are to highlight the major genetic alterations underlying our current understanding of these renal cortical tumors, the crucial biological pathways that become altered in the various RCC subtypes, prognostic factors, and how an understanding of these molecular pathways has permitted the rational development of pharmaceutical agents capable of specifically targeting key steps in these pathways.
Table 1.
Current classification of renal cell tumors and frequency in a surgical series of 1,600 consecutive patients with renal cell tumors at University of California–Los Angeles [2]

Tumor Biology of RCC
Much of our current knowledge of the underlying genetics and molecular biology of sporadic RCC is based on the seminal work of Linehan [3] through the study of familial kidney cancer and von Hippel Lindau (VHL) disease. Subsequently, the corresponding genetic and molecular alterations in seven autosomal dominant familial syndromes were identified, providing the basis for non–clear cell tumor biology [4].
Clear Cell RCC and the Hypoxia-Inducible Pathway
Linkage analysis of VHL-associated clear cell tumors in 1993 led to the identification of loss of the short arm of chromosome 3 and the VHL gene [5, 6]. The VHL gene mutation was then found in sporadic RCC cases [7]; indeed, approximately 60%–80% of sporadic RCC cases harbor a mutated VHL gene [8]. Multiple mutations have been described resulting in inactivation, including intragenic mutations, deletions, and splicing aberrations [4]. The VHL gene is a tumor-suppressor gene that encodes the VHL protein, which is one component of the E3 ubiquitin–ligase complex, along with elongin B, elongin C, and cullin 2 [4, 9, 10]. In its normal functional state and under normoxic conditions, the VHL complex targets hypoxia-inducible transcription factors (e.g., HIF-α, HIF-2α) for ubiquitin-mediated proteolysis by hydroxylation (Fig. 1) [11]. Because HIF regulates a host of important downstream targets (hypoxia-inducible genes), such as vascular endothelial growth factor (VEGF), epidermal growth factor, transforming growth factor α, platelet-derived growth factor (PDGF), erythropoietin, and glucose transporter 1, it plays a crucial role in tumor angiogenesis [4]. Under hypoxic conditions, unhydroxylated HIF is upregulated and skirts degradation by the VHL complex. However, if the VHL complex is defective as a result of genetic mutation, the same result occurs—HIF accumulates, translocates to the nucleus, and leads to transcription of angiogenic factors and tumorigenesis [4]. RCC tends to be a highly vascular tumor with high expression of VEGF, VEGF receptor (VEGFR), PDGF receptor, and basic fibroblast growth factor (bFGF) [8].
Figure 1.
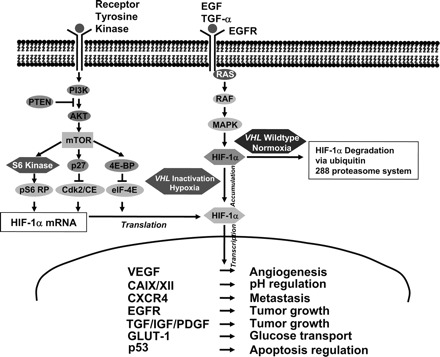
Important pathways involved in renal cell carcinoma biology and tumorigenesis [11].
Abbreviations: 4e-BP1, 4E binding protein 1; CAIX, carbonic anhydrase IX; EGF, epidermal growth factor; EGFR, EGF receptor; GLUT-1, glucose transporter 1; HIF, hypoxia-inducible factor; IGF, insulin-like growth factor; MAPK, mitogen-activated protein kinase; mTOR, mammalian target of rapamycin; PDGF, platelet-derived growth factor; PI3K, phosphatidylinositol-3-kinase; PTEN, phosphatase and tensin homologue deleted on chromosome ten; TGF-α, transforming growth factor α; VEGF, vascular endothelial growth factor; VHL, von Hippel Lindau.
Reprinted from Klatte T, Pantuck AJ. Molecular biology of renal cortical tumors. Urol Clin North Am 2008;35:573–580, copyright 2010, with permission from Elsevier.
Non–Clear Cell RCC
Papillary RCC and the Mesenchymal–Epithelial Transition Pathway
Hereditary papillary RCC (HPRC) syndrome results in bilateral, multifocal papillary type 1 tumors [4]. Linkage analysis in the late 1990s resulted in the identification of the gene responsible for HPRC, the proto-oncogene mesenchymal–epithelial transition factor (MET) [12, 13]. The MET gene encodes a tyrosine kinase membrane receptor (the MET receptor). The MET gene and that of its ligand, hepatocyte growth factor (HGF), are both located on chromosome 7. Approximately 75% of sporadic papillary RCC cases are associated with trisomy 7 [14]. When HGF binds to the MET receptor, a signaling cascade occurs, resulting in multiple events. With a gain-of-function mutation, the receptor is constitutively activated, resulting in a dysregulated tumorigenic state. Of note, hypoxic conditions upregulate MET along with VEGF, promoting angiogenesis [15]. Multiple tyrosine kinase inhibitors (TKIs) with activity against MET pathways exist and anti-HGF monoclonal antibodies currently are in clinical trials [4].
Fumarate Hydratase Gene and Hereditary Leiomyomatosis RCC
Individuals with hereditary leiomyomatosis RCC have been found to have mutations in the fumarate hydratase (FH) gene, located on the long arm of chromosome 1 [4]. FH is a tumor suppressor gene that encodes a Krebs cycle enzyme. Mutation of the gene results in derangement of mitochondrial conversion of fumarate to malate in the tricarboxylic acid cycle, leading to overaccumulation of fumarate, hypoxia, and upregulation of HIF [16]; patients characteristically develop papillary type II RCC. Clearly, the link between this disease process and HIF regulation suggests a potential role for anti-VEGF or VEGFR TKI therapy.
Birt-Hogg-Dubé Syndrome
Renal tumors in Birt-Hogg-Dubé (BHD) syndrome can have variable histology, including oncocytic-chromophobe hybrid, pure chromophobe, clear cell, and oncocytoma. BHD syndrome is caused by loss-of-function mutations in the folliculin gene (FLCN) (BHD gene) [3]. The FLCN gene is a tumor suppressor gene located on 17p11.2 that encodes for the protein folliculin [4, 17]. Folliculin is a 64 kDa protein whose function is incompletely understood. Inactivation of the FLCN gene results in the development of polycystic kidneys and renal tumors in mouse models, and inactivating mutations have been identified in BHD-associated RCC, confirming the tumor suppressor function of the gene [18, 19]. There are some indirect data suggesting an interaction between folliculin and adenosine monophosphate-activated protein kinase of the mammalian target of rapamycin (mTOR) complex 1 (mTORC1) via an interaction with two novel proteins called folliculin-interacting protein 1 and folliculin-interacting protein 2 [18, 20]. Based on its position in this pathway, folliculin could hold a nutrient-/energy-sensing role [19]. In several other studies, loss of FLCN function was associated with mTORC1 and phosphorylated ribosomal protein S6 (pS6) activity during renal cystogenesis and tumorigenesis [19, 21, 22]. Based on the sum of these data, mTOR inhibitors may represent a rational therapeutic approach in this disease process.
Phosphatidylinositol-3-Kinase/Akt Pathway
The phosphatidylinositol-3-kinase (PI3K)/Akt pathway has been associated with oncogenesis in a variety of malignancies [23]. PI3Ks are a family of lipid kinases that phosphorylate the inositol ring 3′-OH group of inositol phospholipids (PIPs) [24]. In response to extracellular growth factor activation of tyrosine kinases, PI3K activation occurs (Fig. 1); PIP phosphorylation leads to activation of several proteins including the serine/threonine kinase Akt/protein kinase B (PKB) [25]. PIP can be dephosphorylated by tumor suppressor phosphatase and tensin homolog deleted on chromosome 10 [26]. Akt/PKB is involved in the regulation of different cellular processes relating to cell survival and cell cycle regulation; several notable targets include mTOR, glycogen synthase kinase 3, p21, p27, insulin receptor substrate 1, and Raf-1 [27]. One mediator of Akt–mTOR interaction is the tuberous sclerosis heterodimer protein complex TSC1/2, which acts to suppress mTOR activity.
mTOR Pathway
The mTOR protein is an intracellular serine/threonine kinase involved in regulation of cell growth, proliferation, survival, and metabolism [28, 29]. Because of its key involvement in these pathways that couple growth stimuli to cell cycle progression, mTOR is critically involved in carcinogenesis [30]. As evidenced by its role in numerous cell processes, it is situated at a convergence point of multiple pathways (Fig. 1) [29]. mTOR inhabits two separate complexes, mTORC1, consisting of mTOR, regulatory associated protein of TOR, and GβL (mLST8), and mTORC2, composed of rapamycin-insensitive companion of TOR, GβL, and SAPL interacting protein 1 [29, 31]. Various growth factors, nutrients, hormones, and mitogens stimulate mTOR, resulting in protein synthesis, degradation, or angiogenesis [27]. Key downstream effectors of mTORC1 are the ribosomal S6 kinase and the eukaryotic translation initiation factor 4E binding protein 1 [32]. mTOR serves as a therapeutic target in RCC for a number of reasons. mTORC1 is involved in the regulation of oncogenic proteins such as HIF-1α, VEGF, FGFs, cyclin D1, and c-Myc. For example, one consequence of inactivation of the mTOR pathway is an increase in HIF-1 gene expression [27]. mTORC2, on the other hand, is important for cell survival.
Histologic Subtype Subpopulations
Although we traditionally have organized RCC into clear cell tumors and non–clear cell subtypes, emerging data gleaned from advances in our understanding of the molecular biology of each of these entities have enabled subclassification based on molecular features. Gordan et al. [33] recently identified distinct populations of clear cell RCC phenotypes: wild-type VHL, which did not widely express HIF-1 or HIF-2; VHL mutated or hypermethylated tumors, which were subdivided into HIF-1/HIF-2 expressing; and HIF-2–expressing tumors. Further study of these subpopulations of tumors is warranted.
Discovery of New and More Effective Treatments
Metastatic RCC (mRCC) historically has been insensitive to chemotherapy and hormonal therapy. For decades, the only treatments that showed some biologic activity in RCC were nonspecific immune-based therapies and cytotoxic chemotherapeutic agents.
With elucidation of the molecular pathways involved in RCC pathogenesis, biologic rationale has guided the selection of key therapeutic targets such as VEGF and the mTOR pathway. The currently available agents include TKIs (sorafenib, sunitinib, pazopanib, axitinib), VEGF antibodies (bevacizumab), and mTOR inhibitors (everolimus, temsirolimus). Numerous TKIs, including cediranib and erlotinib, are in various phases of testing.
Despite the rapid expansion of this new armamentarium against mRCC, immunotherapy has remained the only treatment capable of inducing durable clinical complete responses (CRs). Interferon (IFN)-α was the first cytokine that was studied in patients with mRCC, demonstrating responses in up to 26% of patients [34, 35]. Shortly thereafter, reports of CRs also were found with interleukin (IL)-2–based treatments in up to 13% of patients [36, 37]. Recent data from the “Select” trial using high-dose IL-2 reported a response rate of 28%, with a CR rate of 6% [38]. Early studies that established the immune susceptibility of RCC and heralded the “cytokine era” laid the framework for the development of novel immunotherapeutic approaches.
Recent strategies have employed tumor vaccines that stimulate the innate immune system to recognize and eliminate cells that express tumor-specific antigens. Novel strategies using genetically modified tumor cells, antigen-presenting cells, or tumor-specific peptides have been developed to increase the specificity of the response. Recent phase III clinical trials using autologous cell lysate showed a statistically significant higher 5-year progression-free survival (PFS) rate [39]. A more specific multimodal immune-based approach employed the use of dendritic cells (DCs), potent antigen-presenting cells that can be loaded with a specific tumor antigen to induce T-cell–specific cytotoxicity. The University of California–Los Angeles (UCLA) group created a fusion gene based on a highly specific RCC-associated antigen carbonic anhydrase IX (CA9 or CAIX) and GM-CSF, a cytokine that stimulates DC proliferation. The fusion gene was inserted into an adenovirus-based platform to infect DCs and allow the expression of the GM-CSF–CA9 fusion protein [40, 41]. Currently, clinical trials are under way with this innovative strategy. Other investigators recently described the use of lentiviral vector systems to target DCs. Yang et al. [42] created a construct containing a transgene for a glycoprotein called SVGmu, which targets the surface protein DC-specific intercellular adhesion molecule-3-grabbing non-integrin. This surface receptor is an ideal DC target given its capacity for binding and endocytosis of materials [43]. Vaccinia-based approaches were also recently investigated [44, 45]. Amato et al. [44] used an attenuated vaccinia virus designed to deliver the tumor antigen 5T4, an oncofetal protein expressed in most RCCs. In a phase III, randomized, double-blind study of patients with mRCC, MVA-5T4 or placebo was administered to patients in combination with standard-of-care IL-2, IFN-α, or sunitinib. Although 5T4-specific antibody responses were detected and associated with longer survival, no significant difference in terms of overall survival was appreciated between cohorts. A similar strategy was taken in a recent phase II study of a novel cancer vaccine, TG4010, which consists of a vaccinia virus expressing mucin (MUC)-1 and IL-2 [45]. Although this vaccine demonstrated definitive cellular and humoral immune responses for patients with MUC-1–expressing tumors, no survival benefit was realized. Other novel vaccines, using a variety of vectors and constructs, currently are under investigation.
Prognostication/Predicting Response to Therapy
Classic prognostic variables such as tumor–node–metastasis (TNM) stage, Fuhrman grade, and pathologic subtype have been limited in their ability to risk stratify patients for the development of metastases. As molecular techniques have evolved and high-throughput methods have been optimized, the identification of novel prognostic biomarkers has rapidly increased. Incorporation of biomarkers into standard predictive nomograms has led to better prognostication.
CAIX is a HIF-1α–regulated transmembrane protein involved in regulating intracellular and extracellular pH levels in response to hypoxic stress, which is present in 94% of clear cell RCC cases but absent in most normal tissues [46]. An immunohistochemical threshold of 85% CAIX staining stratified patients into two risk groups; low CAIX (≤85%) staining was an independent poor prognostic factor for survival for patients with mRCC (hazard ratio [HR], 3.10; p < .001).
VEGF is another biomarker that has been independently associated with survival. VEGF can undergo differential splicing into at least four different isoforms [47, 48]. Elevated serum VEGF levels have been associated with shorter survival [49, 50]. In one study, lower VEGF levels were found in patients with localized RCC than in those with locally advanced RCC or mRCC [49]; univariate analysis demonstrated that patients with a serum VEGF level >343.5 pg/ml had a significantly shorter survival time than patients with lower levels (p = .0001).
As discussed above, HIF-1α is a central regulator of angiogenesis and other protumoral events. Klatte et al. [51] recently investigated the association between tissue microarray–based HIF-1α nuclear expression and outcome to determine the prognostic value of this biomarker. HIF-1α was overexpressed across all RCC subtypes, with clear cell RCC exhibiting the highest expression. In a subsequent analysis of the clear cell group among patients with metastatic disease, a high HIF-1α expression level (>35%) was independently associated with shorter survival than a low expression level (≤35%; median survival time, 13.5 months versus 24.4 months, respectively; p = .005). Other groups have demonstrated mixed results when evaluating cytoplasmic HIF staining [52, 53]. Ku et al. [54] assessed HIF-1α and HIF-2α expression within individual tumor epithelial and sarcomatoid regions; they observed predominantly cytoplasmic HIF staining, with expression in both epithelial and sarcomatoid components (epithelial > sarcomatoid). HIF-1α and HIF-2α were not expressed in the sarcomatoid component in about 50% of clear cell RCC cases, whereas HIF-2α was overexpressed in the epithelial component in most tumors. Multivariate analysis demonstrated statistically significant higher PFS and cancer-specific survival (CSS) rates for patients with HIF-1α expression, but only for those who had tumors with sarcomatoid differentiation (PFS: HR, 0.27; p = .05. CSS: HR, 0.22; p = .029). In contrast, HIF-2α expression was not independently associated with survival. Among mRCC patients treated with IFN-α or temsirolimus, HIF-1α expression in the primary tumor was not related to the overall response rate or survival [55].
Other markers of interest include survivin, a protein expressed across all histologic RCC subtypes, which is antiapoptotic as a result of inhibition of procaspase processing and direct binding of caspases [56]. Overexpression of survivin has been linked to adverse tumor features and poor prognosis [57, 58]. B7-H1, a cell surface glycoprotein that participates in T-cell costimulation, is a another marker of interest that was independently correlated with a greater risk for RCC death [59]. Finally, an intriguing study by Bluemke et al. [60] correlated the presence of circulating tumor cells and lymph node positivity, distant metastases, and the risk for tumor-related death. Other studies evaluating the significance of circulating endothelial cells and circulating tumor enzymes are under way [61, 62].
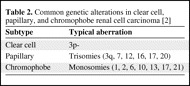
Various cytogenetic changes in RCC have been associated with prognosis (Table 2). Recently, among patients with clear cell RCC, deletions of 3p were associated with a better prognosis (p = .03) than with loss of 4p, 9p, and 14q, which were associated with a significantly poorer prognosis [63]. In papillary type 1 and type 2 tumors, poorer survival was noted with loss of 9p and 3p, whereas trisomy 17 was associated with a more favorable prognosis [64].
Table 2.
Common genetic alterations in clear cell, papillary, and chromophobe renal cell carcinoma [2]
Prognostic Schema
Several nomograms have been developed for localized and metastatic disease using factors such as histology, stage, symptoms, performance status (PS), and tumor size (Table 3) [36, 65–76]. In 2001, Yaycioglu et al. [65] developed a prognostic model independent of pathological stage. The Kattan nomogram includes histologic type, tumor size, TNM classification, and clinical presentation to estimate the probability of recurrence-free survival after 5 years of follow-up [66]. A system based on tumor stage, size, grade, and necrosis (the SSIGN score) was proposed in 2002 [67]. One of the most widely used predictive models for patients with mRCC is the Memorial Sloan-Kettering Cancer Center (MSKCC) instrument developed by Motzer et al. [68], which categorizes patients into three risk groups (favorable, intermediate, and poor) according to the number of adverse factors (e.g., time <1 year from diagnosis to initiation of systemic therapy, elevated corrected serum calcium, elevated lactate dehydrogenase [LDH] level, low hemoglobin level, and low Karnofsky PS score) [68]. Another well-known system, The UCLA Integrated Staging System (UISS) incorporates the TNM classification, Eastern Cooperative Oncology Group (ECOG) PS score, and Fuhrman grade for metastatic and non-metastatic RCC (Figs. 2 and 3) [69]. In this system, patients are categorized into three groups (low, intermediate, and high risk) to predict overall survival. The Cleveland Clinic Foundation (CCF) group sought to externally validate and expand upon the MSKCC model by evaluating a cohort of 353 patients with mRCC [70]. All the MSKCC prognostic factors were found to be independent predictors of survival with the exception of the ECOG PS score. In addition, prior radiotherapy and the presence of hepatic, lung, and retroperitoneal metastases were also identified as independent negative prognosticators. In a follow-up study by Choueiri et al. [72], the MSKCC and CCF risk group criteria were applied to a cohort of patients with mRCC who received VEGF-targeted therapy. A multivariate analysis of risk factors adversely associated with PFS identified an ECOG PS score ≥1, time from diagnosis to treatment <2 years, and corrected serum calcium level >10 mg/dl. Two additional risk factors that were identified in previous studies, high platelet count (>300 K/μl) and high absolute neutrophil count (>4.5 K/μl), also were significant. Of note, neither the MSKCC nor CCF risk scores were retained as significant predictors of PFS. Karakiewicz et al. [73] looked at traditional predictor variables in two large cohorts, one for nomogram development and internal validation (n = 2,530) and a second for external validation (n = 1,422).
Table 3.
Summary of some important nomograms

aTreated with bevacizumab, sorafenib, sunitinib, or axitinib.
Abbreviations: ALP, alkaline phosphatase; ANC, absolute neutrophil count; Ca2+ = corrected serum calcium; CAIX, carbonic anhydrase IX; ECOG PS, Eastern Cooperative Oncology Group performance status score; FNG, Fuhrman nuclear grade; Hgb, hemoglobin; KPS, Karnofsky performance status score; LDH, lactate dehydrogenase; M stage, metastasis stage; MSKCC, Memorial Sloan-Kettering Cancer Center; SSIGN, stage, size, grade, necrosis; T stage, tumor stage; TNM, tumor–node–metastasis; UISS, University of California–Los Angeles Integrated Staging System; VEGF, vascular endothelial growth factor; VEGFR, VEGF receptor.
Figure 2.
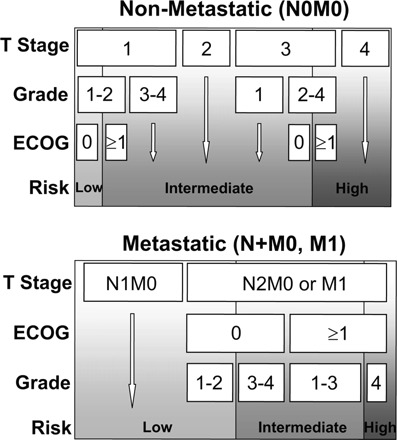
University of California Integrated Staging System [2].
Abbreviations: ECOG, Eastern Cooperative Oncology Group.
Copyright © MedReviews®, LLC. Reprinted with permission of MedReviews®, LLC. Klatte T, Pantuck AJ, Kleid MD et al. Understanding the natural biology of kidney cancer: Implications for targeted cancer therapy. Rev Urol 2007;9: 47–56. Reviews in Urology is a copyrighted publication of MedReviews®, LLC. All rights reserved.
Figure 3.

Kaplan–Meier survival estimates (disease-specific survival) according to University of California Integrated Staging System risk groups [2].
Copyright © MedReviews®, LLC. Reprinted with permission of MedReviews®, LLC. Klatte T, Pantuck AJ, Kleid MD et al. Understanding the natural biology of kidney cancer: Implications for targeted cancer therapy. Rev Urol 2007;9: 47–56. Reviews in Urology is a copyrighted publication of MedReviews®, LLC. All rights reserved.
More recent nomograms have integrated molecular information (Table 3). Kim et al. [71] screened 318 patients with localized and metastatic clear cell RCC using a tissue microarray technique to examine eight different molecular markers. CAIX, TP53, gelsolin, and vimentin were independent predictors of survival on multivariate analysis. Inclusion into their nomogram yielded a C-index of 0.79, which was an improvement upon existing schema based only on standard clinicopathologic variables, such as grade, stage, or integrated models (e.g., UISS). In a follow-up study, an expanded set of 29 markers related to the hypoxia-inducible and rapamycin pathways were evaluated [74]. A unified nomogram was developed based on multivariate Cox proportional hazards modeling, which identified Ki-67, p53, endothelial VEGFR-1, epithelial VEGFR-1, and epithelial VEGF-D along with ECOG PS, T classification, and Fuhrman grade to stratify patients into three risk groups. Again, the addition of molecular markers along with classic variables improved the predictive accuracy considerably (e.g., C-index of 0.904) [74]. Parker et al. [75] developed the BioScore, a biomarker panel consisting of B7-H1, survivin, and Ki-67 expression in 634 consecutive clear cell RCC patients, and determined that a high BioScore correlated with death from RCC (HR, 5.03; 95% confidence interval, 3.8–6.6; p < .001).
Predicting Response to Systemic Therapy
The current selection of targeted agents has largely been based on clinical efficacy, side effect profile, patient comorbidities, and PS. However, with a rapidly expanding array of targeted agents, choosing a particular agent is becoming increasingly difficult. Exciting data are emerging based on host- and tumor-specific factors, ushering in the notion of personalized therapy; the goal of personalized therapy is to help predict or identify patients who are likely to respond to systemic immunotherapy or targeted agents while at the same time avoid potentially toxic ineffective treatment in others.
Motzer et al. [36] (Table 3) developed a nomogram for predicting the probability of 12-month PFS for patients who received sunitinib on the basis of outcome data from the seminal randomized phase III trial of sunitinib versus IFN-α in clear cell mRCC patients. ECOG PS score, time from diagnosis to treatment, prior nephrectomy, corrected serum calcium level, hemoglobin level, LDH and alkaline phosphatase levels, thrombocytosis, number of metastatic sites, and presence of lung and liver metastases were combined into a comprehensive instrument.
Heng et al. [76] recently expanded upon the Motzer criteria by analyzing a cohort of 645 patients with mRCC (all subtypes) treated with VEGF-targeted agents. They found that additional prognostic value for overall survival was gained from the use of higher absolute neutrophil and platelet counts (greater than the upper limit of normal), allowing for creation of three risk categories. The 2-year overall survival rates by risk were 75% (favorable risk, zero prognostic factors), 53% (intermediate risk, one or two prognostic factors), and 7% (poor risk, three to six prognostic factors), respectively. The associated C-index of their model was 0.73.
Our group observed longer survival among patients with high tumoral expression of CAIX (>85%); a possible association with IL-2 therapy (27% response rate among high CAIX expression versus 14% with low CAIX expression) was observed [46]. Atkins et al. [77] expanded this finding in their evaluation of CAIX expression among 66 patients (27 responders and 39 nonresponders) who received IL-2–based therapy. They too noted a correlation between IL-2 response and CAIX staining, demonstrating a twofold higher response rate in patients with high CAIX expression (odds ratio, 3.3; p = .04). The prognostic power was greater with the inclusion of histologic predictors [78].
Recently, Rini et al. [79] discerned a key association in mRCC patients treated with targeted therapy: diastolic blood pressure elevation was associated with a better clinical outcome. An exploratory pooled analysis of two phase II cytokine-refractory mRCC studies was performed to further examine this intriguing association among diastolic blood pressure, pharmacokinetics, and the clinical efficacy of axitinib [80]. The median overall survival duration for patients with one or more diastolic blood pressure value ≥90 mmHg was significantly longer than that of normotensive patients (130 weeks versus 42 weeks, respectively; p < .01). Hypertension was validated as an independent predictor of clinical efficacy of the drug.
Summary
A better understanding of the oncogenesis and basic biology of RCCs has helped to identify key molecular pathways and proteins underlying their development and growth. In turn, this has facilitated the discovery of prognostic factors that can risk stratify patients, predictive biomarkers that can help individualize treatment selection and predict a patient's response to therapy, and the testing and approval of novel targeted treatments that address these molecular alterations in an evidence-based manner. Furthermore, over the past decade we have moved from the use of individual clinical prognosticators to increasingly sophisticated integrated multivariate models, which now incorporate molecular and genetic information. As molecular technology evolves and becomes more standardized, cost-effective, and routinely available, new RCC-specific targets will be identified, further expanding our knowledge of tumor-specific molecular signatures and ultimately moving a step closer to the goal of curative, nontoxic personalized therapies.
Author Contributions
Conception/Design: David Finley, Allan Pantuck, Arie Belldegrun
Manuscript writing: David Finley, Allan Pantuck, Arie Belldegrun
Final approval of manuscript: David Finley, Allan Pantuck, Arie Belldegrun
References
- 1.Jemal A, Siegel R, Xu J, et al. Cancer statistics, 2010. CA Cancer J Clin. 2010;60:277–300. doi: 10.3322/caac.20073. [DOI] [PubMed] [Google Scholar]
- 2.Klatte T, Pantuck AJ, Kleid MD, et al. Understanding the natural biology of kidney cancer: Implications for targeted cancer therapy. Rev Urol. 2007;9:47–56. [PMC free article] [PubMed] [Google Scholar]
- 3.Linehan WM. Genetic basis of bilateral renal cancer: Implications for evaluation and management. J Clin Oncol. 2009;27:3731–3733. doi: 10.1200/JCO.2009.23.0045. [DOI] [PMC free article] [PubMed] [Google Scholar]
- 4.Pfaffenroth EC, Linehan M. Genetic basis for kidney cancer: Opportunity for disease-specific approaches to therapy. Expert Opin Biol Ther. 2008;8:779–790. doi: 10.1517/14712598.8.6.779. [DOI] [PMC free article] [PubMed] [Google Scholar]
- 5.Tory K, Brauch H, Linehan M, et al. Specific genetic change in tumors as-sociated with von Hippel-Lindau disease. J Natl Cancer Inst. 1989;81:1097–1101. doi: 10.1093/jnci/81.14.1097. [DOI] [PubMed] [Google Scholar]
- 6.Latif F, Tory K, Gnarra J, et al. Identification of the von Hippel-Lindau disease tumor suppressor gene. Science. 1993;260:1317–1320. doi: 10.1126/science.8493574. [DOI] [PubMed] [Google Scholar]
- 7.Gnarra JR, Tory K, Weng Y, et al. Mutations of the VHL tumour suppressor gene in renal carcinoma. Nat Genet. 1994;7:85–90. doi: 10.1038/ng0594-85. [DOI] [PubMed] [Google Scholar]
- 8.Mena AC, Pulido EG, Guillen-Ponce C. Understanding the molecular-based mechanism of action of the tyrosine kinase inhibitor: Sunitinib. Anticancer Drugs. 2010;21(suppl 1):S3–S11. doi: 10.1097/01.cad.0000361534.44052.c5. [DOI] [PubMed] [Google Scholar]
- 9.Kibel A, Iliopoulos O, DeCaprio JA, et al. Binding of the von Hippel-Lindau tumor suppressor protein to Elongin B and C. Science. 1995;269:1444–1446. doi: 10.1126/science.7660130. [DOI] [PubMed] [Google Scholar]
- 10.Pause A, Lee S, Worrell RA, et al. The von Hippel-Lindau tumor-suppressor gene product forms a stable complex with human CUL-2, a member of the Cdc53 family of proteins. Proc Natl Acad Sci U S A. 1997;94:2156–2161. doi: 10.1073/pnas.94.6.2156. [DOI] [PMC free article] [PubMed] [Google Scholar]
- 11.Klatte T, Pantuck AJ. Molecular biology of renal cortical tumors. Urol Clin North Am. 2008;35:573–580. doi: 10.1016/j.ucl.2008.07.006. [DOI] [PubMed] [Google Scholar]
- 12.Schmidt L, Duh FM, Chen F, et al. Germline and somatic mutations in the tyrosine kinase domain of the MET proto-oncogene in papillary renal carcinomas. Nat Genet. 1997;16:68–73. doi: 10.1038/ng0597-68. [DOI] [PubMed] [Google Scholar]
- 13.Schmidt L, Junker K, Nakaigawa N, et al. Novel mutations of the MET proto-oncogene in papillary renal carcinomas. Oncogene. 1999;18:2343–2350. doi: 10.1038/sj.onc.1202547. [DOI] [PubMed] [Google Scholar]
- 14.Kovacs G. Molecular cytogenetics of renal cell tumors. Adv Cancer Res. 1993;62:89–124. doi: 10.1016/s0065-230x(08)60316-4. [DOI] [PubMed] [Google Scholar]
- 15.Pennacchietti S, Michieli P, Galluzzo M, et al. Hypoxia promotes invasive growth by transcriptional activation of the met protooncogene. Cancer Cell. 2003;3:347–361. doi: 10.1016/s1535-6108(03)00085-0. [DOI] [PubMed] [Google Scholar]
- 16.Pollard PJ, Brière JJ, Alam NA, et al. Accumulation of Krebs cycle intermediates and over-expression of HIF1α in tumours which result from germline FH and SDH mutations. Hum Mol Genet. 2005;14:2231–2239. doi: 10.1093/hmg/ddi227. [DOI] [PubMed] [Google Scholar]
- 17.Schmidt LS, Warren MB, Nickerson ML, et al. Birt-Hogg-Dubé syndrome, a genodermatosis associated with spontaneous pneumothorax and kidney neoplasia, maps to chromosome 17p11.2. Am J Hum Genet. 2001;69:876–882. doi: 10.1086/323744. [DOI] [PMC free article] [PubMed] [Google Scholar]
- 18.Baba M, Hong SB, Sharma N, et al. Folliculin encoded by the BHD gene interacts with a binding protein, FNIP1, and AMPK, and is involved in AMPK and mTOR signaling. Proc Natl Acad Sci U S A. 2006;103:15552–15557. doi: 10.1073/pnas.0603781103. [DOI] [PMC free article] [PubMed] [Google Scholar]
- 19.Hudon V, Sabourin S, Dydensborg AB, et al. Renal tumour suppressor function of the Birt-Hogg-Dubé syndrome gene product folliculin. J Med Genet. 2010;47:182–189. doi: 10.1136/jmg.2009.072009. [DOI] [PubMed] [Google Scholar]
- 20.Hasumi H, Baba M, Hong SB, et al. Identification and characterization of a novel folliculin-interacting protein FNIP2. Gene. 2008;415:60–67. doi: 10.1016/j.gene.2008.02.022. [DOI] [PMC free article] [PubMed] [Google Scholar]
- 21.Hartman TR, Nicolas E, Klein-Szanto A, et al. The role of the Birte-Hogge-Dubé protein in mTOR activation and renal tumorigenesis. Oncogene. 2009;28:1594–1604. doi: 10.1038/onc.2009.14. [DOI] [PMC free article] [PubMed] [Google Scholar]
- 22.Chen J, Futami K, Petillo D, et al. Deficiency of FLCN in mouse kidney led to development of polycystic kidneys and renal neoplasia. PLoS One. 2008;3:e3581, 1–8. doi: 10.1371/journal.pone.0003581. [DOI] [PMC free article] [PubMed] [Google Scholar]
- 23.Shaw RJ, Cantley LC. Ras, PI(3)K and mTOR signalling controls tumour cell growth. Nature. 2006;441:424–430. doi: 10.1038/nature04869. [DOI] [PubMed] [Google Scholar]
- 24.Fruman DA, Meyers RE, Cantley LC. Phosphoinositide kinases. Ann Rev Biochem. 1998;67:481–507. doi: 10.1146/annurev.biochem.67.1.481. [DOI] [PubMed] [Google Scholar]
- 25.Fresno Vara JA, Casado E, de Castro J, et al. PI3K/Akt signalling pathway and cancer. Cancer Treat Rev. 2004;30:193–204. doi: 10.1016/j.ctrv.2003.07.007. [DOI] [PubMed] [Google Scholar]
- 26.Dancey J. Therapeutic targets: mTOR and related pathways. Cancer Biol Ther. 2006;5:1065–1073. doi: 10.4161/cbt.5.9.3175. [DOI] [PubMed] [Google Scholar]
- 27.Porta C, Figlin RA. Phosphatidylinositol-3-kinase/Akt signaling pathway and kidney cancer, and the therapeutic potential of phosphatidylinositol-3-kinase/Akt inhibitors. J Urol. 2009;182:2569–2577. doi: 10.1016/j.juro.2009.08.085. [DOI] [PubMed] [Google Scholar]
- 28.Hay N, Sonenberg N. Upstream and downstream of mTOR. Genes Dev. 2004;18:1926–1945. doi: 10.1101/gad.1212704. [DOI] [PubMed] [Google Scholar]
- 29.Pinto Marín A, Sànchez A, Espinosa Arranz E, et al. mTOR pathway inhibition in renal cell carcinoma. Urol Oncol. 2010 Mar 4; doi: 10.1016/j.urolonc.2009.11.008. [Epub ahead of print] [DOI] [PubMed] [Google Scholar]
- 30.Wysocki PJ. mTOR in renal cell cancer: Modulator of tumor biology and therapeutic target. Expert Rev Mol Diag. 2009;9:231–241. doi: 10.1586/erm.09.8. [DOI] [PubMed] [Google Scholar]
- 31.Guertin DA, Sabatini DM. Defining the role of mTOR in cancer. Cancer Cell. 2007;12:9–22. doi: 10.1016/j.ccr.2007.05.008. [DOI] [PubMed] [Google Scholar]
- 32.Wang X, Sun SY. Enhancing mTOR-targeted cancer therapy. Expert Opin Ther Targets. 2009;13:1193–1203. doi: 10.1517/14728220903225008. [DOI] [PMC free article] [PubMed] [Google Scholar]
- 33.Gordan JD, Lal P, Dondeti VR, et al. HIF-alpha effects on c-Myc distinguish two subtypes of sporadic VHL-deficient clear cell renal carcinoma. Cancer Cell. 2008;14:435–446. doi: 10.1016/j.ccr.2008.10.016. [DOI] [PMC free article] [PubMed] [Google Scholar]
- 34.deKernion JB, Sarna G, Figlin R, et al. The treatment of renal cell carcinoma with human leukocyte alpha-interferon. J Urol. 1983;130:1063–1066. doi: 10.1016/s0022-5347(17)51686-9. [DOI] [PubMed] [Google Scholar]
- 35.Quesada JR, Swanson DA, Trindade A, et al. Renal cell carcinoma: Antitumor effects of leukocyte interferon. Cancer Res. 1983;43:940–947. [PubMed] [Google Scholar]
- 36.Motzer RJ, Bukowski RM, Figlin RA, et al. Prognostic nomogram for sunitinib in patients with metastatic renal cell carcinoma. Cancer. 2008;113:1552–1558. doi: 10.1002/cncr.23776. [DOI] [PubMed] [Google Scholar]
- 37.Fyfe G, Fisher RI, Rosenberg SA, et al. Results of treatment of 255 patients with metastatic renal cell carcinoma who received high-dose recombinant interleukin-2 therapy. J Clin Oncol. 1995;13:688–696. doi: 10.1200/JCO.1995.13.3.688. [DOI] [PubMed] [Google Scholar]
- 38.McDermott D, Ghebremichael S, Signoretti S, et al., editors. The high-dose aldesleukin (HD IL-2) Select trial in patients with metastatic renal cell carcinoma (mRCC): Preliminary assessment of clinical benefit. Genitourinary American Society of Clinical Oncology meeting; March 5–7, 2010; San Francisco, California. [Google Scholar]
- 39.Jocham D, Richter A, Hoffmann L, et al. Adjuvant autologous renal tumour cell vaccine and risk of tumour progression in patients with renal-cell carcinoma after radical nephrectomy: Phase III, randomised controlled trial. Lancet. 2004;363:594–599. doi: 10.1016/S0140-6736(04)15590-6. [DOI] [PubMed] [Google Scholar]
- 40.Hernàndez J, Bui MH, Han KR, et al. Novel kidney cancer immunotherapy based on the granulocyte-macrophage colony-stimulating factor and carbonic anhydrase IX fusion gene. Clin Cancer Res. 2003;9:1906–1916. [PubMed] [Google Scholar]
- 41.Tso CL, Zisman A, Pantuck A, et al. Induction of G250-targeted and T-cell-mediated antitumor activity against renal cell carcinoma using a chimeric fusion protein consisting of G250 and granulocyte/monocyte-colony stimulating factor. Cancer Res. 2001;61:7925–7933. [PubMed] [Google Scholar]
- 42.Yang L, Yang H, Rideout K, et al. Engineered lentivector targeting of dendritic cells for in vivo immunization. Nat Biotechnol. 2008;26:326–334. doi: 10.1038/nbt1390. [DOI] [PMC free article] [PubMed] [Google Scholar]
- 43.Geijtenbeek TB, Torensma R, van Vliet SJ, et al. Identification of DC-SIGN, a novel dendritic cell-specific ICAM-3 receptor that supports primary immune responses. Cell. 2000;100:575–585. doi: 10.1016/s0092-8674(00)80693-5. [DOI] [PubMed] [Google Scholar]
- 44.Amato RJ, Hawkins RE, Kaufman HL, et al. Vaccination of metastatic renal cancer patients with MVA-5T4: A randomized, double-blind, placebo-controlled phase III study. Clin Cancer Res. 2010;16:5539–5547. doi: 10.1158/1078-0432.CCR-10-2082. [DOI] [PubMed] [Google Scholar]
- 45.Oudard S, Rixe O, Beuselinck B, et al. A phase II study of the cancer vaccine TG4010 alone and in combination with cytokines in patients with metastatic renal clear-cell carcinoma: Clinical and immunological findings. Cancer Immunol Immunother. 2011;60:261–271. doi: 10.1007/s00262-010-0935-9. [DOI] [PMC free article] [PubMed] [Google Scholar]
- 46.Bui MH, Seligson D, Han KR, et al. Carbonic anhydrase IX is an independent predictor of survival in advanced renal clear cell carcinoma: Implications for prognosis and therapy. Clin Cancer Res. 2003;9:802–811. [PubMed] [Google Scholar]
- 47.Ferrara N. Vascular endothelial growth factor as a target for anticancer therapy. The Oncologist. 2004;9(suppl 1):2–10. doi: 10.1634/theoncologist.9-suppl_1-2. [DOI] [PubMed] [Google Scholar]
- 48.Qiu Y, Hoareau-Aveilla C, Oltean S, et al. The anti-angiogenic isoforms of VEGF in health and disease. Biochem Soc Trans. 2009;37:1207–1213. doi: 10.1042/BST0371207. [DOI] [PMC free article] [PubMed] [Google Scholar]
- 49.Jacobsen J, Rasmuson T, Grankvist K, et al. Vascular endothelial growth factor as prognostic factor in renal cell carcinoma. J Urol. 2000;163:343–347. [PubMed] [Google Scholar]
- 50.Phuoc NB, Ehara H, Gotoh T, et al. Prognostic value of the co-expression of carbonic anhydrase IX and vascular endothelial growth factor in patients with clear cell renal cell carcinoma. Oncol Rep. 2008;20:525–530. [PubMed] [Google Scholar]
- 51.Klatte T, Seligson DB, Riggs SB, et al. Hypoxia-inducible factor 1α in clear cell renal cell carcinoma. Clin Cancer Res. 2007;13:7388–7393. doi: 10.1158/1078-0432.CCR-07-0411. [DOI] [PubMed] [Google Scholar]
- 52.Lidgren A, Hedberg Y, Grankvist K, et al. The expression of hypoxia-inducible factor 1α is a favorable independent prognostic factor in renal cell carcinoma. Clin Cancer Res. 2005;11:1129–1135. [PubMed] [Google Scholar]
- 53.Lidgren A, Hedberg Y, Grankvist K, et al. Hypoxia-inducible factor 1α expression in renal cell carcinoma analyzed by tissue microarray. Eur Urol. 2006;50:1272–1277. doi: 10.1016/j.eururo.2006.05.043. [DOI] [PubMed] [Google Scholar]
- 54.Ku JH, Park YH, Myung JK, et al. Expression of hypoxia inducible factor-1α and 2α in conventional renal cell carcinoma with or without sarcomatoid differentiation. Urol Oncol. 2009 Nov 12; doi: 10.1016/j.urolonc.2009.08.007. [Epub ahead of print; doi: 10.1016/j.urolonc.2009.08.007.] [DOI] [PubMed] [Google Scholar]
- 55.Figlin RA, de Souza P, McDermott D, et al. Analysis of PTEN and HIF-1α and correlation with efficacy in patients with advanced renal cell carcinoma treated with temsirolimus versus interferon-α. Cancer. 2009;115:3651–3660. doi: 10.1002/cncr.24438. [DOI] [PubMed] [Google Scholar]
- 56.Zamparese R, Pannone G, Santoro A, et al. Survivin expression in renal cell carcinoma. Cancer Invest. 2008;26:929–935. doi: 10.1080/07357900802017553. [DOI] [PubMed] [Google Scholar]
- 57.Athanassiadou P, Grapsa D, Athanassiades P, et al. The prognostic significance of COX-2 and survivin expression in ovarian cancer. Pathol Res Pract. 2008;204:241–249. doi: 10.1016/j.prp.2007.11.004. [DOI] [PubMed] [Google Scholar]
- 58.Baytekin F, Tuna B, Mungan U, et al. Significance of P-glycoprotein, P53, and survivin expression in renal cell carcinoma. Urol Oncol. 2009 Nov 26; doi: 10.1016/j.urolonc.2009.09.001. [Epub ahead of print] [DOI] [PubMed] [Google Scholar]
- 59.Thompson RH, Kuntz SM, Leibovich BC, et al. Tumor B7–H1 is associated with poor prognosis in renal cell carcinoma patients with long-term follow-up. Cancer Res. 2006;66:3381–3385. doi: 10.1158/0008-5472.CAN-05-4303. [DOI] [PubMed] [Google Scholar]
- 60.Bluemke K, Bilkenroth U, Meye A, et al. Detection of circulating tumor cells in peripheral blood of patients with renal cell carcinoma correlates with prognosis. Cancer Epidemiol Biomarkers Prev. 2009;18:2190–2194. doi: 10.1158/1055-9965.EPI-08-1178. [DOI] [PubMed] [Google Scholar]
- 61.Namdarian B, Tan KV, Fankhauser MJ, et al. Circulating endothelial cells and progenitors: Potential biomarkers of renal cell carcinoma. BJU Int. 2010;106:1081–1087. doi: 10.1111/j.1464-410X.2010.09245.x. [DOI] [PubMed] [Google Scholar]
- 62.Nisman B, Yutkin V, Nechushtan H, et al. Circulating tumor M2 pyruvate kinase and thymidine kinase 1 are potential predictors for disease recurrence in renal cell carcinoma after nephrectomy. Urology. 2010;76:513.e1–513.e6. doi: 10.1016/j.urology.2010.04.034. [DOI] [PubMed] [Google Scholar]
- 63.Klatte T, Rao PN, de Martino M, et al. Cytogenetic profile predicts prognosis of patients with clear cell renal cell carcinoma. J Clin Oncol. 2009;27:746–753. doi: 10.1200/JCO.2007.15.8345. [DOI] [PubMed] [Google Scholar]
- 64.Klatte T, Pantuck AJ, Said JW, et al. Cytogenetic and molecular tumor profiling for type 1 and type 2 papillary renal cell carcinoma. Clin Cancer Res. 2009;15:1162–1169. doi: 10.1158/1078-0432.CCR-08-1229. [DOI] [PubMed] [Google Scholar]
- 65.Yaycioglu O, Roberts WW, Chan T, et al. Prognostic assessment of nonmetastatic renal cell carcinoma: A clinically based model. Urology. 2001;58:141–145. doi: 10.1016/s0090-4295(01)01207-9. [DOI] [PubMed] [Google Scholar]
- 66.Kattan MW, Reuter V, Motzer RJ, et al. A postoperative prognostic nomogram for renal cell carcinoma. J Urol. 2001;166:63–67. [PubMed] [Google Scholar]
- 67.Frank I, Blute ML, Cheville JC, et al. An outcome prediction model for patients with clear cell renal cell carcinoma treated with radical nephrectomy based on tumor stage, size, grade and necrosis: The SSIGN score. J Urol. 2002;168:2395–2400. doi: 10.1016/S0022-5347(05)64153-5. [DOI] [PubMed] [Google Scholar]
- 68.Motzer RJ, Bacik J, Murphy BA, et al. Interferon-α as a comparative treatment for clinical trials of new therapies against advanced renal cell carcinoma. J Clin Oncol. 2002;20:289–296. doi: 10.1200/JCO.2002.20.1.289. [DOI] [PubMed] [Google Scholar]
- 69.Zisman A, Pantuck AJ, Dorey F, et al. Improved prognostication of renal cell carcinoma using an integrated staging system. J Clin Oncol. 2001;19:1649–1657. doi: 10.1200/JCO.2001.19.6.1649. [DOI] [PubMed] [Google Scholar]
- 70.Mekhail TM, Abou-Jawde RM, BouMerhi G, et al. Validation and extension of the Memorial Sloan-Kettering prognostic factors model for survival in patients with previously untreated metastatic renal cell carcinoma. J Clin Oncol. 2005;23:832–841. doi: 10.1200/JCO.2005.05.179. [DOI] [PubMed] [Google Scholar]
- 71.Kim HL, Seligson D, Liu X, et al. Using protein expressions to predict survival in clear cell renal cell carcinoma. Clin Cancer Res. 2004;10:5464–5471. doi: 10.1158/1078-0432.CCR-04-0488. [DOI] [PubMed] [Google Scholar]
- 72.Choueiri T, Garcia JA, Elson P, et al. Clinical factors associated with outcome in patients with metastatic clear-cell renal cell carcinoma treated with vascular endothelial growth factor-targeted therapy. Cancer. 2007;110:543–550. doi: 10.1002/cncr.22827. [DOI] [PubMed] [Google Scholar]
- 73.Karakiewicz PI, Briganti A, Chun FK, et al. Multi-institutional validation of a new renal cancer-specific survival nomogram. J Clin Oncol. 2007;25:1316–1322. doi: 10.1200/JCO.2006.06.1218. [DOI] [PubMed] [Google Scholar]
- 74.Klatte T, Seligson D, LaRochelle J, et al. Molecular signatures of localized clear cell renal cell carcinoma to predict disease-free survival after nephrectomy. Cancer Epidemiol Biomarkers Prev. 2009;18:894–900. doi: 10.1158/1055-9965.EPI-08-0786. [DOI] [PubMed] [Google Scholar]
- 75.Parker AS, Leibovich BC, Lohse CM, et al. Development and evaluation of BioScore: A biomarker panel to enhance prognostic algorithms for clear cell renal cell carcinoma. Cancer. 2009;115:2092–2103. doi: 10.1002/cncr.24263. [DOI] [PMC free article] [PubMed] [Google Scholar]
- 76.Heng DY, Xie W, Regan MM, et al. Prognostic factors for overall survival in patients with metastatic renal cell carcinoma treated with vascular endothelial growth factor-targeted agents: Results from a large, multicenter study. J Clin Oncol. 2009;27:5794–5799. doi: 10.1200/JCO.2008.21.4809. [DOI] [PubMed] [Google Scholar]
- 77.Atkins M, Regan M, McDermott D, et al. Carbonic anhydrase IX expression predicts outcome of interleukin 2 therapy for renal cancer. Clin Cancer Res. 2005;15:3714–3721. doi: 10.1158/1078-0432.CCR-04-2019. [DOI] [PubMed] [Google Scholar]
- 78.Upton MP, Parker RA, Youmans A, et al. Histologic predictors of renal cell carcinoma response to interleukin-2-based therapy. J Immunother. 2005;28:488–495. doi: 10.1097/01.cji.0000170357.14962.9b. [DOI] [PubMed] [Google Scholar]
- 79.Rini BI, Schiller JH, Fruehauf JP, et al. Association of diastolic blood pressure (dBP) > 90 mmHg with overall survival (OS) in patients treated with axitinib (AG- 013736) [abstract 3543] J Clin Oncol. 2008;26(15 suppl):163s. [Google Scholar]
- 80.Rixe O, Dutcher J, Motzer R, et al. Diastolic blood pressure (dBP) and pharmacokinetics (PK) as predictors of axitinib efficacy in metastatic renal cell cancer (mRCC) [abstract 5045] J Clin Oncol. 2009;27(15 suppl):245s. [Google Scholar]