

Abstract
During HIV-1 morphogenesis, the precursor Gag protein is processed to release capsid (CA) proteins that form the mature virus core. In this process, the CA proteins assemble a lattice in which N-terminal domain (NTD) helices 1–3 are critical for multimer formation. Mature core assembly requires refolding of the N-terminus of CA into a β-hairpin, but the precise contribution of the hairpin core morphogenesis is unclear. We found that mutations at isoleucine 15 (I15), between the β-hairpin and NTD helix 1 are incompatible with proper mature core assembly. However, a compensatory mutation of histidine 12 in the β-hairpin to a tyrosine was selected by long term passage of an I15 mutant virus in T cells. The tyrosine does not interact directly with residue 15, but with NTD helix 3, supporting a model in which β-hairpin folding serves to align helix 3 for mature NTD multimerization.
Keywords: HIV, Gag, Capsid, N-terminal domain, Virus assembly
Introduction
Expression of the human immunodeficiency virus type 1 (HIV-1) gag gene is sufficient to generate immature viral particles that are released from infected cells (Wills and Craven, 1991; Spearman et al., 1994; Reicin et al., 1996; Hermida-Matsumoto and Resh, 1999; Freed, 1998; Mervis et al., 1988; Wang et al., 1998; Ono et al., 2000; Huseby et al., 2005). Immature particles contain a lipid bilayer envelope surrounding a shell formed primarily by precursor Gag (PrGag) proteins (Fuller et al., 1997; Wilk et al., 2001; Wright et al., 2007; Briggs et al., 2009). Shortly after budding, the viruses undergo a maturation step, in which the HIV-1 protease (PR) cleaves PrGag into its mature Gag protein components: matrix (MA), capsid (CA), spacer peptide 1 (SP1), nucleocapsid (NC), spacer peptide 2 (SP2), and p6 (Wills and Craven, 1991; Mervis et al., 1988; Freed, 1998). Electron microscopy (EM) studies of mature virus particles have demonstrated that maturation results in the formation of electron dense conical or cylindrical cores that are composed of about 1000–1500 capsid proteins surrounding a ribonucleoprotein complex derived from viral RNAs and tRNA primers, and enzymatic functions (Wills and Craven, 1991; Freed, 1998; Li et al., 2000; Benjamin et al., 2005; Briggs et al., 2003, 2006, 2009; Zhao et al., 2013).
HIV-1 CA is a 24 KDa protein that possesses two independently folded domains connected by a flexible linker. The N-terminal domain (NTD) is important for formation of CA hexamers and pentamers, while the C-terminal domain (CTD) contributes to hexamer formation and also fosters the interconnection of hexamers, in part via a CTD dimer interface (Gamble et al., 1996, 1997; Gitti et al., 1996; Momany et al., 1996; Berthet-Colominas et al., 1999; Worthylake et al., 1999; Ganser-Pornillos et al., 2007; Pornillos et al., 2009, 2010, 2011; see Fig. 1). The CA NTD is composed of seven alpha helices (Fig. 1A), and includes a cyclophilin (CypA) binding loop between helices 4 and 5, and an N-terminal ß-hairpin loop composed of the first thirteen residues of the mature CA protein. The interface formed by NTD helices 1–3 makes NTD–NTD contacts that have proven to be essential for mature core assembly (von Schwedler et al., 1998; Lanman et al., 2002; Ganser-Pornillos et al., 2007; Abdurahman et al., 2007; Pornillos et al., 2009, 2010, 2011; López et al., 2011). These helices form an 18-helix bundle in which residues near the N-terminal end of helix 1 are located towards hexamer centers, and have been shown to be essential for the hexamer formation (Fig. 1B; Ganser-Pornillos et al., 2004, 2007; Pornillos et al., 2009, 2010, 2011; Zhao et al., 2013). The CA CTD is smaller than the NTD, and is composed of a short 310 helix followed by an extended strand and four α helices (Momany et al., 1996; Gamble et al., 1997, Berthet-Colominas et al., 1999; Worthylake et al., 1999; Alcaraz et al., 2007; Wong et al., 2008; Pornillos et al., 2009; Byeon et al., 2009). The CTD comprises the dimerization interface, which relies on amino acid residues W184 and M185 (Gamble et al., 1997, Alcaraz et al., 2008; Byeon et al., 2009; Yu et al., 2009). Interestingly, Bharat et al. (Bharat et al., 2012) recently reported that significant rotations and translations of the two CA domains occur during the maturation process of the Mason–Pfizer monkey retrovirus.
Fig. 1.

HIV-1 CA structures. (A) Shown is a ribbon structure (pdb 3H4E) of the HIV-1 CA NTD with the β-hairpin, helices 1–7, and residue I15 indicated. (B) The HIV-1 capsid hexamer structure is shown as viewed down the sixfold axis from the outside of the mature HIV-1 core. In the model, which derives from pdb 3H4E, the mutated I15 residue of helix 1 is shown in black and the N-terminal β-hairpin loop is not shown.
One critical event that occurs during HIV-1 maturation is the proteolytic processing of the N-terminus of the CA protein, which results in the refolding of the first 13 CA residues from an extended conformation into a β-hairpin loop. Biochemical and mutational studies have shown that this β-hairpin loop is stabilized by a salt bridge formed between a proline located at position 1 and an aspartic acid at position 51, on the NTD helix 3 (Gamble et al., 1996; Gitti et al., 1996, Gross et al., 1998; von Schwedler et al., 1998; Tang et al., 2002; Abdurahman et al., 2007; Monroe et al., 2010; Wong et al., 2012). Interestingly, the crystal structure of CA proteins shows no evidence of CA intersubunit interactions involving the hairpin loop (Pornillos et al., 2009). However, several laboratories including ours have shown that mutations, deletions and/or extensions that affect the β-hairpin loop formation are detrimental for in vitro CA assembly reactions and also for maturation and infectivity (Gross et al., 1998; von Schwedler et al., 1998; Abdurahman et al., 2007; Cortines et al., 2011; López et al., 2011). Therefore, it has been postulated that the presence of the β-hairpin loop correlates with mature core assembly although the molecular basis for this requirement remains unclear (Gross et al., 1998; von Schwedler et al., 1998; Cortines et al., 2011; López et al., 2011). One possibility proposed for the Equine Infectious Anemia Virus (EIAV) CA protein is that refolding of the β-hairpin loop extends helix 1 to enhance the oligomerization of the CA NTD, but other models for the role of the β-hairpin exist (Chen et al., 2013).
We recently showed that mutation of I15 near the end of NTD helix 1 yielded CA variants with defects in in vitro assembly reactions (López et al., 2011). The location of this residue within CA hexamers (Fig. 1) implied that it may play a role during maturation by positioning β-hairpin loops with respect to helices 1 and 3, and an I15 variant was shown to dominantly interfere with the assembly of WT CA proteins (López et al., 2011). In our current study, we have found that an I15A CA mutant assembled replication defective virions. We also discovered two independent sets of compensatory mutations that reversed replication defects. One set contained a reversion of position 15 (alanine to valine; I15V) and a second-site mutation at residue 16 on helix 1 (serine to asparagine; S16N). The other set of compensatory mutations showed two second-site changes, one on the β-hairpin loop (histidine 12 to tyrosine; H12Y), and one on helix 4 (methionine 68 to isoleucine; M68I). More detailed analysis showed that the H12Y mutation was sufficient to compensate for the defects of the I15 mutation. Our data indicate that CA NTD β-hairpin residues serve to fine tune the alignment of helices 1–3 in 18 helix bundles for the generation of infectious HIV-1 cores.
Results
Analysis of HIV-1 capsid I15 variants
In a recent study (López et al., 2011), we examined the effects of CA NTD helix 1 mutations on the in vitro assembly of HIV-1 CA proteins. In particular, we found that mutations at NTD isoleucine 15 (I15) near the N-terminal end of helix 1 (Fig. 1) skewed the assembly pathway such that spheres and short tubes were assembled rather than the typical long tubes assembled by wild type (WT) proteins (Campbell and Vogt, 1995; Gross et al., 1998; Li et al., 2000; Barklis et al., 2009; López et al., 2011). Moreover, I15 mutant proteins also had the capacity to dominantly interfere with the assembly of WT proteins (López et al., 2011). These observations suggested that I15 side chain interactions are essential to proper core assembly, and to further analyze the structure and function of the helix 1 N-terminus, I15 mutants were evaluated in cell culture.
To analyze the effects of I15 mutations on virus infectivity, HEK 293T cells were transfected with WT and mutant HIV-1 strain NL4-3 constructs, and CA protein-normalized amounts of virus produced were used to infect MT4 T cells. Virus spread was then monitored by measuring CA levels via anti-CA immunoblotting from samples of cells that were passaged at 3–4 d intervals. As shown in Fig. 2A, WT HIV-1 rapidly infected MT4 T cells with virus levels peaking at 2–4 d post-infection, prior to cell death. In contrast, the CA I15A mutant virus levels did not peak until 21–31 d post-infection (Fig. 2A), while an I15D variant (López et al., 2011) was never detected after serial passages in MT4 T cells at any virus:cell input ratio (data not shown).
Fig. 2.

Infectivity of HIV-1 CA variants. Viral stocks of WT and CA variant viruses on a NL4-3 HIV-1 strain background were generated by transfection of proviral constructs into HEK 293T cells. At 3 d post transfection, virus-containing media supernatants were collected, filtered through 0.45 μm filters and normalized with respect to CA levels. MT4 T cells were infected in parallel with normalized stocks of the WT and variant viruses and passaged at 3- to 4-day intervals. Virus spread was monitored by measuring PrGag and CA levels in aliquots of infected cells by immunoblotting using a primary anti-CA antibody. Replication of the WT and variant viruses is plotted as relative CA levels in infected cells versus number of days post-infection. In all panels mock infections are indicated with white squares and WT infections are depicted with black squares. In panels A–C, I15A is depicted with white circles. Other infections are as follows: panel B: black triangles, I15V/S16N; black circles H12Y/I15A/M68I. Panel C: black circles, H12Y/I15A/M68I; black diamonds, H12Y/I15A; black triangles, I15A/M68I. Panel D: white triangles, M68I; white diamonds, H12Y.
In the case of the I15A mutant, the delayed kinetics of virus replication observed in Fig. 2A could have been due either to a stochastic lag in I15A replication or to the generation of revertant viruses. To distinguish between these alternatives, virus supernatants of the I15A variant from days 21–24 post-infection were recovered and used to re-infect new MT4 T cells. Significantly, virus obtained from the late time points of the initial I15A infections replicated with much faster kinetics than the original I15A virus stock, suggestive of a reversion and/or compensatory mutations. These putative revertants were characterized as described below.
Characterization of compensatory mutations
To examine the capacity of the I15A viruses to evolve compensatory mutations, we characterized I15A-derived viruses from two independent cultures that replicated with faster kinetics than the parental I15A stock. To do so, proviral DNAs from MT4 T cells infected with the rapidly spreading I15A variants were PCR-amplified, and CA sequences were analyzed. Our analysis indicated the presence of two different revertants. In the first one (I15V/S16N), the alanine codon at position 15 had mutated to a valine codon, and the neighboring codon (serine 16) had mutated to an asparagine codon. In the second revertant (H12Y/I15A/M68I), the I15A mutation was conserved, but this revertant possessed two other mutations: one was a H12Y mutation in the β-hairpin loop, and the second was a M68I mutation in NTD helix 4. To verify that the capsid mutations that were sequenced actually compensated for the I15 variations, the I15V/S16N and H12Y/I15A/M68I mutations were cloned into otherwise WT clones of the NL4-3 parental HIV-1 strain, and tested for their replication efficiencies. As shown in Fig. 2B, the molecularly cloned I15V/S16N variant replicated with the same kinetics as the WT NL4-3 strain, and the H12Y/I15A/M68I variant was only slightly delayed. In contrast, the control I15A virus again showed a replication defect, with virus spread not occurring until 21–31 d post-infection.
The above results demonstrate that the I15V/S16N HIV-1 variant is capable of efficient replication in MT4 T cells, and imply that either H12Y, M68I or both mutations compensate for the original I15A defect. To test the individual contributions of the selected mutants, molecular clones of H12Y/I15A and I15A/M68A were constructed and tested in a new experiment. Consistent with the aforementioned results, the H12Y/I15A/M68I virus replicated with WT kinetics, and the I15A virus replication was delayed (Fig. 2C). Significantly, the I15A/M68I variant replicated with somewhat delayed kinetics, with a peak at 9–16 d post-infection, whereas the H12Y/I15A variant replicated similarly to WT HIV-1 (Fig. 2C), suggesting that the H12Y β-hairpin loop mutation was predominantly responsible for compensation for the original I15A mutant. These data could be interpreted to indicate that H12Y and to a certain extent M68I specifically correct the I15A defect, or that the H12Y and M68I viruses are just globally better replicating viruses in MT4 cells. To distinguish between these alternatives, replication profiles of H12Y and M68I single mutation viruses were compared with the WT strain. Fig. 2D demonstrates that replication of the M68I variant was comparable to WT, while H12Y virus replication was slightly delayed. These results support the notion that H12Y, and to a lesser extent M68I, specifically compensate for the I15A defect.
Single step infection assays
As a complementary analysis of the effects of I15 variants, single round replication assays were performed. To do so, HIV-1 envelope-deleted HIV-Luc luciferase reporter constructs were cotransfected into human embryonic kidney (HEK) 293T cells with a VSV envelope glycoprotein expression construct to generate pseudotyped viruses (Scholz et al., 2005, 2008; Noviello et al., 2011) that were used to infect HeLa cell-derived CD4+HiJ cells (Kabat et al., 1994). Not surprisingly, WT HIV-1 viruses were more than fifty times as infectious as their I15A counterparts (Fig. 3). In general, results with the other capsid variant mimicked MT4 infection results (Fig. 2). Notably, the I15V/S16N, H12Y/I15A/M68I and H12Y/I15A variants showed single round infectivity levels of 50–70% WT levels, while the I15A/M68I variant was only slightly more infectious than the I15A parent. These results support the observations with replication competent NL4-3 viruses (Fig. 2), and demonstrate that the I15A defect is not specific to T cells, and can not be salvaged by the alternative entry route of VSV G-pseudotyped virus (Brun et al., 2008).
Fig. 3.

Single step infection assays. Luciferase gene-transducing HIV viruses were produced by cotransfection of HEK 293 T cells with a VSV-G expression plasmid for the indicated HIV variants. At 3 d post-transfection, virus-containing medium supernatants were collected, filtered through 0.45 μm filters, and used to infect HiJ cells plated the day before in 6-well plates. At the same time HEK 293T cell samples were collected to normalize for transfected cell HIV-Luc expression levels. At 3 d post-infection, the HiJ cells were collected and processed for luciferase assays. The results are depicted as luciferase activity signals in infected cells divided by transfected cell signals and normalized to values obtained with the WT HIV-Luc virus. The results are the values obtained using duplicates of two independent viral stocks for the revertants and four viral stocks for the WT and I15A mutant. Standard deviations are as shown.
Analysis of virus particle and release
To measure potential effects of the CA mutations on the release of virus-like particles (VLP), 293T cells were transfected with each CA variant construct (WT, I15A, I15V/S16N, H12Y/I15A/M68I, I15A/H12Y, I15A/M68I, H12Y and M68I) in the context of the replication defective HIV-Luc background. At 72 h post-transfection, virus and cells samples were collected and processed. Levels of virus release were monitored by immunoblotting of SDS-PAGE-fractionated VLP and cell samples using an anti-CA antibody. As shown for cellular samples (Fig. 4A–K), we observed some minor variations in WT PrGag, p41 and CA protein levels, depending on the transfection date. (Compare lanes A, D, I.) Nevertheless, none of the CA variants showed major differences in either cellular Gag expression or processing levels (Fig. 4A–K). Similarly, we noted no consistent reductions in VLP release or VLP Gag processing when VLP samples (Fig. 4, L–V) were surveyed. However, it is worth mentioning that I15A VLP samples often showed a species slightly smaller than the size of WT CA (see especially Fig. 4, lane M), which may represent a CA degradation product (Scholz et al., 2005), potentially indicative of a virus core defect as described below.
Fig. 4.
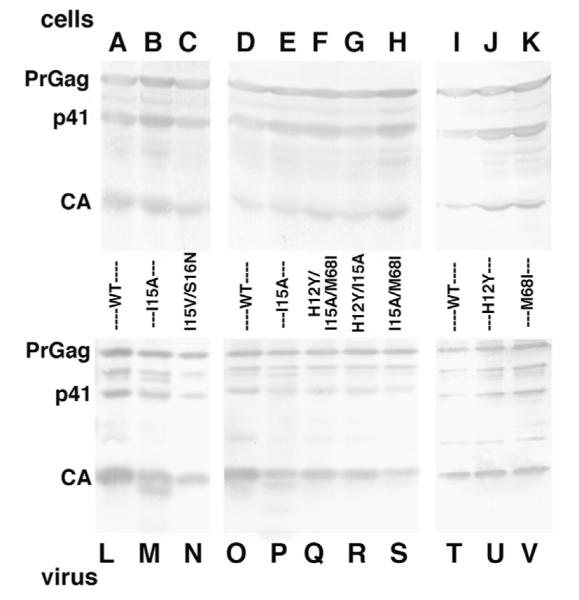
Analysis of virus particle and release. HEK 293 T cells were transfected with the indicated HIV-Luc constructs. At 72 h post transfection, virus samples were collected and concentrated through 20% sucrose cushions at 197,000g. Gag proteins from collected cells (top panel lanes A–K) and virus (bottom panel lanes L–V) were detected after SDS-PAGE by immunoblotting using a primary anti-CA antibody. Full-length PrGag, p41 and CA bands are indicated.
Effects of I15 CA mutations on virus core morphologies and in vitro assembly
As shown above, I15A HIV-1 viruses were defective for infection in both NL4-3 and HIV-Luc backgrounds, while the H12Y mutation compensated for this defect (Figs. 2 and 3). Moreover, I15A VLP capsid protein bands showed evidence of abnormalities on SDS-PAGE gels (Fig. 4), suggestive of a possible virus core defect. To extend these observations, we examined the core structures of WT, I15A and H12Y/I15A viruses for possible abnormalities. To do so, VLP from cells transfected with HIV-Luc variants were isolated and subjected to EM analysis as we have described previously (Scholz et al., 2005, 2008; Noviello et al., 2011). As we have seen in the past (Scholz et al., 2005, 2008; Noviello et al., 2011), WT HIV-1 conical cores were observed both associated with virus particles (Fig. 5, top left), and as free cores (Fig. 5, top right). From a total of 169 WT VLPs observed, 63.9% exhibited conical or cylindrical cores, consistent with previous observations. For I15A VLPs, considerably fewer particles showed conical or cylindrical cores (46.6% of 161 particles). Frequently, particles with no obvious cores were observed (Fig. 5, middle left panel), and even when cores were evident, they often appeared anomalous (middle right panel). However, when I15A was expressed in the presence of the compensatory HIV12Y mutation (H12Y/I15A), particle-associated cores and free cores appeared normal (Fig. 5, bottom panels). Additionally, a higher percentage of H12Y/I15A virus (61.7% of 167 particles) showed conical or cylindrical cores, suggesting that the H12Y change in the β-hairpin loop corrected the I15A defect at the N-terminus of NTD helix 1.
Fig. 5.

Effects of I15 CA mutations on virus core morphologies. WT, I15A and I15A/H12Y HIV-Luc viruses from transfected HEK 293 T cells were concentrated through 20% sucrose cushions at 197,000g, resuspended in cold PBS and subjected to a second round of ultracentrifugation at 149,000g, adhered to carbon-coated EM grids, stained, and visualized by EM. Representative viral particles or isolated cores for WT, I15A and I15A/H12Y are depicted. The size bar for all the panels is provided at the bottom right. Percentages of viruses with conical or cylindrical cores based on at least 150 virus counted were as follows: WT, 63.9%; I15A, 46.6%; H12Y/I15A, 61.7%.
We further examined the role of the H12Y compensatory mutation by exploiting in vitro assembly assays using purified CA proteins. For this approach, WT, I15A and H12Y/I15A CA proteins were expressed in bacteria, purified, and employed in in vitro assembly reactions (Barklis et al., 2009; López et al., 2011). To do so, purified proteins at 60 μM were induced to assemble at 4 °C for 48 h and then processed for visualization by EM. As shown in Fig. 6 (top panel) WT CA proteins assembled long tubes, which are representative of a mature assembly phenotype (Gross et al., 1998; Li et al., 2000; Ganser-Pornillos et al., 2004; Barklis et al., 2009; López et al., 2011). In contrast, I15A CA proteins (Fig. 6) assembled short tubes and spheres, indicative of a mature core assembly defect. However, the double H12Y/I15A mutant yielded tube numbers and morphologies similar to WT, demonstrating that H12Y counteracts the I15A defect. To quantify in vitro assembly results, tube lengths and areas covered by tubes were determined and normalized to WT tube values (Fig. 6, bottom panels). As illustrated, the I15A CA mutant gave lower numbers of CA tubes than WT or H12Y/I15A, as measured by tube coverage. Additionally, the average tube length for the few I15A tubes obtained was 50% shorter relative to the significantly higher numbers of WT and H12Y/I15A tubes. Thus, in vitro assembly results (Fig. 6) correlate with our virus core morphology analysis (Fig. 5), and support a model in which the H12Y mutation rescues the I15A replication defect by restoring normal virus core morphology. Details of the H12–I15 interaction are discussed below.
Fig. 6.

In vitro assembly of purified HIV capsid proteins. WT, I15A and H12Y/I15A CA proteins were expressed in bacteria, purified, and employed in in vitro assembly reactions. Purified proteins at 60 μM were induced to assemble at 4 °C for 48 h and then processed for visualization by EM, as shown in the top panels, where fewer capsid tube assembly products were observed for I15A than the WT or H12Y/I15A proteins. To quantify assembly efficiencies, tube coverage values were calculated from ten 14,370 × 14,370 μm2 fields of view as described in the Materials and methods. Results in the bottom left panel are given as areas covered by tubes after normalization of results obtained with WT CA. A T test analysis showed the tube coverage difference between I15A and the other two samples to be significant to a probability of P<0.008. In the bottom right panel, tube lengths in microns were quantitated using low magnification images and results are depicted as mean tube lengths plus standard deviations. A T test analysis showed the length difference between I15A and the two other samples to be significant to a probability of P<0.006.
Discussion
Structural analysis has indicated that the first three helices of the HIV-1 CA NTD coordinate CA hexamer and pentamer formation in mature virus cores (Ganser-Pornillos et al., 2004, 2007; Pornillos et al., 2009, 2010, 2011). Interestingly, evidence based on the Mason–Pfizer monkey virus (MPMV) suggests that helices 1–3 do not serve such a role in immature virus particle lattices (Bharat et al., 2012). This is consistent with the fact that virus maturation is accompanied by the formation of the NTD β-hairpin loop and the establishment of a salt bridge between CA proline 1 (P1) and aspartate 51 (D51) in helix 3. In EIAV, the formation of the β-hairpin loop serves to extend NTD helix 1 several residues in the N-terminal direction (Chen et al., 2013), potentially stabilizing mature capsid hexamers, but the precise structural contributions of retroviral β-hairpin and nearby residues with regard to viral morphogenesis are still unclear.
HIV-1 CA NTD residue I15 occupies a position near the N-terminus of helix 1, and adjacent to the P1-D51 salt bridge. Previously, we had shown that purified I15D and I15A proteins assembled immature-like spheres and small tubes rather than mature form long tubes in in vitro assembly reactions (López et al., 2011). Here, we have demonstrated that while I15 mutant Gag proteins are capable of assembling and releasing virus particles from cells (Fig. 4), the virions are replication defective and their mature cores are aberrant (Figs. 2,3,5). Selection for revertants of the I15A mutation yielded I15V/S16N and H12Y/I15A/M68I variants (Fig. 2). The selection of the I15V/S16N variant was not unexpected, since a variety of hydrophobic amino acids at CA residue 15 have been found in HIV-1 strains (Table 1). The H12Y/I15A/M68I variant was more interesting because it indicated that H12Y and/or M68I compensated for the I15A defect. Perhaps not surprisingly, separation of the two secondary mutations showed that M68I, located away from helix 1 (Fig. 7A), yielded only a small compensatory effect (Figs. 2 and 3), whereas H12Y was predominantly responsible for rescue of infectivity and virus core structure (Figs. 2, 3, 5 and 6).
Table 1.
Amino acid frequency at CA positions 12 and 15. HIV-1 genome sequences obtained from the HIV sequence compendium HIV-1/SIVcpz (http://www.hiv.lanl.gov/content/index) were analyzed for frequency of amino acids in capsid postions 12 and 15.
| Amino acid frequency (%) | |||||||
|---|---|---|---|---|---|---|---|
| Position | Val | Met | Ile | Leu | Tyr | His | Other |
| 12 | 0 | 0 | 0 | 0 | 2.0 | 97.0 | 1.0 |
| 15 | 4.5 | 5.9 | 45.3 | 44.3 | 0 | 0 | 0 |
Fig. 7.

Locations of mutant CA residues. Panel A shows the locations of CA residues H12 (red), I15 (black) and M68 (purple) on the HIV-1 CA hexamer structure (pdb 3GV2). Panels B and C each show CA NTD monomer structures (from pdb 3GV2), with helix 1 in red, helix 2 in green, and helix 3 in pink. In both B and C, residues 12 and 15 are colored light blue and marked; and residues T19 and L20 (red); Q50, D51, and T54 (pink); and P1 (blue) are as indicated. Panel B shows the WT protein, whereas panel C shows a model of the H12Y/I15A protein. The predicted hydrogen bond between H12Y and Q50 is depicted by the brown bar.
How does the H12Y mutation in the β-hairpin loop rescue the I15A mutant? Examination of the I15 side group (Fig. 7B), suggests that it is positioned to make important intramolecular contacts rather than critical intermolecular CA–CA contacts. Specifically, it is positioned to help align the N-terminal portion of NTD helix 1, potentially through interactions with T19 and L20, and to align helix 3 through interactions with T54. Of these two roles, the H12Y change appears more likely to affect the helix 3 alignment. In particular, a tyrosine at CA residue 12 is capable of hydrogen bonding to helix 3 residue Q50 (Fig. 7C), next to the P1–D51 salt bridge. We thus envision that while P1–D51 and I15–T54 interactions ordinarily help align the CA helix 3 N-terminus in mature virions, the I15–T54 interaction is replaced by the H12Y-Q50 hydrogen bonding in the H12Y/I15A double mutant. One consequence of having neither of these interactions is that a fraction of the CA I15A proteins in virions appears to be clipped (Fig. 4, Lane M), potentially near the β-hairpin-helix 1 juncture. In contrast, the consequences of having both I15 and H12Y do not prohibit HIV-1 replication, but may impart a very slight replication disadvantage (Figs. 2 and 3). This may be related to the fact that of the 2% of HIV-1 strains that carry H12Y (Table 1), all also have either a leucine or valine rather than an isoleucine at residue 15.
In terms of how alterations of the NTD helix 3 alignment might perturb HIV-1 morphogenesis, the percentage of conical, albeit anomalous cores formed with the I15A mutant suggest that I15A does not trap CA in an immature conformation. Instead, we speculate that the small variance in the I15A alignment of helices 1 and 3 yields CA proteins that either increase the frequency of pentamers versus hexamers (Ganser-Pornillos et al., 2004, 2007; Pornillos et al., 2009, 2010, 2011), or increase the probability that growth of mature core lattices will be terminated prematurely (Barklis et al., 2009; López et al., 2011). Either way the sensitivity of this region of CA to mutation suggests that the cavity occupied by I15 would be a worthwhile target for antivirals.
Materials and methods
Recombinant DNA constructs
The Vesicular Stomatitis virus (VSV) glycoprotein (G) expression construct, pVSV-G, used for envelope pseudotyping was described previously (Scholz et al., 2005, Noviello et al., 2011) and was a generous gift from Randy Taplitz. The parental HIV-Luc construct (pNL-LucE-R+; Connor et al., 1995) was kindly provided by Nathaniel Landau. The parental HIV-1 NL4-3 molecular clone was obtained from the NIH AIDS reagent program. The parental construct used for HIV-1 CA expression in bacteria is pWISP-WTCAH6 (Barklis et al., 2009) which expresses C-terminally histidine-tagged (his-tagged) CA proteins. It derives from pWISP-98-85 (Li et al., 2000; Ganser-Pornillos et al., 2004), which was kindly provided by Wes Sundquist.
The I15A point mutation was created by polymerase chain reaction (PCR) approaches as described previously (López et al., 2011) and was verified by sequencing. Its sequence is given below, where bold nucleotides correspond to the mutated residues, and underlined nucleotides represent silent mutations that create or destroy restriction enzyme cleavage sites: CAT CAG GCC GCT AGC CCT. The mutation was subcloned into pNL4-3 and HIV-Luc constructs using BssHII–ApaI (HIV-1 viral nt 711–2006) fragments, and mutations were confirmed by sequence analysis.
Compensatory mutations were cloned from longitudinal passages of MT4 T cells infected with the NL4-3 I15A virus. To do so, total DNA samples were isolated from infected MT4-T cells. For this, cells were lysed in 250 μl cold IPB buffer (20 mM Tris, pH 7.5, 150 mM NaCl, 1 mM ethylenediaminetetraacetic acid [EDTA], 0.02% sodium azide, 1% Triton X-100, 0.5% sodium deoxycholate, 0.1% sodium dodecyl sulfate [SDS]) for 5 min on ice after which 250 μl of water was added. Cellular extracts were then treated with 2.5 μl of proteinase K (20 mg/ml) for 2 h at 50°C. DNA was isolated by two 500 μl phenol–chloroform extractions followed by a 500 μl chloroform extraction. The aqueous phase was then treated with 1/10 volume (40 μl) of plasmid-free 3 M sodium acetate pH 7.6 and 2.5 vol (1 ml) of cold plasmid-free 100% ethanol. The DNA was precipitated for 1 h at −80°C, pelleted by centrifugation for 5 min at 16000g, and the ethanol excess was dried using a speed-vac. The DNA samples were resuspended in 150 μl of plasmid-free 10 mM Tris pH7.4, 0.1 mM EDTA, aliquoted and stored at −20 °C. Purified DNAs (1–5 μl) then were used as templates for PCR amplification reactions. The sequences between nt 671 and 2121 (pNL4-3 nt sequence) were amplified using ThermoPol Polymerase (New England Biolabs) using standard PCR protocols and subcloned into pGEMTeasy vector (Promega) for sequence analysis. The obtained capsid revertants were then subcloned back into both HIV-Luc and pNL4-3 constructs using BssHII–ApaI sites (nt 711 to 2006), and sequenced again. The sequences obtained for the compensatory mutants are as follows: I15V/S16N: CAT CAG GCC GTT AAC CCT; H12Y/I15A/M68I: TAT CAG GCC GCT AGC and CAA ATA TTA AAA for M68I where bold nucleotides correspond to the mutated residue and underlined nucleotides represent silent mutations that create or destroy restriction enzyme cleavage sites.
To create the double H12Y/I15A and I15A/M68I HIV-Luc and pNL4-3 constructs BssHII–NsiI (nt 711–1248) and NsiI–ApaI (nt 1248–2006) sites were used respectively. For the latter construct HIV-Luc and pNL4-3 I15A variants were used as parentals. The single M68I variant HIV-Luc and pNL4-3 constructs were created by using NsiI–ApaI (nt 1248–2006) sites into WT parental constructs. For the single H12Y construct, the sequences between nt 671 and 1248 (pNL4-3 nt sequence) were amplified using Thermo-Pol Polymerase using standard PCR protocols and subcloned into pGEMTeasy vector for sequence analysis. To create the H12Y HIV-Luc and pNL4-3 constructs, BssHII–NsiI (nt 711–1248) sites were used. For bacterial CA protein expression, the compensatory mutations were amplified from their respective HIV-Luc constructs by PCR to create NdeI sites at the 5′ ends of the capsid genes, subcloned into pGEMTeasy, sequenced, and then subcloned into pWISP-6H using NdeI–SpeI (nt 1187–1511) sites.
Cell culture, transfections and infections
HEK 293T (DuBridge et al., 1987) and HiJ (Kabat et al., 1994) cells were maintained in Dulbecco’s modified Eagle’s medium (DMEM) supplemented with 10% fetal bovine serum (FBS), 10 mM HEPES (pH 7.4), penicillin, and streptomycin at 37 °C and 5% CO2. The MT4 T cell line used for longitudinal passages was maintained in Roswell Park Memorial Institute medium (RPMI) supplemented with 10% FBS, 10 mM HEPES (pH 7.4), penicillin, and streptomycin at 37 °C and 5% CO2.
For analysis of virus from cells, HEK 293T cells were transfected with 24 μg HIV-Luc plasmids using calcium phosphate as described previously (Scholz, et al., 2005, 2008; Noviello et al., 2011). At 72 h post-transfection, virus samples were collected by filtering supernatants through 0.45 μm filters, pelleted at 100,000g through 20% sucrose cushions at 4 °C and then resuspended in 100 μl of cold phosphate-buffered saline (PBS: 137 mM NaCl, 2.7 mM KCl, 10 mM NaH2PO4, 2 mM KH2PO4, pH 7.4), stored at 80 °C and mixed 1:1 with loading buffer (40 mM DTT, 0.25% bromophenol blue, 4% SDS, 20% glycerol, 125 mM Tris pH 6.8, 10% β-mercaptoethanol) prior to electrophoresis.
Cell samples from 10 cm plates were washed in 2 ml of cold PBS, collected in 1 ml of cold PBS, and 200 μl aliquots of the suspended cells were centrifuged and lysed by suspension for 5 min in 50 μl of cold IPB buffer on ice. Insoluble cellular debris was removed via centrifugation for 15 min at 16,000g at room temperature. Cell lysates were mixed with equal amounts of loading buffer and then stored at −80 °C. Both virus and cell samples were fractionated by 10% SDS-polyacrylamide gel electrophoresis (SDS-PAGE) and subsequently immunoblotted as described previously (Scholz et al., 2005, 2008; Noviello et al., 2011). For immunoblotting, the monoclonal mouse anti-CA antibody Hy183 (kindly provided by Bruce Chesebro) was used at a 1/10 dilution (from hybridoma supernatants) as the primary antibody. Secondary antibodies were alkaline phosphatase-conjugated anti-mouse antibodies (Promega) used at a 1/10,000 dilution. BCIP (5-bromo-4-chloro-3-indolyl-phosphate) was used in conjunction with NBT (nitro blue tetrazolium) for the colorimetric detection of alkaline phosphatase activity. Cell and virus Gag levels were quantified densitometrically using NIH ImageJ. Mean gray values for each CA band were measured for the same-sized areas on blots.
To perform the luciferase-based infectivity assays, HEK 293T cells were transfected as described above using 18 μg of HIVLuc and 6 μg of pVSV-G plasmids. At 72 h post-transfection, supernatants containing viral particles were filtered through 0.45 μm syringe filter, aliquoted and stored at −80 °C. Aliquots of the transfected cells were collected in cold luciferase assay buffer (LAB) (100 mM sodium phosphate [pH 8.0], 4 mM adenosine triphosphate, 1 mM sodium pyrophosphate, 6 mM magnesium chloride, 0.2% Triton X-100) and frozen at −80 °C to be used as transfection controls. For the infections, confluent HiJ cells were transferred from a 10 cm dish to a 6 well plate at a 1:4 dilution the day before the infections. One day later, HiJ cells were incubated with 1 ml of virus, 1 ml of culture media, and 10 μl of 1.6 mg/ml polybrene in duplicate and then incubated at 37 °C, 5% CO2 for 72 h. Three days post-infection cells were washed with cold PBS, lysed in 250 μl LAB buffer and frozen at −80 °C before assays. In all cases samples from transfected and infected cells were diluted at 1:10 or 1:20 in LAB buffer lacking Triton X-100 and run on a Centro XS3 LB 960 Microplate Luminometer (Berthold Technologies). The 96-well plates used were Microfluor 1 white (Nunc # 7705). The luciferin volume injected was set for 100 μl per well of a freshly prepared 1 mM luciferin solution (BD Monolight) with counting times of 15 s per well. The obtained relative light units were calculated as (average of infection duplicate counts)/(average of transfection counts) and subsequently normalized to WT samples.
For the longitudinal infections of virus in MT4 T cells, 24 μg of pNL4-3 wild type DNA or I15 variants were transfected via calcium phosphate into HEK 293T cells. At 3 d post-transfection, viral supernatants were filtered through 0.45 μm filters and aliquots of each stock were subjected to SDS-PAGE and immunoblotting for virus quantitation. For viral inoculum normalization, CA bands were quantified from immunoblots using NIH ImageJ software package and used as starting inocula for infections of 5 ml MT4 cells. After infections, aliquots of cells (20% of the cultures) were collected every 2–4 d, centrifuged for 3 min at 16,000g, lysed in cold IPB buffer and stored at −80 °C prior to analysis. Infections were tracked by immunoblot detection of infected cell CA levels using the mouse anti-CA monoclonal antibody Hy183 described above. Potential compensatory mutant viruses from late-stage collections were used to re-infect fresh stocks of MT4 cells after normalization against the WT virus. These secondary passages also were monitored by CA immunobloting, and the compensatory mutations were cloned as described above.
Virus particle analysis
HIV-Luc wild type (WT) and I15 variant virus-like particles were produced by calcium phosphate transfection of 24 μg of plasmid DNA of HEK 293T cells. Supernatants were filtered through 0.45 μm filters, and subjected to ultracentrifugation through 20% sucrose cushions as describe above. Pelleted virus samples were gently resuspended in 100 μl cold PBS and subjected to a second round of centrifugation using a Beckman airfuge ultracentrifuge for 15 min at 149,000g in a A100/18 fixed angle rotor. These virus pellets were gently suspended in 15 μl of cold PBS and processed for EM. Briefly, 8 μl drops were deposited onto UV irradiated EM grids (Ted Pella 01824) for 3 min, rinsed 15 s in water, wicked, stained 1 min in filtered 1.3% uranyl acetate, wicked, and air dried. EM images were collected at 100 kV on a Philips CM120/Biotwin transmission electron microscope (TEM). Images were collected as 1024- by 1024-pixel, 14-bit grayscale Gatan digital micrograph 3 (DM3) files on a Gatan 794 multiscan CCD camera and converted into 8-bit grayscale TIFF images using the program Digital Micrograph 3.4.0. Raw images were acquired at 8400× and 27,500×. Virus particles from at least 100 images per sample were examined for the presence of conical or cylindrical cores to determine the percentage of particles with normal core morphologies.
Purification of bacterially expressed CA proteins
pWISP-6H plasmids containing WT or mutant CA seqeunces were transformed into the E. coli strain BL21(DE3)/pLysS (Novagen) for protein expression and purification, which followed previous procedures (Barklis et al., 2009; Noviello et al., 2011; López et al., 2011). Briefly, bacteria were grown in Luria-Bertani (LB) broth supplemented with 0.02% maltose and 10 mM MgSO4 to a 600 nm optical density (OD) of about 0.4, and then induced at 25 °C for 3 h via the addition of 0.5 mM isopropyl-β-D-thiogalactopyranoside (IPTG; Roche #114114 46001). Induced bacteria were collected by centrifugation (Sorvall GSA 5000 rpm, 3000g, 4 °C) and frozen at −80 °C. Bacterial pellets were suspended in 10 ml of ice cold 50 mM NaH2PO4 pH 7.8, 300 mM NaCl containing 0.5 mg of DNaseI (Roche #10104159001) plus protease inhibitors (15 μg/ml leupeptin, 36 μg/ml egg-white trypsin inhibitor, 36 μg/ml soybean trypsin inhibitor, 30 μg/ml aprotinin, and 1.5 mM phenylmethylsulfonyl fluoride [PMSF]; Sigma). After a 10 min incubation on ice, bacterial suspensions were French-pressed twice, cleared by centrifugation at 23,000g (Sorvall SS34, 14,000 rpm) for 15 min at 4 °C, and purified by one to two rounds of nickel chelate chromatography (Qiagen Ni-NTA resin, #30210). Non-specific protein contaminants were washed by increasing the imidazole concentration (10 mM, 25 mM and 50 mM) in wash buffer (50 mM NaH2PO4 pH 6, 300 mM NaCl, 10% glycerol), and CA proteins subsequently were eluted in the same buffer containing 250 mM imidazole. Purified fractions were subjected to three rounds of buffer exchange by dialysis in 20 mM Tris pH 8.0, 5 mM β-mercaptoethanol for 6 h at 8 °C and protein aliquots were flash frozen on dry ice and stored at −80 °C. Protein identities were assessed by immunoblotting, and protein purities of >90% were verified by Coomassie blue staining of samples fractionated in 10% sodium dodecyl sulfate polyacrylamide gel electrophoresis (SDS-PAGE). Protein concentrations were determined via 280 nm absorbance readings assuming a molar extinction coefficient of 33,580, and by densitometric comparison of stained SDS-PAGE protein bands versus known standards.
Analysis of in vitro CA assembled products
In vitro assembly capsid incubations were performed as described previously (Barklis et al., 2009; Noviello et al., 2011; López et al., 2011). Typically, 10 μl reactions included 1.5 mg/ml protein (final concentration) and 1× assembly buffer (50 mM Tris pH 7.0, 1 M NaCl and 5 mM β-Me), and were incubated 48 h at 4° C. After this incubation step, the samples were lifted 3 min onto UV-irradiated 400-mesh carbon-formvar grids (Ted Pella 01822-F), washed for 1 min in water, wicked on filter paper, stained 45 s in filtered 1.33% uranyl acetate, wicked, and air dried. Samples were viewed at 100 kV on a Philips CM120 Biotwin and images were collected as described above.
Tube lengths for each CA variant were manually measured using at least ten 4800× gray scale TIF images corresponding to areas of 4.136 × 4.136 μm2. Tube area coverage was determined as described previously López et al., 2011). Briefly, image features were highlighted using gray scale TIF images and the Feature J/FJ Laplacian command with a smoothing step of 10, and the zero crossings parameter unselected. Laplacian images were thresholded to low values of 0.10 and maximum high values. For tube coverage tabulation, the Analyze/Analyze Particles command was used with the Analyze/Set Measurements area and Feret’s diameter options highlighted. The Analyze Particles command was called with size and circularity arguments, and results (including particle ID numbers, particle areas, and Feret diameters) were saved in table format. Tube candidates then were excluded if they did not meet the criteria of having a Feret’s diameter of at least 50, and a (Feret)2/(area) value of at least 4. After performing these qualification steps, total areas covered by tubes were summed and divided by total areas to obtain area fractions covered by tubes. Results are depicted as areas covered by tubes normalized to the results with wild type incubations.
Acknowledgments
The authors gratefully acknowledge the advice and assistance of Ayna Alfadhli, Henry McNett, Colleen Noviello, and Mike Webb; and support from NIH grants R01 GM060170 and R01 GM10 1983 to EB.
References
- Abdurahman S, Höglund S, Höglund A, Vahlne A. Mutation in the loop C-terminal to the cyclophilin A binding site of HIV-1 capsid protein disrupts proper virus assembly and infectivity. Retrovirology. 2007;4:69–80. doi: 10.1186/1742-4690-4-19. [DOI] [PMC free article] [PubMed] [Google Scholar]
- Alcaraz LA, del Alamo M, Barrera FN, Mateu MG, Neira JL. Flexibility in HIV-1 assembly subunits: solution structure of the monomeric C-terminal domain of the capsid protein. Biophys. J. 2007;93(4):1264–1276. doi: 10.1529/biophysj.106.101089. [DOI] [PMC free article] [PubMed] [Google Scholar]
- Barklis E, Alfadhli A, McQuaw C, Yalamuri S, Still A, Barklis RL, Kukull B, López CS. Characterization of the in vitro HIV-1 capsid assembly pathway. J. Mol. Biol. 2009;387(2):376–389. doi: 10.1016/j.jmb.2009.01.058. [DOI] [PMC free article] [PubMed] [Google Scholar]
- Benjamin J, Ganser-Pornillos BK, Tivol WF, Sundquist WI, Jensen GJ. Three-dimensional structure of HIV-1 virus-like particles by electron cryotomography. J. Mol. Biol. 2005;346(2):577–588. doi: 10.1016/j.jmb.2004.11.064. [DOI] [PMC free article] [PubMed] [Google Scholar]
- Berthet-Colominas C, Monaco S, Novelli A, Sibai G, Mallet F, Cusack S. Head-to-tail dimers and interdomain flexibility revealed by the crystal structure of HIV-1 capsid protein (p24) complexed with a monoclonal antibody Fab. EMBO J. 1999;18(5):1124–1136. doi: 10.1093/emboj/18.5.1124. [DOI] [PMC free article] [PubMed] [Google Scholar]
- Bharat TA, Davey NE, Ulbrich P, Riches JD, de Marco A, Rumlova M, Sachse C, Ruml T, Briggs JA. Structure of the immature retroviral capsid at 8 Å resolution by cryo-electron microscopy. Nature. 2012;487(7407):385–389. doi: 10.1038/nature11169. [DOI] [PubMed] [Google Scholar]
- Briggs JAG, Wilk T, Welker R, Kräusslich HG, Fuller SD. Structural organization of authentic, mature HIV-1 virions and cores. EMBO J. 2003;22:1707–1715. doi: 10.1093/emboj/cdg143. [DOI] [PMC free article] [PubMed] [Google Scholar]
- Briggs JAG, Grunewald K, Glass B, Forster F, Kräusslich HG, Fuller S. The mechanism of HIV-1 core assembly: insights from three-dimensional reconstructions of authentic virions. Structure. 2006;14:15–20. doi: 10.1016/j.str.2005.09.010. [DOI] [PubMed] [Google Scholar]
- Briggs JA, Riches JD, Glass B, Bartonova V, Zanetti G, Krausslich H-G. Structure and assembly of immature HIV. Proc. Natl. Acad. Sci. USA. 2009;106(27):11090–11095. doi: 10.1073/pnas.0903535106. [DOI] [PMC free article] [PubMed] [Google Scholar]
- Brun S, Solignat M, Gay B, Bernard E, Chaloin L, Fenard D, Devaux C, Chazal N, Briant L. VSV-G pseudotyping rescues HIV-1 CA mutations that impair core assembly or stability. Retrovirology. 2008;5:57–71. doi: 10.1186/1742-4690-5-57. [DOI] [PMC free article] [PubMed] [Google Scholar]
- Byeon IJ, Meng X, Jung J, Zhao G, Yang R, Ahn J, Shi J, Concel J, Aiken C, Zhang P, Gronenborn AM. Structural convergence between Cryo-EM and NMR reveals intersubunit interactions critical for HIV-1 capsid function. Cell. 2009;139(4):780–790. doi: 10.1016/j.cell.2009.10.010. [DOI] [PMC free article] [PubMed] [Google Scholar]
- Campbell S, Vogt VM. Self-assembly in vitro of purified CA–NC proteins from Rous sarcoma virus and human immunodeficiency virus type 1. J. Virol. 1995;69:6487–6497. doi: 10.1128/jvi.69.10.6487-6497.1995. [DOI] [PMC free article] [PubMed] [Google Scholar]
- Chen K, Piszczek G, Carter C, Tjandra N. The maturational refolding of the β-hairpin motif of equine infectious anemia virus capsid protein extends its helix α1 at capsid assembly locus. J. Biol. Chem. 2013;288(3):1511–1520. doi: 10.1074/jbc.M112.425140. [DOI] [PMC free article] [PubMed] [Google Scholar]
- Connor RI, Chen BK, Choe S, Landau NR. Vpr is required for efficient replication of human immunodeficiency virus type-1 in mononuclear phagocytes. Virology. 1995;206:935–944. doi: 10.1006/viro.1995.1016. [DOI] [PubMed] [Google Scholar]
- Cortines JR, Monroe EB, Kang S, Prevelige PE., Jr. A retroviral chimeric capsid protein reveals the role of the N-terminal β-hairpin in mature core assembly. J. Mol. Biol. 2011;410(4):641–652. doi: 10.1016/j.jmb.2011.03.052. [DOI] [PMC free article] [PubMed] [Google Scholar]
- DuBridge RB, Tang P, Hsia HC, Leong PM, Miller JH, Calos MP. Analysis of mutation in human cells by using an Epstein–Barr virus shuttle system. Mol. Cell. Biol. 1987;7:379–387. doi: 10.1128/mcb.7.1.379. [DOI] [PMC free article] [PubMed] [Google Scholar]
- Freed EO. HIV-1 gag proteins: diverse functions in the virus life cycle. Virology. 1998;251(1):1–15. doi: 10.1006/viro.1998.9398. [DOI] [PubMed] [Google Scholar]
- Fuller SD, Wilk T, Gowen BE, Kräusslich H-G, Vogt VM. Cryo-electron microscopy reveals ordered domains within the immature HIV-1 particle. Curr. Biol. 1997;7:729–738. doi: 10.1016/s0960-9822(06)00331-9. [DOI] [PubMed] [Google Scholar]
- Gamble TR, Vajdos FF, Yoo S, Worthylake DK, Houseweart M, Sundquist WI, Hill CP. Crystal structure of human cyclophilin A bound to the amino-terminal domain of HIV-1 capsid. Cell. 1996;87(7):1285–1294. doi: 10.1016/s0092-8674(00)81823-1. [DOI] [PubMed] [Google Scholar]
- Gamble T, Yoo S, Vajdos F, von Schwedler U, Worthylake D, Wang H, McCutcheon J, Sundquist W, Hill C. Structure of the carboxy-terminal dimerization domain of the HIV-1 capsid protein. Science. 1997;278:849–853. doi: 10.1126/science.278.5339.849. [DOI] [PubMed] [Google Scholar]
- Ganser-Pornillos BK, von Schwedler UK, Stray KM, Aiken C, Sundquist WI. Assembly properties of the human immunodeficiency virus type 1 CA protein. J. Virol. 2004;78:2545–2552. doi: 10.1128/JVI.78.5.2545-2552.2004. [DOI] [PMC free article] [PubMed] [Google Scholar]
- Ganser-Pornillos BK, Cheng A, Yeager M. Structure of full-length HIV-1 CA: a model for the mature capsid lattice. Cell. 2007;131(1):70–79. doi: 10.1016/j.cell.2007.08.018. [DOI] [PubMed] [Google Scholar]
- Gitti RK, Lee BM, Walker J, Summers MF, Yoo S, Sundquist WI. Structure of the amino-terminal core domain of the HIV-1 capsid protein. Science. 1996;273(5272):231–235. doi: 10.1126/science.273.5272.231. [DOI] [PubMed] [Google Scholar]
- Gross I, Hohenberg H, Huckhagel C, Kräusslich HG. N-terminal extension of human immunodeficiency virus capsid protein converts the in vitro assembly phenotype from tubular to spherical particles. J. Virol. 1998;72:4798–4810. doi: 10.1128/jvi.72.6.4798-4810.1998. [DOI] [PMC free article] [PubMed] [Google Scholar]
- Hermida-Matsumoto L, Resh MD. Human immunodeficiency virus type 1 protease triggers a myristoyl switch that modulates membrane binding of Pr55(gag) and p17MA. J. Virol. 1999;73(3):1902–1908. doi: 10.1128/jvi.73.3.1902-1908.1999. [DOI] [PMC free article] [PubMed] [Google Scholar]
- Huseby D, Barklis RL, Alfadhli A, Barklis E. Assembly of human immunodeficiency virus precursor Gag proteins. J. Biol. Chem. 2005;280:17664–17670. doi: 10.1074/jbc.M412325200. [DOI] [PubMed] [Google Scholar]
- Kabat D, Kozak SL, Wehrly K, Chesebro B. Differences in CD4 dependence for infectivity of laboratory-adapted and primary patient isolates of human immunodeficiency virus type 1. J. Virol. 1994;68:2570–2577. doi: 10.1128/jvi.68.4.2570-2577.1994. [DOI] [PMC free article] [PubMed] [Google Scholar]
- Lanman J, Sexton J, Sakalian M, Prevelige P. Kinetic analysis of the role of intersubunit interactions in human immunodeficiency virus type 1 capsid protein assembly in vitro. J. Virol. 2002;76:6900–6908. doi: 10.1128/JVI.76.14.6900-6908.2002. [DOI] [PMC free article] [PubMed] [Google Scholar]
- Li S, Hill CP, Sundquist WI, Finch JT. Image reconstructions of helical assemblies of the HIV-1 CA protein. Nature. 2000;407:409–413. doi: 10.1038/35030177. [DOI] [PubMed] [Google Scholar]
- López CS, Eccles JD, Still A, Sloan RE, Barklis RL, Tsagli SM, Barklis E. Determinants of the HIV-1 core assembly pathway. Virology. 2011;417(1):137–146. doi: 10.1016/j.virol.2011.05.011. [DOI] [PMC free article] [PubMed] [Google Scholar]
- Mervis RJ, Ahmad N, Lillehoj EP, Raum MG, Salazar FH, Chan HW, Venkatesan S. The gag gene products of human immunodeficiency virus type 1: alignment within the gag open reading frame, identification of posttranslational modifications, and evidence for alternative gag precursors. J. Virol. 1988;62(11):3993–4002. doi: 10.1128/jvi.62.11.3993-4002.1988. [DOI] [PMC free article] [PubMed] [Google Scholar]
- Momany C, Kovari LC, Prongay AJ, Keller W, Gitti RK, Lee BM, Gorbalenya AE, Tong L, McClure J, Ehrlich LS, Summers MF, Carter C. Crystal structure of dimeric HIV-1 capsid protein. Nat. Struct. Biol. 1996;3(9):763–770. doi: 10.1038/nsb0996-763. [DOI] [PubMed] [Google Scholar]
- Monroe EB, Kang S, Kyere SK, Li R, Prevelige PE., Jr. Hydrogen/deuterium exchange analysis of HIV-1 capsid assembly and maturation. Structure. 2010;18(11):1483–1491. doi: 10.1016/j.str.2010.08.016. [DOI] [PMC free article] [PubMed] [Google Scholar]
- Noviello CM, López CS, Kukull B, McNett H, Still A, Eccles J, Sloan R, Barklis E. Second-site compensatory mutations of HIV-1 capsid mutations. J. Virol. 2011;85(10):4730–4738. doi: 10.1128/JVI.00099-11. [DOI] [PMC free article] [PubMed] [Google Scholar]
- Ono A, Demirov D, Freed EO. Relationship between human immunode-ficiency virus type 1 Gag multimerization and membrane binding. J. Virol. 2000;74:5142–5150. doi: 10.1128/jvi.74.11.5142-5150.2000. [DOI] [PMC free article] [PubMed] [Google Scholar]
- Pornillos O, Ganser-Pornillos BK, Kelly BN, Hua Y, Whitby FG, Stout CD, Sundquist WI, Hill CP, Yeager M. X-ray structures of the hexameric building block of the HIV capsid. Cell. 2009;137(7):1282–1292. doi: 10.1016/j.cell.2009.04.063. [DOI] [PMC free article] [PubMed] [Google Scholar]
- Pornillos O, Ganser-Pornillos BK, Banumathi S, Hua Y, Yeager M. Disulfide bond stabilization of the hexameric capsomer of human immunode-ficiency virus. J. Mol. Biol. 2010;401(5):985–995. doi: 10.1016/j.jmb.2010.06.042. [DOI] [PMC free article] [PubMed] [Google Scholar]
- Pornillos O, Ganser-Pornillos BK, Yeager M. Atomic-level modelling of the HIV capsid. Nature. 2011;469(7330):424–427. doi: 10.1038/nature09640. [DOI] [PMC free article] [PubMed] [Google Scholar]
- Reicin AS, Öhagen Å, Yin L, Höglund S, Goff SP. The role of Gag in human immunodeficiency virus type 1 virion morphogenesis and early steps of the viral life cycle. J. Virol. 1996;70:8645–8652. doi: 10.1128/jvi.70.12.8645-8652.1996. [DOI] [PMC free article] [PubMed] [Google Scholar]
- Scholz I, Arvidson B, Huseby D, Barklis E. Virus particle core defects caused by mutations in the human immunodeficiency virus capsid N-terminal domain. J. Virol. 2005;79(3):1470–1479. doi: 10.1128/JVI.79.3.1470-1479.2005. [DOI] [PMC free article] [PubMed] [Google Scholar]
- Scholz I, Still A, Dhenub TC, Coday K, Webb M, Barklis E. Analysis of human immunodeficiency virus matrix domain replacements. Virology. 2008;371:322–335. doi: 10.1016/j.virol.2007.10.010. [DOI] [PMC free article] [PubMed] [Google Scholar]
- Spearman P, Wang JJ, Vander Heyden N, Ratner L. Identification of human immunodeficiency virus type 1 Gag protein domains essential to membrane binding and particle assembly. J. Virol. 1994;68:3232–3242. doi: 10.1128/jvi.68.5.3232-3242.1994. [DOI] [PMC free article] [PubMed] [Google Scholar]
- Tang C, Ndassa Y, Summers MF. Structure of the N-terminal 283-residue fragment of the immature HIV-1 Gag polyprotein. Nat. Struct. Biol/ 2002;9(7):537–543. doi: 10.1038/nsb806. [DOI] [PubMed] [Google Scholar]
- von Schwedler U, Stemmler T, Klishko V, Li S, Albertine K, Davis D, Sundquist W. Proteolytic refolding of the HIV-1 capsid protein amino-terminus facilitates viral core assembly. EMBO J. 1998;17:1555–1568. doi: 10.1093/emboj/17.6.1555. [DOI] [PMC free article] [PubMed] [Google Scholar]
- Wang CT, Lai HY, Li JJ. Analysis of minimal human immunodeficiency virus type 1 gag coding sequences capable of virus-like particle assembly and release. J. Virol. 1998;72(10):7950–7959. doi: 10.1128/jvi.72.10.7950-7959.1998. [DOI] [PMC free article] [PubMed] [Google Scholar]
- Wilk T, Gross I, Gowen B, Rutten T, de Haas F, Welker R, Krausslich H-G, Boulanger P, Fuller S. Organization of immature human immunodeficiency virus type 1. J. Virol. 2001;75(2):759–771. doi: 10.1128/JVI.75.2.759-771.2001. [DOI] [PMC free article] [PubMed] [Google Scholar]
- Wills JW, Craven RC. Form, function, and use of retroviral gag proteins. AIDS. 1991;5:639–654. doi: 10.1097/00002030-199106000-00002. [DOI] [PubMed] [Google Scholar]
- Wong HC, Shin R, Krishna NR. Solution structure of a double mutant of the carboxy-terminal dimerization domain of the HIV-1 capsid protein. Biochemistry. 2008;47(8):2289–2297. doi: 10.1021/bi7022128. [DOI] [PubMed] [Google Scholar]
- Worthylake DK, Wang H, Yoo S, Sundquist WI, Hill CP. Structures of the HIV-1 capsid protein dimerization domain at 2.6 A resolution. Acta Crystallogr. D Biol. Crystallogr. 1999;55(Part 1):85–92. doi: 10.1107/S0907444998007689. [DOI] [PubMed] [Google Scholar]
- Wright E, Schooler J, Ding HJ, Kieffer C, Fillmore C, Sundquist WI, Jensen G. Electron cryotomography of immature HIV-1 virions reveals the structure of the CA and SP1 gag shells. EMBO J. 2007;26(8):2218–2226. doi: 10.1038/sj.emboj.7601664. [DOI] [PMC free article] [PubMed] [Google Scholar]
- Yu X, Wang Q, Yang JC, Buch I, Tsai CJ, Ma B, Cheng SZ, Nussinov R, Zheng J. Mutational analysis and allosteric effects in the HIV-1 capsid protein carboxyl-terminal dimerization domain. Biomacromolecules. 2009;10(2):390–399. doi: 10.1021/bm801151r. [DOI] [PMC free article] [PubMed] [Google Scholar]
- Zhao G, Perilla JR, Yufenyuy EL, Meng X, Chen B, Ning J, Ahn J, Gronenborn AM, Schulten K, Aiken C, Zhang P. Mature HIV-1 capsid structure by cryo-electron microscopy and all-atom molecular dynamics. Nature. 2013;497(7451):643–646. doi: 10.1038/nature12162. [DOI] [PMC free article] [PubMed] [Google Scholar]