

Abstract
This study aimed at identifying all of the type I interferon (IFN) genes of the horse and at monitoring their expression in equine cells on in vitro induction. We identified 32 putative type I IFN loci on horse chromosome 23 and an unplaced genomic scaffold. A phylogentic analysis characterized these into 8 different type I IFN classes, that is, putative functional genes for 6 IFN-α, 4 IFN-β, 8 IFN-ω (plus 4 pseudogenes), 3 IFN-δ (plus 1 pseudogene), 1 IFN-κ and 1 IFN-ɛ, plus 1 IFN-ν pseudogene, and 3 loci belonging to what has previously been called IFN-αω. Our analyses indicate that the IFN-αω genes are quite distinct from both IFN-α and IFN-ω, and we refer to this type I IFN as IFN-μ. Results from cell cultures showed that leukocytes readily expressed IFN-α, IFN-β, IFN-δ, IFN-μ, and IFN-ω mRNA on induction with, for example, live virus; while fibroblasts only expressed IFN-β mRNA on stimulation. IFN-κ or IFN-ɛ expression was not consistently induced in these cell cultures. Thus, the equine type I IFN family comprised 8 classes, 7 of which had putative functional genes, and mRNA expression of 5 was induced in vitro. Moreover, a relatively low number of IFN-α subtypes was found in the horse compared with other eutherian mammals.
Introduction
Type I interferons (IFNs) belong to a family of closely related small proteins that are encoded by intronless genes. The type I IFN family of placental mammals comprises 9 recognized classes identified to date: IFN-α, IFN-β, IFN-δ, IFN-ɛ, IFN-κ, IFN-τ, IFN-ω, IFN-ν, and IFN-ζ (Krause and Pestka 2005; Samarajiwa and others 2006). Some of these IFNs have a limited taxonomic distribution, such as IFN-τ in ruminants and IFN-ζ (also known as limitin) in mice; while IFN-α, IFN-β, and IFN-ω seem to be present in most of the mammalian species studied. Some of these classes also comprise several different subtypes, with the IFN-α subtypes being the most extensively studied so far. Most examined species have a multitude of IFN-α subtypes; for instance, humans appear to have 13 different IFN-α subtypes, while cattle, mice, and cats have 14, pigs have 17, dogs have 9, and rats have 18 (Woelk and others 2007; Sang and others 2010). These subtypes seem to display slight functional differences, for example, in their antiviral activity (Pestka and others 2004; Sang and others 2010).
So far, most information on the type I IFN system is derived from studies of humans and mice, and IFN-α and IFN-β are, by far, the best studied. As a generalization of current knowledge, the majority of nucleated cells are capable of type I IFN production on, for example, virus infection. Nonimmune cells (eg, fibroblasts and epithelial cells) mainly produce IFN-β, while hematopoietic cells may produce IFN-α, IFN-β, and IFN-ω (Takaoka and Yanai 2006). Moreover, during the last decade, knowledge about induction of IFN-α/β production has increased dramatically, for example, by identification of both type I IFN inducers and the receptors involved in their recognition. Mainly different forms of nucleic acid, but also viral glycoproteins and bacterial lipopolysaccaride (LPS), have been identified as so-called pathogen-associated molecular patterns that induce the production of IFN-α/β (reviewed in Kawai and Akira 2010; Onomoto and others 2010; Rathinam and Fitzgerald 2011). Among pattern recognition receptors, both intra-cytoplasmatic RNA and DNA receptors, as well as endosomal and cell-surface Toll-like receptors (TLR) that confer IFN-α/β induction, have been identified.
Specific knowledge about the equine type I IFN system is still limited, and research has been hampered by a lack of species-specific reagents. An early study of horse type I IFN genes (Himmler and others 1986) presented the sequences of 4 IFN-α, 1 IFN-β, and 2 IFN-ω genes, and based on results from Southern blotting, 7 IFN-α, 2 IFN-β, and 8 IFN-ω genes were predicted. With regard to other type I IFN classes, Lefevre and others (1998) predicted at least 1 functional IFN-δ gene in the equine genome, which was subsequently confirmed (Cochet and others 2009) when 2 equine IFN-δ genes were sequenced and shown to be expressed in the early horse conceptus.
Equine type I IFNs have also been studied in vivo and in vitro, mainly using anti-viral activity or mRNA expression as readout. For instance, during viral infections, IFN-activity has been detected in serum and/or nasal secretions from horses infected with equine herpes virus 1 (EHV-1) and EHV-4, equine influenza A2 virus, and equine infectious anaemia virus (Edington and others 1989a; Chong and Duffus 1992; Tornquist and others 1997; Jensen-Waern and others 1998; Wattrang and others 2003). In the case of equine influenza A2 virus, we have also shown that type I IFNs other than IFN-α dominated the responses observed in nasal secretions and serum (Wagner and others 2008). On in vitro stimulation of equine cell cultures, IFN activity and/or IFN-α/β mRNA expression has been induced with a number of DNA and RNA viruses (Yilma and others 1982; Edington and others 1989b; Jensen-Waern and others 1998; Quinlivan and others 2005; Wattrang and others 2005; Garcia-Tapia and others 2006; Horohov and others 2008; Wagner and others 2008; Wagner and others 2011), and by using defined molecules, for example, polyinosine-polycytidylic acid (poly I:C) complexed with DEAE-dextran (Yilma and others 1982), poly I:C alone (Figueiredo and others 2009b; Mignot and others 2012), or unmethylated cytosine–guanosine sequence containing DNA (CpG-DNA; (Wattrang and others 2005; Flaminio and others 2007; Wagner and others 2008; Wattrang and others 2012).
The aim of the present study was to annotate all of the horse type I IFN loci using the NCBI Equus caballus genome build 2.0, and to study the mRNA expression of the different type I IFNs in equine cells on in vitro stimulation with viruses or specific IFN inducers that are known to trigger some of the TLR or cytoplasmic nucleic acid receptors. In addition, an IFN-α ELISA was used to verify the correlation between gene expression and protein secretion.
Materials and Methods
Horses and cell lines
The collection of blood samples for this experiment was approved by the Ethical Committee for Animal Experiments, Uppsala, Sweden (decision C 188/8). For the setup and validation of real-time PCRs, PBMCs isolated from blood collected from 17 different clinically healthy horses were used. For the ultimate induction experiment, blood from 13 different clinically healthy horses was used for PBMC isolation. These horses comprised 9 mares and 4 geldings aged between 5 and 20 years of the following breeds: 6 Swedish Warmbloods, 2 Dutch Warmbloods (KWPN), 2 Thoroughbreds, 1 Connemara pony, 1 pony of unknown breed, and 1 Irish Sport horse (KWPN–Thoroughbred cross).
Cell cultures
Blood samples were taken from the jugular veins into evacuated glass tubes with 143 USP heparin (BD Vacutainer, Meylan, France). PBMC were purified from heparinized leukocyte-rich plasma by centrifugation on Ficoll-Paque PLUS (Amersham Biosciences AB, Uppsala, Sweden), washed in phosphate-buffered saline (PBS), and re-suspended in complete RPMI, that is, RPMI 1640 (National Veterinary Institute, Uppsala, Sweden), supplemented with 2 mM l-glutamine, 200 IU penicillin/mL, 100 μg streptomycin/mL, 50 μM 2-mercaptoethanol, and 10% fetal calf serum (FCS; Myoclone, Gibco Paisley, United Kingdom).
PBMC or EqT8888 cells were seeded in complete RPMI with or without addition of type I IFN inducers, using flat-bottomed 24-well plates (Nunc, Roskilde, Denmark) at 5×10⁶ cells with 1 mL/well or round-bottomed 96-well plates (Cellstar, greiner bio-one, Wemmel, Belgium) at 106 cells with 200 μL/well. EEL cells at passage 13 or 14 were seeded at 1×10⁵ cells with 500 μL/well in flat-bottomed 24-well plates in EMEM (National Veterinary Institute) supplemented with 2 mM l-glutamine, 200 IU penicillin/mL, 100 μg streptomycin/mL, 1% nonessential amino acids, 0.5% NaHCO3, and 10% FCS (Myoclone, Gibco), and then incubated for 24 h at 37°C, 5% CO2 in air in a humid atmosphere. After this incubation, cells were ∼80% confluent, and the cell culture medium was discarded and replaced with complete RPMI with or without addition of type I IFN inducers. All induction cultures were cultured at 37°C, 5% CO2 in air in a humid atmosphere. After 6 h induction, cells were harvested for RNA extraction (24-well plates), while parallel cultures were incubated further, and cell culture supernatants were collected 24 h poststimulation for analysis in the IFN-α ELISA (96-well plates). These harvesting time points were selected based on kinetics experiments with horse PBMC (Wattrang and others 2005, and also unpublished experiments), showing maximum IFN-α and IFN-β mRNA expression at 6 h poststimulation and maximum IFN-bioactivity at 24 h poststimulation. The following inducers were used: (1) live Sendai virus (SV) that was propagated in embryonated hens' eggs and used as chorioallantoic fluid at a final dilution of 1/100 in complete RPMI; (2) live EHV-1 (kind gift from Dr L. Treiberg–Berndtsson, National Veterinary Institute, Uppsala, Sweden) propagated in EEL cells and used as a cell culture supernatant at a final dilution of 1/100 in complete RPMI; (3) 2395 (Vollmer and others 2004), a complete phosphorothioate oligodeoxyribonucleotide (ODN) synthesized by CyberGene AB (Huddinge, Sweden), cartridge purified, and used at a final concentration of 1 μg/mL; (4) LPS from Escherichia coli O55:B5 (Sigma-Aldrich, St. Louis, MI) at a final concentration of 1 μg/mL; (5) double-stranded (ds) poly I:C complexed with the cationic lipid transfection reagent LyoVec™ (polyI:C/LyoVec) at a concentration of 1 μg/mL; and (6) single-stranded (ss) poly-uridine complexed with LyoVec™ (poly-U/LyoVec) at a concentration of 1 μg/mL, both of which were from InvivoGen (San Diego, CA). Each inducer was used with PBMC from ≥6 individual horses and in 3 different experiments using EEL and EqT8888 cells.
Genetic analysis of equine type I IFN genes
The complete cluster of type I IFN loci (genes and pseudogenes) in the horse genome was annotated using the sequence data for type I IFN genes retrieved from the NCBI GenBank databases (www.ncbi.nlm.nih.gov). Equine, porcine, and human IFN-α, IFN-β, and IFN-ω, porcine, and human IFN-ɛ, porcine IFN-δ, human IFN-κ, and bovine IFN-τ gene sequences were used to search the NCBI Equus caballus genome build 2.0 (Eca2.0) using the BLASTN algorithm. All matching sequences were collected and used for further searches. The nucleotide sequences were aligned along with those of currently known mammalian type I IFN genes. Sequences that contained introns or did not align consistently were eliminated, and the remaining sequences were translated to amino acid-sequences and then used for search of the Eca2.0 RefSeqProtein database using the BLASTP algorithm. All of the subsequent matching nucleotide sequences were used in a final BLASTN analysis of Eca2.0.
The final collection of equine type I IFN sequences (Table 1) was then aligned with all of the type I IFN sequences from the pig genome (see Sang and others 2010), plus those of human and cow (including all of the IFN-α sequences) compiled by Woelk and others (2007), plus extra mammalian sequences from GenBank for IFN-ν and IFN-μ. We used the PROMALS program (Pei and Grishin 2007) server (http://prodata.swmed.edu/promals/promals.php), based on amino-acid translations of the original nucleotide sequences.
Table 1.
Suggested Annotation, mRNA Accession Numbers, and Chromosomal Location of Type I IFN Genes Identified in the Horse Genome (Eca2.0)
| Annotationa | mRNA accession | Assembly position in NW_001867394 | Locus nameb |
|---|---|---|---|
| Chromosome 23 genomic scaffold | |||
| IFNNP |
— |
40074597.40075182,complement |
— |
| IFNB1 |
XM_001917573 |
40099096.40099656,complement |
LOC100147174 |
| IFNM1 |
XM_001495466 |
40117735.40118292,complement |
LOC100064612 |
|
IFNW1 |
— |
40121629.40122215 |
LOC100064646 |
| IFNW2 |
NM_001114536 |
40152950.40153537,complement |
IFN-OMEGA2 |
| IFNWP3 |
— |
40162981.40163571,complement |
— |
| IFNA1 |
NM_001114537 |
40167843.40168397,complement |
IFN-ALPHA2 |
| IFNW4 |
XM_003363959 |
40177599.40178186,complement |
LOC100629859 |
| IFNWP5 |
— |
40187380.40187946,complement |
LOC100629844 |
| IFNA2 |
NM_001114538 |
40194470.40195024,complement |
LOC100052921 |
| IFND1 |
XM_003363960 |
40202736.40203239,complement |
LOC100629885 |
| IFNW6 |
XM_001497454 |
40240969.40241556 |
LOC100052971 |
| IFNDP2 |
— |
40244519.40245015 |
LOC100629867 |
|
IFNA3 |
XM_003363961 |
40250929.40251483 |
LOC100629951 |
| IFNWP7 |
— |
40254018.40254568 |
— |
| IFNW8 |
XM_001497499 |
40283225.40283812 |
LOC100053069 |
| IFND3 |
NM_001143795 |
40303189.40303692 |
IFND1 |
| IFNA4 |
— |
40310846.40311400 |
LOC100053110 |
| IFND4 |
NM_001143796 |
40338316.40338828 |
IFND2 |
| IFNA5 |
NM_001099441 |
40343979.40344533 |
IFNA1 |
| IFNWP9 |
— |
40348098.40348656 |
LOC100629915 |
| IFNA6 |
— |
40352208.40352762 |
LOC100053210 |
| IFNW10 |
XM_001497725 |
40364703.40365290 |
LOC100053263 |
| IFNE |
— |
40388424.40389005,complement |
LOC100065067 |
| IFNK |
XM_001497183 |
45255309.45255935 |
LOC100067055 |
| Unplaced genomic scaffold | |||
| IFNB2 |
NM_001099440 |
3441.4001,complement |
IFNB1 |
| IFNM2 |
XM_001495370 |
24208.24765,complement |
LOC100064468 |
| IFNW11 |
NM_001083595 |
27968.28555 |
IFN-OMEGA1 |
| IFNB3 |
XM_001496900 |
50626.51186,complement |
LOC100052658 |
| IFNM3 |
XM_001916512 |
69398.69955,complement |
LOC100064551 |
| IFNW12 |
— |
73291.73877 |
LOC100064579 |
| IFNB4 | XM_001496994 | 88573.89133,complement | LOC100052708 |
The multiple type I IFN class genes are numbered according to their chromosomal location.
Locus annotation in the genome assembly. Note that these names do not necessarily match our annotation.
IFN, interferon; P, pseudogene.
Preliminary phylogenetic analyses of the alignment indicated that 3 of the horse gene sequences did not cluster with any of the named type I IFN sequences. Therefore, further BLASTN searches were conducted in the GenBank nr/nt database and in those 47 mammalian genome databases with >100 MB of sequence data (www.ncbi.nlm.nih.gov/genome), with each of these 3 horse genes as the query sequence. The resulting 73 closest matching sequences were retained for further phylogenetic analysis (another 36 sequence fragments were excluded).
Phylogenetic trees were produced via both distance and maximum-likelihood algorithms, using the PAUP* (version 4.0b10) (Swofford 2002) and RAxML (version 7.2.8) Stamatakis 2006) packages, respectively. The distance heuristic searches used 100 random-addition sequences of TBR branch swapping, based on the HKY85+I+G nucleotide distance (the I and G parameters were estimated by maximum likelihood based on a preliminary tree). Maximum-likelihood heuristic searches used 10 starting trees, based on the PROTGAMMA-JTTF substitution model (determined after preliminary testing with the ProteinModelSelection option). Support for the phylogenies was measured by bootstrapping, based on 1,000 pseudoreplicates. Predicted peptide sequences from putative functional type I IFN sequences were analyzed in the NCBI-conserved domain database (CDD; www.ncbi.nlm.nih.gov/cdd) and via the DNASP (version 4.50.3; Rozas and others 2003) program.
RNA extraction, complementary DNA synthesis
RNA was isolated after 6 h of incubation from cells cultured in 24-well plates. Both nonadherent and adherent cells in each well were lysed in a total volume of 800 μL TRizol (Invitrogen, Paisley, United Kingdom) and stored at −80°C until RNA isolation. RNA isolation was performed by phenol/chloroform extraction and isopropyl alcohol precipitation according to the TRizol manufacturer's protocol. At the end of the procedure, the RNA pellet was briefly air dried and re-suspended in RNase free DEPC water. To avoid amplification of contaminating genomic DNA, DNase treatment was performed using RQ1 RNase-Free DNase™ (Promega, Madison, WI) according to the manufacturer's protocol. Next, complementary DNA (cDNA) was synthesized using High-Capacity RNA-to-cDNA Master Mix™ (Applied Biosystems, Carlsbad, CA) according to the manufacturer's protocol. As a control for genomic contamination, parallel preparations of RNA were subjected to the cDNA synthesizing process without addition of reverse transcriptase, that is, an “NO-RT” control. cDNA templates were stored at −20 °C until amplification procedures were completed.
Real-time quantitative PCR
Real-time quantitative PCR (qPCR) assays using Power SYBR® Green PCR Master Mix (Applied Biosystems) as a detector were performed on a ROTOR GENE (Corbett LifeScience, Qiagen, Valencia, CA). The 7 target genes of interest in this study were encoding equine IFN-α, IFN-β, IFN-δ, IFN-ɛ, IFN-κ, IFN-μ, and IFN-ω. β-2-microglobuline (β2M) and glyceraldehyde-3-phosphate dehydrogenase (GAPDH) served as endogenous controls, that is, housekeeping genes (HKG; Table 2). Oligonucleotide primers used for the detection of cDNA specific for equine IFNs were designed by Beacon Designer (Premier Biosoft International, Palo Alta, CA) based on the sequence analysis described earlier. Primers were designed to detect all subtype genes of each type I IFN class. Primer concentrations were optimized as previously described (Figueiredo and others 2009a), by identifying the lowest primer concentration that yielded the lowest Ct value, the maximum DRn, the generation of a single amplicon of correct size, and a melting curve showing a single peak. Real-time qPCR assays were performed in a final volume of 25 μL containing 12.5 μL of 2× Power SYBR Green PCR Master Mix, 2 μL of cDNA sample, the optimized primer concentrations as indicated in Table 2, and DEPC water. Conditions for amplification were 10 min at 95°C, followed by 45 cycles of 15 s at 95°C, and 60 s at 60°C for primer annealing and elongation of β2M, GAPDH, IFN-α, IFN-β, IFN-δ, IFN-ɛ, IFN-κ, and IFN-μ. For IFN-ω, annealing and elongation temperatures were 30 s at 54°C and 60 s at 60°C, respectively.
Table 2.
Efficiency, Primer Concentrations, Primer Sequences, and PCR Product Length for Real-Time RT-PCR Used to Quantify mRNA Expression of the Indicated Equine Type I IFNs and Housekeeping Genes
| Target | Efficiencya | Primer conc.Fwd/Rev (nM) | Forward primer sequence 5′ to 3′ | Reverse primer sequence 5′ to 3′ | Product length (bp) |
|---|---|---|---|---|---|
| β2M |
105.0% |
200/200 |
TGAGTATAGTTGCCGTGTA |
ATGCTGGTTAGAGGTCTC |
80 |
| GAPDH |
96.9% |
200/200 |
TAACTCTGGCAAAGTGGAT |
CCTGGAAGATGGTGATGG |
167 |
| IFN-α |
102.0% |
200/200 |
TCCATGAGACGATCCAACAGATC |
ATAGAGTCCAGTGTAGAGCTTGTC |
101 |
| IFN-μ |
95.9% |
200/200 |
CCTTCCATCTCTTCAGCACCAC |
CCTTCGTCTCCTTCCCCAAAC |
126 |
| IFN-β |
108.0% |
200/200 |
CTCCACCACGGCTCTTTCTG |
CTGCTGTGCTTGCTCAATCTC |
163 |
| IFN-κ |
96.8% |
800/800 |
GAAGAGAAGGAAAACGAAGACATG |
GAAACATCTTCTGATTTCCACTCG |
189 |
| IFN-δ |
93.5% |
200/200 |
CRGSAGATCATCAACCTCTTCAAC |
RCAAGCCAGRTTTTCTYCTTCC |
135 |
| IFN-ɛ |
92.0% |
200/200 |
ACGTTCCTCATCGAACTTCATC |
CGGTTGATTTCTACTTGGACAATG |
200 |
| IFN-ω | 98.2% | 800/800 | TGAMAGAGAAGAAATACAGTG | TGHTGATGAAGAGAAGGA | 77 |
Calculated as E=10(−1/slope)×100; for details, see Results section “Establishment of real-time qPCR assays.”
For degenerate primers: R: G or A; S: G or C; Y: T or C; M: A or C; H: A or C or T.
Fwd, forward; Rev, reverse; β2M, β-2-microglobuline; GAPDH, glyceraldehyde-3-phosphate dehydrogenase.
Relative quantification of target gene expression to HKG was calculated using the ΔCt method, presented as 2(Ct HKG-Ct target) (Livak and Schmittgen 2001; Morse and others 2005). Since confidence intervals (CI) of proportions were asymmetrical and thus non-normally distributed, the arithmetic means and CI of relative type I IFN mRNA expression were estimated based on a square-root transformation according to the method of Land (1974). The level of expression of type I IFN showed a large variation between individuals. This was expected considering the use of noninbred animals and earlier observations of type I IFN production (Wattrang and others 2005; Wattrang and others 2012). Hence, each inducer was tested with ≥6 individuals to obtain a representative sample. Moreover, due to the large inter-individual variation, no standard statistical model is likely to be applicable to these results, and, therefore, mean values with nonoverlapping CI were interpreted as being statistically different.
ELISA for equine IFN-α
The amount of IFN-α released into cell culture supernatants was determined using an equine IFN-α specific ELISA described earlier (Wagner and others 2008). In brief, the ELISA is based on 2 anti-IFN-α mAbs: clone 29B used for coating and a biotin-conjugated clone 240–2 used for tracing. The ELISA was performed in flat-bottomed 96-well plates (MaxiSorp; Nunc). PBS with 4% bovine serum albumin (Sigma-Aldrich) was used for blocking and as a sample diluent, horseradish peroxidase-conjugated streptavidin (AbD-Serotec, Oxford, United Kingdom) was used for detection of antibody binding; PBS with 0.05% Tween 20 (Sigma-Aldrich) was used as the wash buffer, and an in-house substrate buffer (1 mM 3,5,3′,5′-tetrametylbenzidine in 0.1 M potassium citrate, pH 4.2, with 0.007% H2O2) was used for visualization of antibody binding. This reaction was stopped with 2 M H2SO4, and the A450 was measured in an ELISA reader. The IFN-α concentration in the samples was calculated by linear regression from serial dilutions of a preparation of native equine IFN-α (Wagner and others 2008), and the ELISA's linear range of detection was between 3 and 100 U IFN-activity/mL.
Results
Analysis of the equine type I IFN gene family
BLAST analysis of the current version of the horse genome revealed a cluster of putative type I IFN genes on equine chromosome 23 (ECC23; NW_001867394) and another on an unplaced genomic scaffold (NW_001868480), with 1 gene (IFN-κ) isolated from the other type I IFN genes on chromoseome 23 and 1 putative gene (Drosophila kelch-like 9) interrupting the chromosomal cluster (Fig. 1). In the previous version of the horse genome (Eca1.1), these 2 genomic clusters of sequences were annotated as being a part of chromosome 23 (ECC23; NW_001799690). In Eca1.1, we previously identified 31 putative genes; whereas there are 32 in Eca2.0, with an extra IFN-β gene. It is likely that a future annotation of the horse genome will resolve these separate genomic sequences as a part of the same chromosome, possibly with a fewer genes (communication with the Broad Institute, which is responsible for the horse genome annotation, could not resolve the discrepancy at present).
FIG. 1.
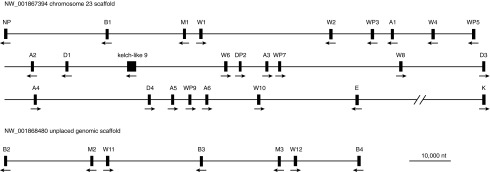
Scale map of the relative positions of the type I IFN genes in the horse genome (Eca2.0). The genes are labeled as in Table 1; and their orientation is indicated by arrows.
The multiple-sequence alignment of the Eca2.0 genes revealed quite a few mis-annotations of the boundaries of the gene sequences, as well as a failure to identify some of the pseudogenes. The Eca2.0 annotation is compared in detail with our annotation in Appendix 1 (See Supplementary Data; Supplementary Data are available online at www.liebertpub.com/jir). There were also mis-annotations of the gene boundaries in the pig genome (Sang and others 2010) of genes GQ415087 IFN-ω-1, GQ415088 IFN-ω-2, GQ415075 IFN-δ-2, and GQ415080 IFN-δ-7.
The 32 equine sequences identified as type I IFN loci (Table 1) were compared to known mammalian type I IFN genes using phylogenetic analysis (Fig. 2). This identified the loci as potential coding genes for 6 IFN-α, 4 IFN-β, 8 IFN-ω (plus 4 pseudogenes), 3 IFN-δ (plus 1 pseudogene), 1 IFN-κ, and 1 IFN-ɛ, plus 1 IFN-ν pseudogene (Table 1, Fig. 2). No IFN-τ or IFN-ζ loci were identified.
FIG. 2.

Maximum-likelihood phylogenetic tree of the collection of type I IFN sequences. Only the horse sequences are labeled with their database accession numbers (the “M” numbers are from the GenBank database, and the others are mRNA or locus numbers from the horse genome). The IFN groups are indicated for the other sequences, based on their current database annotations. The scale indicates the expected number of amino-acid substitutions. The numbers on the branches indicate the% bootstrap support based on the maximum-likelihood and distance analyses, respectively; values are shown only for the main branches. A dash indicates that the branch did not have a value >50%. The distance tree differs from the one shown in 2 ways: IFN-ν is the sister group to IFN-ɛ, and IFN-μ is the sister to the IFN-α+IFN-ω+IFN-τ group.
In addition, 3 loci that were closely related to each other were identified as belonging to what Krause and Pestka (2005) call type I IFN-αω. However, our analyses indicate that these sequences are quite distinct from both IFN-α and IFN-ω, and, therefore, are worthy of recognition in their own right, at least phylogenetically. We will refer to this type I IFN as IFN-μ. Extensive BLAST analyses of all of the available databases revealed 23 similar sequences that cluster with the IFN-μ genes in the phylogenetic analyses (the other 50 tested database sequences clustered conclusively with either IFN-α or IFN-ω), from 15 species listed in Appendix 2 (See Supplementary Data). No IFN-μ sequences were found in either primates or rodents, in spite of searching in the extensive genomic data available for several species, nor in marsupials or monotremes.
Both phylogenetic analyses also identified 2 other sequences that did not cluster with any of the named type I IFN sequences: Tupaia belangeri (AAPY01564707 positions 785.1341) and Choloepus hoffmanni (ABVD01137885 positions 6638.7201). We did not further investigate this intriguing result.
The predicted amino-acid sequences for all potentially functional horse type I IFN genes were also analyzed for conserved functional domains using the NCBI CDD. This analysis showed that they all contained IFab (cd00095), Interferon (pfam00143), and IFabd (smart00076) domains, further confirming their identity and predicting their function as type I IFNs. Moreover, all of the sequences contained multiple putative binding sites for the type I IFN receptor (IFNAR) subunit 1 and 2 and a N-glycosylation site (all predicted to be in the same locations in all of the sequences), which are criteria for the IFab domain and important for function and peptide stability.
The analysis for conserved functional domains revealed that all of the putative horse type I IFN-gene sequences had 6 alpha helices, predicted to be in the same location in all sequences. This contrasts with the 5 alpha helices reported by Sang and others (2010) for a similar analysis of the type I IFN sequences in the pig genome. The multiple amino-acid alignment of the 26 coding sequences revealed 13 conserved residues: 3 Leu, 2 Cys, 2 Phe, and 1 each of Ala, Ile, Pro, Trp, Tyr, and Val. Three other residues are conserved except for IFN-ɛ: Gln, Lys, and Trp; and one other residue is not conserved in IFN-δ: Ser. The 2 conserved Cys are in the same location as those reported by Sang and others (2010) for the pig genome.
Except for IFN-δ, the length of the open reading frame (ORF) of each type I IFN was invariant (Table 3). Sang and others (2010) reported variable ORF lengths, with “short and long” subtypes of the IFN-α, IFN-β, and IFN-ω classes in the pig genome. However, this seems to have resulted from mis-annotation of the C-terminus of 4 of their putative gene sequences (see above), and these subtypes are, in fact, invariant in length.
Table 3.
Characteristics of the Coding Sequences of Type I IFN Genes Identified in the Horse Genome
| Type I IFN | Number of genes | Peptide length (amino acids) | Nucleotide diversitya | Number of invariable sitesa | Number of polymorphic sitesa | Number of segregating sitesa | Number of synonymous sitesa | Number of replacement sitesa |
|---|---|---|---|---|---|---|---|---|
| IFN-α |
6 |
184 |
0.013 |
537 |
15 |
13 |
7 |
6 |
| IFN-β |
4 |
186 |
0.030 |
529 |
29 |
29 |
9 |
20 |
| IFN-δ |
3 |
167–170 |
0.116 |
414 |
87 |
87 |
25 |
62 |
| IFN-ɛ |
1 |
193 |
— |
— |
— |
— |
— |
— |
| IFN-κ |
1 |
208 |
— |
— |
— |
— |
— |
— |
| IFN-μ |
3 |
185 |
0.011 |
546 |
9 |
9 |
3 |
6 |
| IFN-ω |
8 |
195 |
0.109 |
462 |
123 |
111 |
37 |
77 |
| Overall | 26 | — | 0.350 | 72 | 420 | 42 | 20 | 25 |
Based on the multiple sequence alignment of 645 nucleotide positions.
The subtypes of the horse IFN-δ and IFN-ω classes were notably more diverse than those of the other type I IFN genes (Table 3). In particular, for these 2 IFN classes, there were many more polymorphic positions in the nucleotide alignment, and many more of these polymorphisms involved amino-acid replacement in the coded peptide. For IFN-δ, this occurred, because the IFND4 sequence differed from those of the other 2 subtypes. For IFN-ω, this occurred, because there were 2 distinct groups of sequences: (1) IFNW2, IFNW4, IFNW6, IFNW8, IFNW10; and (2) IFNW1, IFNW11, IFNW12 (the latter 2 are on the unplaced genomic scaffold). The group (2) genes produced almost identical peptides. This clustering of subtypes indicates that the IFN-ω genes have undergone a hierartchical series of paralog duplications.
Thus, potentially functional genes were identified for 7 different type I IFN classes in the horse genome. Interestingly, we identified a relatively small number of IFN-α subtypes (ie, 6 versus, for example, 17 in the pig genome and 13 in humans) with a high amino-acid sequence similarity (the amino-acid sequences of the 6 IFN-α loci had 2–6 pairwise differences in 190 aligned residues).
Establishment of real-time qPCR assays
In order to quantify mRNA expression of the 7 potentially functional equine type I IFN classes, real-time qPCR assays were established and optimized as summarized in Table 2. Dissociation curve analysis and agarose gel electrophoresis revealed single products of the correct predicted size when compared with a DNA size standard on agarose gels (Fig. 3). The PCR efficiency was determined from the slope of the standard curve that was generated with serial dilutions of cDNA template for each gene, using the equation E=10(−1/Slope)×100. The PCR standard curve efficiencies derived from SV-stimulated PBMCs generated a PCR efficiency of ∼100% (Table 2). Using the 2-Δ(Ct,stim.-Ct,Med) method (Livak and Schmittgen 2001), no change in GAPDH or β2M HKG expression was observed between experimental treatments. We, therefore, decided to average the Ct values of these 2 HKGs when determining the relative expression of the type I IFN genes in cell cultures, to obtain more accurate calculations.
FIG. 3.

Electrophoresis of the indicated PCR products in a 1% agarose gel. The molecular weight marker (100 bp ladder) is shown in the far right-hand lane, and predicted sizes of PCR products are given below each lane. HKG, housekeeping gene; β2M, β-2-microglobuline; GAPDH, glyceraldehyde-3-phosphate dehydrogenase.
Induction of type I IFN mRNA expression and IFN-α secretion
The mRNA expression of the type I IFN genes was studied on in vitro induction of equine PBMC, EEL cells, and EqT8888 cells, with a panel of different inducers using the qPCR assays described earlier. In cultures of PBMC (Fig. 4), IFN-α, IFN-β, IFN-δ, IFN-μ, and IFN-ω mRNA expression was clearly induced with SV. For the other inducers, EHV-1 induced significant expression of IFN-α, IFN-β, IFN-μ, and IFN-ω mRNA; while poly I:C/LyoVec induced significant expression of IFN-α, IFN-β, and IFN-ω mRNA; and ODN induced significant expression of IFN-α and IFN-μ, mRNA. Moreover, poly U/LyoVec induced expression of IFN-α, IFN-β, IFN-ω, and, most notably, IFN-μ mRNA in PBMC from several individuals, but due to a large individual variation in the levels of mRNA expressed, the mean expression did not statistically differ from medium levels. LPS did, however, not induce mRNA expression of any of the type I IFNs. In addition, expression of IFN-ɛ and IFN-κ mRNA was observed on infection with SV, but only in PBMC from one individual each (data not shown); and these samples were used for the validation of the PCR assays, but no induced expression of these type I IFNs was observed in any other samples.
FIG. 4.

Type I IFN mRNA expression induced in equine PBMC after 6 h of culture in medium alone or medium with live SV, live EHV-1, ODN, LPS, poly I:C/LyoVec (poly I:C), or poly U/LyoVec (poly U). The charts show mRNA expression of IFN-α (A), IFN-β (B), IFN-δ (C), IFN-μ (D), and IFN-ω (E), respectively, as measured by real-time qRT-PCR and presented as arithmetic mean values±95% CI, n≤6 horses, of type I IFN expression normalized to the HKGs (2ΔCt). Nonoverlapping CI indicate statistically significant differences (note that the CI are asymmetrical; for details, see Material and Methods). CI, confidence intervals; EHV-1, equine herpes virus 1; LPS, lipopolysaccaride; ODN, oligodeoxyribonucleotide; SV, Sendai virus.
Moreover, the correlation between expression levels of the clearly induced type I IFN classes, that is, IFN-α, IFN-β, IFN-δ, IFN-μ, and IFN-ω in PBMC, was calculated (Table 4). This analysis showed a strong correlation between the levels of SV-induced mRNA expression of all of these type I IFNs. For EHV-1-infected PBMC, a correlation was observed between the levels of mRNA expression of IFN-β, IFN-μ, and IFN-ω. The levels of mRNA expression induced by poly I:C/LyoVec or poly U/LyoVec were also correlated between several of the type I IFN classes. In cultures of EEL cells, significantly increased IFN-β mRNA expression was detected on stimulation with SV, EHV-1, and poly I:C/LyoVec (Fig. 5). None of the other type I IFN classes were expressed in EEL cells. Furthermore, no expression of type I IFN mRNA was detected in cultures of EqT8888 cells.
Table 4.
Correlation (R2) Between mRNA Expression of Different Type I IFN Classes in PBMC Isolated from ≤6 Individual Horses (n=Number of Horses Included in Each Analysis) Stimulated In Vitro for 6 h with the Indicated Inducers
| Inducer | IFN-β | IFN-δ | IFN-μ | IFN-ω | n | |
|---|---|---|---|---|---|---|
| Medium |
IFN-α |
0.312 |
0.000 |
0.031 |
0.025 |
11 |
| SV |
|
0.974 |
0.975 |
0.973 |
0.800 |
11 |
| EHV-1 |
|
0.081 |
0.046 |
0.106 |
0.024 |
6 |
| ODN |
|
0.086 |
0.354 |
0.093 |
0.143 |
6 |
| LPS |
|
0.088 |
0.045 |
0.049 |
0.280 |
8 |
| poly I:C/LyoVec |
|
0.984 |
0.965 |
0.114 |
0.509 |
6 |
| poly U/LyoVec |
|
1.000 |
0.485 |
1.000 |
0.768 |
6 |
| Medium |
IFN-β |
|
0.005 |
0.090 |
0.074 |
11 |
| SV |
|
|
0.953 |
0.951 |
0.751 |
11 |
| EHV-1 |
|
|
0.111 |
0.782 |
0.645 |
6 |
| ODN |
|
|
0.569 |
0.367 |
0.304 |
6 |
| LPS |
|
|
0.008 |
0.187 |
0.054 |
8 |
| poly I:C/LyoVec |
|
|
0.382 |
0.979 |
0.989 |
6 |
| poly U/LyoVec |
|
|
0.475 |
0.660 |
0.577 |
6 |
| Medium |
IFN-δ |
|
|
0.167 |
0.042 |
11 |
| SV |
|
|
|
0.994 |
0.732 |
11 |
| EHV-1 |
|
|
|
0.024 |
0.019 |
6 |
| ODN |
|
|
|
0.364 |
0.234 |
6 |
| LPS |
|
|
|
0.160 |
0.286 |
8 |
| poly I:C/LyoVec |
|
|
|
0.467 |
0.448 |
6 |
| poly U/LyoVec |
|
|
|
0.177 |
0.312 |
6 |
| Medium |
IFN-μ |
|
|
|
0.877 |
11 |
| SV |
|
|
|
|
0.737 |
11 |
| EHV-1 |
|
|
|
|
0.945 |
6 |
| ODN |
|
|
|
|
0.877 |
6 |
| LPS |
|
|
|
|
0.059 |
8 |
| poly I:C/LyoVec |
|
|
|
|
0.983 |
6 |
| poly U/LyoVec | 0.866 | 6 |
EHV-1, equine herpes virus 1; LPS, lipopolysaccaride; ODN, oligodeoxyribonucleotide; SV, Sendai virus.
FIG. 5.

IFN-β mRNA expression in EEL cells after 6 h of culture medium alone or medium with live SV, live EHV-1, ODN, LPS, poly I:C/LyoVec (poly I:C), or poly U/LyoVec (poly U). Data were recorded by real-time qRT-PCR, and are presented as arithmetic mean values±95% CI, n=3 independent induction experiments, of IFN-β expression normalized to the HKGs (2ΔCt). Nonoverlapping CI indicates statistically significant differences (note that the CI are asymmetrical; for details, see Materials and Methods).
In addition to mRNA expression, secretion of IFN-α in cell culture supernatants was recorded in some cultures of PBMC after 24 h of induction (Fig. 6). These results show that IFN-α was secreted on stimulation where high IFN-α mRNA expression was observed, and a significant (R2=0.83) correlation was observed between IFN-α mRNA expression and secretion. Thus, clearly induced expression of 5 type I IFNs with potentially functional genes identified in the horse genome was observed at the mRNA level, and a correlation between mRNA and protein expression was recorded for IFN-α.
FIG. 6.

Correlation between IFN-α mRNA expression at 6 h and IFN-α secretion at 24 h of culture by equine PBMC cultured in medium alone ( filled triangles; n=3) or medium with live SV ( filled squares; n=5), live EHV-1 (crosses; n=4), or ODN (open circles; n=3), respectively.
Discussion
In the present study, 26 potentially coding genes and 6 pseudogenes representing 8 different type I IFN classes were identified in the equine genome, based on their phylogenetic sequence relationships with known type I IFN genes. Moreover, mRNA expression of genes belonging to 5 of these type I IFN classes, namely IFN-α, IFN-β, IFN-δ, IFN-μ, and IFN-ω, was clearly induced on in vitro stimulation of equine cells with, for example, SV. We also recognized IFN-μ as a newly named class of type I IFN, distinct from both IFN-α and IFN-ω.
The horse type I IFN genes that were identified were mostly clustered on chromosome ECC23, which corresponds to human chromosome 9p21 (Leeb and others 2006), where the human type I IFN genes are located (Pestka and others 2004). The remaining 7 genes were on an unplaced genomic scaffold that was annotated as a part of ECC23 in the previous version of the horse genome (Eca1.1). All putative equine type I IFN proteins contained conserved type I IFN family “signature” domains, which further strengthens their identity. Multiple IFNAR subunit binding sites were included in the conserved features, which indicate that these proteins confer type I IFN function.
The general structure of the horse type I IFN family with classes and subtypes was similar to that of most mammals studied to date (Krause and Pestka 2005). The order of type I IFN genes along with ECC23 showed that genes of different classes and subtypes were interspersed with each other in a similar manner to what has been observed for the porcine type I IFN genes (Sang and others 2010).
These findings support gene duplication as one of the mechanisms generating the multitude of genes. Moreover, the phylogenetic analysis also showed that among the species included in the present analysis, gene multiplication generating subtypes has either (1) occurred after the division of these species, or (2) concerted evolution has followed an earlier duplication. The present analysis, thus, concurs with earlier analyses (Hughes 1995; Chen and others 2004; Krause and Pestka 2005; Woelk and others 2007), showing that type I IFN subtypes from more unrelated species such as humans and cattle have evolved after species separation. On the other hand, among closely related species, for example, different primates or rodents, type I IFN subtypes may show a close relationship, indicating that they evolved before species division within these groups (Krause and Pestka 2005; Woelk and others 2007).
Among those type I IFN classes with subtypes, we identified potentially functional genes for 8 IFN-ω, 3 IFN-δ, 3 IFN-μ, and 4 IFN-β subtypes, but for only 6 IFN-α subtypes. Thus, the horse IFN-ω and IFN-α genes are unusual in their relative numbers—most mammalian species studied so far have a greater number of IFN-α genes than IFN-ω genes. The relative paucity of horse IFN-α and multitude of IFN-ω genes was predicted by Himmler and others (1986), but the final quantitative determination of subtype numbers was made in the present study. In comparison, other mammalian species for which a complete or near complete genome are available, for example, humans, have 13 functional IFN-α genes and 1 IFN-ω (Krause and Pestka 2005); pigs seem to have 17 IFN-α and 7 or 8 IFN-ω genes (Zhao and others 2009; Sang and others 2010). Moreover, preliminary searches of the cattle genome indicate that it has 14 IFN-α loci but only 3 IFN-ω loci. Thus, with the exception of the dog, which has 9 IFN-α subtypes (Woelk and others 2007), the horse seems to have much fewer IFN-α subtypes than other mammals.
It remains to be determined whether the relationship between numbers of IFN-α subtypes and numbers of subtypes of other type I IFN classes is driven by a specific evolutionary pressure, or whether subtype numbers of the different type I IFN classes is simply a by-product of the gene multiplication process. However, the presence of multiple classes and subtypes of type I IFNs is a mutual characteristic among the mammalian type I IFN systems, indicating that this set-up confers important beneficial effects. For instance, multiple genes may confer rapid production of high levels of product and/or different classes and subtypes may exert different functions, and indeed both of these features readily apply to the current knowledge on the type I IFN system.
The IFN-μ genes are novel in the sense that we are suggesting this as a “new” class of type I IFN. Krause and Pestka (2005) called this the IFN-αω class, on the grounds that their analyses showed it to be an “ancestral” duplication which has persisted in some lineages. However, our phylogenetic analyses clearly showed it to be a sister to the collection of IFN-α, IFN-ω, and IFN-δ genes, thus making it phylogenetically distinctive. We have identified related sequences in the cattle, sheep, and pig genomes, as well as in the partial genomes of the cat, the dog, a hedgehog, a bat, a flying fox, and the alpaca, suggesting that it is widespread in the Laurasiatheria. We found 3 sequences in the Afrotheria (an elephant, a rock hyrax, and a hedgehog), 2 sequences in the Xenarthra (an armadillo and a sloth), but only one sequence in the Euarchontoglires (a tree shrew), and it may be more widespread in these groups as well. Krause and Pestka (2005) also record IFN-αω in several marsupials, but we failed to find IFN-μ in either the marsupials or the primates.
Until recently, this class of type I IFN had been studied only at gene level. However, Sang and others (2010) showed that IFN-μ mRNA was expressed in skin from healthy pigs, and that recombinant porcine IFN-μ expressed in human cells conferred antiviral activity in both porcine and primate cells. In the present study, we showed that IFN-μ mRNA was readily expressed on viral infection as well as ODN or poly U/LyoVec induction of equine PBMC, but this cytokine was not expressed by the EEL cells. The equine PBMC expressed the different type I IFN classes to varying degrees in response to the inducers used, and the results showed that IFN-α and IFN-μ as well as IFN-β and IFN-ω had similar induction patterns. One may, thus, speculate that IFN-α/μ and IFN-β/ω have additive and/or interchangeable functions in the equine immune system, and that the IFN-μ genes thereby could compensate for the relative paucity of IFN-α genes in the horse. One may, hence, speculate that horse IFN-μ is produced mainly by hematopoietic cells and that it contributes additively with IFN-α to rapid type I IFN responses. This hypothesis could be tested by more detailed studies of expression patterns and biological activity of the different equine type I IFN classes.
We also identified 2 other sequences that did not cluster with any of the named type I IFN sequences, one from a tree shrew (Euarchontoglires) and one from a sloth (Xenarthra). These taxonomically unrelated sequences require further investigation.
IFN-α and IFN-β are the most well known and studied of the type I IFN classes. In the present study, we found that both IFN-α and IFN-β mRNA expression was, as expected, readily induced in equine PBMC on stimulation with the viral inducers. Likewise expected, viral infection induced IFN-β mRNA expression in the fibroblast EEL cells. For IFN-ω, we recorded mRNA expression by equine PBMC on viral and poly I:C/LyoVec stimulation, but the EEL cells did not express this cytokine. This suggests that IFN-ω in the horse is predominantly expressed by hematopoietic cells, which is similar to what has been reported for human cells (Takaoka and Yanai 2006). However, IFN-ω was expressed by the porcine kidney epithelial cell line PK-15 (Zhao and others 2009), and further studies are obviously needed before final conclusions may be drawn on which horse cells express IFN-ω.
IFN-δ mRNA expression was clearly induced in the equine PBMC with live SV, albeit the level of expression was lower than for the other type I IFNs responding to this inducer. Cochet and others (2009) have reported the expression of 2 IFN-δ genes by horse conceptus tissue at early gestation (days 16 and 22), but they did not detect expression of this cytokine in PBMC on overnight infection with several viruses, including SV. This discrepancy could be explained by the longer induction time used in that study, compared with the present 6 h induction, and that an RNase protection assay was used to detect RNA expression, compared with the present highly sensitive real-time RT-PCR. Considering that IFN-δ expression has been detected in equine fetal tissue and that we only detected moderate expression of IFN-δ in PBMC, it seems likely that the primary role of IFN-δ in the horse is in pregnancy, as has been shown for the pig (Lefevre and others 1998; Cochet and others 2009).
IFN-κ and IFN-ɛ were identified as single genes in the equine genome located, as expected (Krause and Pestka 2005), at one “end” of the type I IFN cluster. We did not observe any induced expression of these IFNs except in PBMC from 2 horses that expressed either IFN-ɛ or IFN-κ mRNA upon SV infection. These 2 type I IFNs have been relatively newly discovered and are still fairly unexplored. IFN-ɛ mRNA expression has been reported in different human, murine, and porcine cells and/or tissues (Hardy and others 2004; Ito and others 2006; Matsumiya and others 2007; Sang and others 2010). Moreover, in mice, it has been suggested that IFN-ɛ has its primary role in pregnancy (Hardy and others 2004). IFN-κ mRNA expression has been observed in human (LaFleur and others 2001; Nardelli and others 2002), murine (Vassileva and others 2003), and porcine (Sang and others 2010) cells and/or tissues, with the most prominent expression reported so far observed in human keratinocytes. Thus, it seems that equine IFN-ɛ and IFN-κ expression may be induced in PBMC, but the present experimental conditions were not optimal for studies of these type I IFNs.
Using some more “ligand-specific” inducers such as poly I:C/LyoVec that represented dsRNA, we found that equine PBMC readily expressed IFN-β and IFN-ω mRNA, and that EEL cells expressed high levels of IFN-β mRNA on stimulation with this inducer. PBMC from most horses also expressed IFN-α and IFN-μ mRNA on stimulation with poly I:C/LyoVec. These results concur with earlier studies in which poly I:C in complex with DEAE dextran induced acid-stable IFN-activity in different preparations of equine fibroblastic cells (Yilma and others 1982; Edington and others 1989b). The intra-cytoplasmatic receptors retinoic acid inducible gene I (RIG-I) and melanoma differentiation-associated gene 5 (MDA5), which recognize short and long forms of the synthetic RNA poly I:C, respectively (Onomoto and others 2010), are thought to be relatively ubiquitously expressed. For example, both murine fibroblasts and conventional dendritic cells (cDC) express RIG-I (Kato and others 2005), which agrees with our results that both equine hematopoietic and fibroblastic cells responded to poly I:C/LyoVec stimulation.
As a representative of CpG-DNA recognition by TLR9, we used ODN 2395, which was earlier identified as a consistent inducer of type I IFN-activity in equine PBMC (Wattrang and others 2012). Indeed, in the present study, this ODN clearly induced expression of IFN-α and IFN-μ mRNA by the equine PBMC. IFN-β and IFN-ω mRNA were expressed to a lesser extent on ODN induction, while the EEL cells did not respond to this stimuli. This concurs with earlier results, showing that IFN-α mRNA expression dominated over IFN-β mRNA expression in equine PBMC stimulated with CpG-DNA (Wattrang and others 2005), and that almost all IFN-activity produced by equine PBMC on CpG-DNA stimulation was exerted by IFN-α (Wagner and others 2008). Similarly, enriched human plasmacytoid DC (pDC) produced 50–100 times more IFN-α than IFN-β when induced with CpG-DNA (Krug and others 2001; Kerkmann and others 2003).
The ssRNA type I IFN inducer poly U/LyoVec is recognized by TLR7 (rodent; Diebold and others 2004) or TLR8 (eg, human; Heil and others 2004). In the present study, poly U/LyoVec most markedly induced IFN-μ mRNA expression but also low IFN-α, IFN-β, and IFN-ω mRNA expression by PBMC from many horses, but individual variation in the magnitude of responses was large and the EEL cells did not respond to this stimuli. In addition, we have recorded low levels, ∼15 U/mL, of IFN-α secreted upon poly U/LyoVec stimulation of equine PBMC (unpublished data). Thus, poly-U ssRNA seemed to be a weak type I IFN inducer in equine cells, and interestingly, poly-U ssRNA failed to induce IFN-α in porcine PBMC (Sorensen and others 2011). Type I IFN production on TLR7/8 or TLR9 stimulation has amid, for example, human cells been attributed to the highly specialized pDC that is also termed natural IFN-producing cell (NIPC; Fitzgerald-Bocarsly and others 2008). The present results, where only equine PBMC and not fibroblasts responded with type I IFN mRNA expression upon ODN or poly U/LyoVec stimulation, are hence in agreement with the concept of a “horse NIPC.”
We used live viruses, SV and EHV-1, as “gold standard” inducers of type I IFN expression. Both viruses have previously been shown to induce type I IFN production by horse cells (Wattrang and others 2005; Wagner and others 2008; Wagner and others 2011) and as expected, SV was the strongest inducer of mRNA expression of these genes. Our small panel of more “ligand-specific” type I IFN inducers also functioned largely as expected, apart from LPS that did not induce any type I IFN mRNA expression. In other species, LPS has been described as an inducer of, for example, IFN-β production (Kawai and Akira 2010). LPS induced type I IFN-bioactivity (Garcia-Tapia and others 2006), and IFN-β mRNA expression (Mignot and others 2012) has also been reported using horse cells. However, in analogy with our results, Figueiredo and others (2009b) reported that LPS failed to induce IFN-β expression in equine monocytes. Thus, more thorough, for example, kinetic, studies should be undertaken to clarify under which circumstances LPS may act as a type I IFN inducer in horse cells. Moreover, in the present study, the equine lymphosarcoma cell line EqT8888 did not express any of the type I IFNs regardless of the inducer used. Since deletion of type I IFN genes is common in malignancies (Colamonici and others 1992), we assume that the EqT8888 cells also have a defect type I IFN system.
Altogether, our results show that the equine type I IFN system comprises more classes than previously known, that is, IFN-μ IFN-ν, IFN-ɛ, and IFN-κ, and that, even though its general genomic organization was similar to that of type I IFN systems of other mammalian species, it has unique features such as the low number of IFN-α and the high number of IFN-ω subtypes. This knowledge will contribute to the future use of type I IFNs and type I IFN inducers in equine medicine and immune prophylaxis, for example, in infectious disease therapy and as vaccine adjuvants.
Supplementary Material
Acknowledgments
This project was financed by the Swedish Research Council FORMAS, the Foundation for Equine Research (Sweden), and the (Swedish) National Veterinary Institute Research Fund. The authors thank Martin Johanson and Casper Wahlund for their helpful technical assistance, and the owners of the blood donor horses for their invaluable contribution. Equine cell lines used for induction experiments were as follows: primary embryonic lung (EEL) cells kindly provided by the Animal Health Trust, Newmarket, United Kingdom, and immortalized lymphosarcoma cells EqT8888 (Hormanski and others 1992) kindly provided by Dr David Horohov, University of Kentucky, Lexington, the United States.
Author Disclosure Statement
The authors declare that no competing financial, or other, interests exist.
References
- Chen J, Baig E, Fish EN. 2004. Diversity and relatedness among the type I interferons. J Interferon Cytokine Res 24(12):687–698 [DOI] [PubMed] [Google Scholar]
- Chong YC, Duffus WP. 1992. Immune responses of specific pathogen free foals to EHV-1 infection. Vet Microbiol 32(3–4):215–228 [DOI] [PubMed] [Google Scholar]
- Cochet M, Vaiman D, Lefevre F. 2009. Novel interferon delta genes in mammals: cloning of one gene from the sheep, two genes expressed by the horse conceptus and discovery of related sequences in several taxa by genomic database screening. Gene 433(1–2):88–99 [DOI] [PubMed] [Google Scholar]
- Colamonici OR, Domanski P, Platanias LC, Diaz MO. 1992. Correlation between interferon (IFN) alpha resistance and deletion of the IFN alpha/beta genes in acute leukemia cell lines suggests selection against the IFN system. Blood 80(3):744–749 [PubMed] [Google Scholar]
- Diebold SS, Kaisho T, Hemmi H, Akira S, Reis e Sousa C. 2004. Innate antiviral responses by means of TLR7-mediated recognition of single-stranded RNA. Science 303(5663):1529–1531 [DOI] [PubMed] [Google Scholar]
- Edington N, Bridges CG, Griffiths L. 1989a. Equine interferons following exposure to equid herpesvirus-1 or −4. J Interferon Res 9(4):389–392 [DOI] [PubMed] [Google Scholar]
- Edington N, Bridges CG, Griffiths L. 1989b. Further investigations of equine interferons in vitro. J Interferon Res 9(4):385–387 [DOI] [PubMed] [Google Scholar]
- Figueiredo MD, Salter CE, Andrietti AL, Vandenplas ML, Hurley DJ, Moore JN. 2009a. Validation of a reliable set of primer pairs for measuring gene expression by real-time quantitative RT-PCR in equine leukocytes. Vet Immunol Immunopathol 131(1–2):65–72 [DOI] [PubMed] [Google Scholar]
- Figueiredo MD, Vandenplas ML, Hurley DJ, Moore JN. 2009b. Differential induction of MyD88- and TRIF-dependent pathways in equine monocytes by Toll-like receptor agonists. Vet Immunol Immunopathol 127(1–2):125–134 [DOI] [PubMed] [Google Scholar]
- Fitzgerald-Bocarsly P, Dai J, Singh S. 2008. Plasmacytoid dendritic cells and type I IFN: 50 years of convergent history. Cytokine Growth Factor Rev 19(1):3–19 [DOI] [PMC free article] [PubMed] [Google Scholar]
- Garcia-Tapia D, Loiacono CM, Kleiboeker SB. 2006. Replication of West Nile virus in equine peripheral blood mononuclear cells. Vet Immunol Immunopathol 110(3–4):229–244 [DOI] [PubMed] [Google Scholar]
- Hardy MP, Owczarek CM, Jermiin LS, Ejdebäck M, Hertzog PJ. 2004. Characterization of the type I interferon locus and identification of novel genes. Genomics 84(2):331–345 [DOI] [PubMed] [Google Scholar]
- Heil F, Hemmi H, Hochrein H, Ampenberger F, Kirschning C, Akira S, Lipford G, Wagner H, Bauer S. 2004. Species-specific recognition of single-stranded RNA via toll-like receptor 7 and 8. Science 303(5663):1526–1529 [DOI] [PubMed] [Google Scholar]
- Himmler A, Hauptmann R, Adolf GR, Swetly P. 1986. Molecular cloning and expression in Escherichia coli of equine type I interferons. DNA 5(5):345–356 [DOI] [PubMed] [Google Scholar]
- Hormanski CE, Truax R, Pourciau SS, Folsom RW, Horohov DW, Viveiros MM, Antczak DF. 1992. Induction of lymphokine-activated killer cells of equine origin: specificity for equine target cells. Vet Immunol Immunopathol 32(1–2):25–36 [DOI] [PubMed] [Google Scholar]
- Horohov DW, Breathnach CC, Sturgill TL, Rashid C, Stiltner JL, Strong D, Nieman N, Holland RE. 2008. In vitro and in vivo modulation of the equine immune response by parapoxvirus ovis. Equine Vet J 40(5):468–472 [DOI] [PubMed] [Google Scholar]
- Hughes AL. 1995. The evolution of the type I interferon gene family in mammals. J Mol Evol 41(5):539–548 [DOI] [PubMed] [Google Scholar]
- Ito T, Kanzler H, Duramad O, Cao W, Liu YJ. 2006. Specialization, kinetics, and repertoire of type 1 interferon responses by human plasmacytoid predendritic cells. Blood 107(6):2423–2431 [DOI] [PubMed] [Google Scholar]
- Jensen-Waern M, Persson SG, Nordengrahn A, Merza M, Fossum C. 1998. Temporary suppression of cell-mediated immunity in standardbred horses with decreased athletic capacity. Acta Vet Scand 39(1):25–33 [DOI] [PMC free article] [PubMed] [Google Scholar]
- Kato H, Sato S, Yoneyama M, Yamamoto M, Uematsu S, Matsui K, Tsujimura T, Takeda K, Fujita T, Takeuchi O, Akira S. 2005. Cell type-specific involvement of RIG-I in antiviral response. Immunity 23(1):19–28 [DOI] [PubMed] [Google Scholar]
- Kawai T, Akira S. 2010. The role of pattern-recognition receptors in innate immunity: update on Toll-like receptors. Nat Immunol 11(5):373–384 [DOI] [PubMed] [Google Scholar]
- Kerkmann M, Rothenfusser S, Hornung V, Towarowski A, Wagner M, Sarris A, Giese T, Endres S, Hartmann G. 2003. Activation with CpG-A and CpG-B oligonucleotides reveals two distinct regulatory pathways of type I IFN synthesis in human plasmacytoid dendritic cells. J Immunol 170(9):4465–4474 [DOI] [PubMed] [Google Scholar]
- Krause CD, Pestka S. 2005. Evolution of the Class 2 cytokines and receptors, and discovery of new friends and relatives. Pharmacol Ther 106(3):299–346 [DOI] [PubMed] [Google Scholar]
- Krug A, Rothenfusser S, Hornung V, Jahrsdorfer B, Blackwell S, Ballas ZK, Endres S, Krieg AM, Hartmann G. 2001. Identification of CpG oligonucleotide sequences with high induction of IFN-alpha/beta in plasmacytoid dendritic cells. Eur J Immunol 31(7):2154–2163 [DOI] [PubMed] [Google Scholar]
- LaFleur DW, Nardelli B, Tsareva T, Mather D, Feng P, Semenuk M, Taylor K, Buergin M, Chinchilla D, Roshke V, Chen G, Ruben SM, Pitha PM, Coleman TA, Moore PA. 2001. Interferon-kappa, a novel type I interferon expressed in human keratinocytes. J Biol Chem 276(43):39765–39771 [DOI] [PubMed] [Google Scholar]
- Land CE. 1974. Confidence interval estimation for means after data transformation to normality. J Am Stat Assoc 69(347):795–802 [Google Scholar]
- Leeb T, Vogl C, Zhu B, de Jong PJ, Binns MM, Chowdhary BP, Scharfe M, Jarek M, Nordsiek G, Schrader F, Blocker H. 2006. A human-horse comparative map based on equine BAC end sequences. Genomics 87(6):772–776 [DOI] [PubMed] [Google Scholar]
- Lefevre F, Guillomot M, D'Andrea S, Battegay S, La Bonnardiere C. 1998. Interferon-delta: the first member of a novel type I interferon family. Biochimie 80(8–9):779–788 [DOI] [PubMed] [Google Scholar]
- Livak KJ, Schmittgen TD. 2001. Analysis of relative gene expression data using real-time quantitative PCR and the 2(-Delta Delta C(T)) Method. Methods 25(4):402–408 [DOI] [PubMed] [Google Scholar]
- Matsumiya T, Prescott SM, Stafforini DM. 2007. IFN-epsilon mediates TNF-alpha-induced STAT1 phosphorylation and induction of retinoic acid-inducible gene-I in human cervical cancer cells. J Immunol 179(7):4542–4549 [DOI] [PubMed] [Google Scholar]
- Mignot CC, Pirottin D, Farnir F, de Moffarts B, Molitor C, Lekeux P, Art T. 2012. Effect of strenuous exercise and ex vivo TLR3 and TLR4 stimulation on inflammatory gene expression in equine pulmonary leukocytes. Vet Immunol Immunopathol 147(3–4):127–135 [DOI] [PubMed] [Google Scholar]
- Morse DL, Carroll D, Weberg L, Borgstrom MC, Ranger-Moore J, Gillies RJ. 2005. Determining suitable internal standards for mRNA quantification of increasing cancer progression in human breast cells by real-time reverse transcriptase polymerase chain reaction. Anal Biochem 342(1):69–77 [DOI] [PubMed] [Google Scholar]
- Nardelli B, Zaritskaya L, Semenuk M, Cho YH, LaFleur DW, Shah D, Ullrich S, Girolomoni G, Albanesi C, Moore PA. 2002. Regulatory effect of IFN-kappa, a novel type I IFN, on cytokine production by cells of the innate immune system. J Immunol 169(9):4822–4830 [DOI] [PubMed] [Google Scholar]
- Onomoto K, Onoguchi K, Takahasi K, Fujita T. 2010. Type I interferon production induced by RIG-I-like receptors. J Interferon Cytokine Res 30(12):875–881 [DOI] [PubMed] [Google Scholar]
- Pei J, Grishin NV. 2007. PROMALS: towards accurate multiple sequence alignments of distantly related proteins. Bioinformatics 23(7):802–808 [DOI] [PubMed] [Google Scholar]
- Pestka S, Krause CD, Walter MR. 2004. Interferons, interferon-like cytokines, and their receptors. Immunol Rev 202(1):8–32 [DOI] [PubMed] [Google Scholar]
- Quinlivan M, Zamarin D, Garcia-Sastre A, Cullinane A, Chambers T, Palese P. 2005. Attenuation of equine influenza viruses through truncations of the NS1 protein. J Virol 79(13):8431–8439 [DOI] [PMC free article] [PubMed] [Google Scholar]
- Rathinam VA, Fitzgerald KA. 2011. Innate immune sensing of DNA viruses. Virology 411(2):153–162 [DOI] [PMC free article] [PubMed] [Google Scholar]
- Rozas J, Sanchez-DelBarrio JC, Messeguer X, Rozas R. 2003. DnaSP, DNA polymorphism analyses by the coalescent and other methods. Bioinformatics 19(18):2496–2497 [DOI] [PubMed] [Google Scholar]
- Samarajiwa SA, Wilson W, Hertzog PJ. 2006. Type I interferons: genetics and structure. In: Meager A, ed. The interferons: characterization and application. Weinheim: Wiley-VCH; pp 3–34 [Google Scholar]
- Sang Y, Rowland RR, Hesse RA, Blecha F. 2010. Differential expression and activity of the porcine type I interferon family. Physiol Genomics 42(2):248–258 [DOI] [PubMed] [Google Scholar]
- Sorensen NS, Skovgaard K, Heegaard PM. 2011. Porcine blood mononuclear cell cytokine responses to PAMP molecules: comparison of mRNA and protein production. Vet Immunol Immunopathol 139(2–4):296–302 [DOI] [PubMed] [Google Scholar]
- Stamatakis A. 2006. RAxML-VI-HPC: maximum likelihood-based phylogenetic analyses with thousands of taxa and mixed models. Bioinformatics 22(21):2688–2690 [DOI] [PubMed] [Google Scholar]
- Swofford DL. 2002. PAUP*: Phylogenetic analysis using parsimony (* and other methods). Sunderland, MA: Sinauer Associates [Google Scholar]
- Takaoka A, Yanai H. 2006. Interferon signalling network in innate defence. Cell Microbiol 8(6):907–922 [DOI] [PubMed] [Google Scholar]
- Tornquist SJ, Oaks JL, Crawford TB. 1997. Elevation of cytokines associated with the thrombocytopenia of equine infectious anaemia. J Gen Virol 78(10):2541–2548 [DOI] [PubMed] [Google Scholar]
- Vassileva G, Chen SC, Zeng M, Abbondanzo S, Jensen K, Gorman D, Baroudy BM, Jiang Y, Murgolo N, Lira SA. 2003. Expression of a novel murine type I IFN in the pancreatic islets induces diabetes in mice. J Immunol 170(11):5748–5755 [DOI] [PubMed] [Google Scholar]
- Vollmer J, Weeratna R, Payette P, Jurk M, Schetter C, Laucht M, Wader T, Tluk S, Liu M, Davis HL, Krieg AM. 2004. Characterization of three CpG oligodeoxynucleotide classes with distinct immunostimulatory activities. Eur J Immunol 34(1):251–262 [DOI] [PubMed] [Google Scholar]
- Wagner B, Hillegas JM, Flaminio MJBF, Wattrang E. 2008. Monoclonal antibodies to equine interferon-α (IFN-α): New tools to neutralize IFN activity and to detect secreted IFN-α. Vet Immunol Immunopathol 125(3–4):315–325 [DOI] [PubMed] [Google Scholar]
- Wagner B, Wimer C, Freer H, Osterrieder N, Erb HN. 2011. Infection of peripheral blood mononuclear cells with neuropathogenic equine herpesvirus type-1 strain Ab4 reveals intact interferon-alpha induction and induces suppression of anti-inflammatory interleukin-10 responses in comparison to other viral strains. Vet Immunol Immunopathol 143(1–2):116–124 [DOI] [PubMed] [Google Scholar]
- Wattrang E, Berg M, Magnusson M. 2005. Immunostimulatory DNA activates production of type I interferons and interleukin-6 in equine peripheral blood mononuclear cells in vitro. Vet Immunol Immunopathol 107(3–4):265–279 [DOI] [PubMed] [Google Scholar]
- Wattrang E, Jessett DM, Yates P, Fuxler L, Hannant D. 2003. Experimental infection of ponies with equine influenza A2 (H3N8) virus strains of different pathogenicity elicits varying interferon and interleukin-6 responses. Viral Immunol 16(1):57–67 [DOI] [PubMed] [Google Scholar]
- Wattrang E, Palm AK, Wagner B. 2012. Cytokine production and proliferation upon in vitro oligodeoxyribonucleotide stimulation of equine peripheral blood mononuclear cells. Vet Immunol Immunopathol 146(2):113–124 [DOI] [PubMed] [Google Scholar]
- Woelk CH, Frost SD, Richman DD, Higley PE, Kosakovsky Pond SL. 2007. Evolution of the interferon alpha gene family in eutherian mammals. Gene 397(1–2):38–50 [DOI] [PMC free article] [PubMed] [Google Scholar]
- Yilma T, McGuire TC, Perryman LE. 1982. Preliminary characterization of equine interferons and their antiviral activities on bovine, ovine, and human cells. J Interferon Res 2(3):363–370 [DOI] [PubMed] [Google Scholar]
- Zhao X, Cheng G, Yan W, Liu M, He Y, Zheng Z. 2009. Characterization and virus-induced expression profiles of the porcine interferon-omega multigene family. J Interferon Cytokine Res 29(10):687–693 [DOI] [PubMed] [Google Scholar]
Associated Data
This section collects any data citations, data availability statements, or supplementary materials included in this article.