

Abstract
Electrochemically active biofilms have a unique form of respiration in which they utilize solid external materials as terminal electron acceptors for their metabolism. Currently, two primary mechanisms have been identified for long-range extracellular electron transfer (EET): a diffusion- and a conduction-based mechanism. Evidence in the literature suggests that some biofilms, particularly Shewanella oneidensis, produce the requisite components for both mechanisms. In this study, a generic model is presented that incorporates the diffusion- and the conduction-based mechanisms and allows electrochemically active biofilms to utilize both simultaneously. The model was applied to S. oneidensis and Geobacter sulfurreducens biofilms using experimentally generated data found in the literature. Our simulation results show that 1) biofilms having both mechanisms available, especially if they can interact, may have a metabolic advantage over biofilms that can use only a single mechanism; 2) the thickness of G. sulfurreducens biofilms is likely not limited by conductivity; 3) accurate intrabiofilm diffusion coefficient values are critical for current generation predictions; and 4) the local biofilm potential and redox potential are two distinct parameters and cannot be assumed to have identical values. Finally, we determined that simulated cyclic and squarewave voltammetry based on our model are currently not capable of determining the specific percentages of extracellular electron transfer mechanisms in a biofilm. The developed model will be a critical tool for designing experiments to explain EET mechanisms.
Keywords: biofilm, electron transfer, extracellular, Geobacter, MFC, model, Shewanella, squarewave, voltammetry
Introduction
Electrochemically active biofilms (EABs) use a unique mode of respiration, in which terminal electrons derived from their metabolism are transferred to extracellular, insoluble electron acceptors, such as minerals or electrodes.1–4 This phenomenon has been researched for use in several applications, including the production of electrical power,5, 6 the production of hydrogen in microbial electrolysis cells,7, 8 and the improvement of wastewater treatment.9, 10 Extracellular electron transfer (EET) has also been researched for its use in bioremediation,11–13 for understanding microbially influenced corrosion,14, 15 and for its role in subsurface sediment mineralogy.16, 17 To date, there have been two main mechanisms proposed for long-range EET, a diffusion-based and a conduction-based mechanism.18 Diffusion-based EET relies on the migration, diffusion, and/or advection of soluble electrochemically active molecules (mediators) to carry electrons from cells to the electron-accepting surface.19–21 Conduction-based EET relies on the transmission of electrons through a conductive biofilm matrix composed of extracellular polymeric substances.22–24 These mechanisms are diagramed in. Theoretical calculations have shown that diffusion-based EET alone cannot account for the current produced by electrochemically active biofilms because of mass transport limitations of the mediators.18 Furthermore, there is evidence that some species are able to utilize both mechanisms. Shewanella oneidensis, a dissimilatory metal-reducing bacterium, was chosen as the focus of this study because of supporting evidence for both diffusion- and conduction-based EET in S. oneidensis biofilms.21, 22, 25 Currently it is not known to what extent S. oneidensis uses each EET mechanism or what effect different environmental and phenotypic conditions have on EET mechanism selection.18
To date, all electrochemically active biofilm modeling efforts have focused on individual EET mechanisms. In the past seven years, several conduction-based models have been proposed. In one of the first biofilm-based microbial fuel cell (MFC) models, Marcus et al. developed the Nernst-Monod equation to relate substrate utilization and anode electrical potential to current production for conduction-based electron transfer.26 This model assumed that the solid anode and the conducting biofilm could take the place of a soluble electron acceptor in the Nernst equation. It was further assumed that biofilm resistivity, ohmic loss, and proton concentration changes were negligible. Marcus et al. found that electron transfer was a primary limiting factor for high power production, principally because of the purportedly high resistance of the biofilm matrix. In 2010, Pinto et al. developed a conduction-based model27 for multispecies microbial fuel cells that generated power from wastewater via anodophilic and methanogenic microbes. The defining feature of this model is its potential application of controlling the external resistance of a microbial fuel cell in real time, facilitating maximum power point tracking. Also in 2010, Zeng et al. developed the first full dual-chamber microbial fuel cell model.28 Prior to this model, reduction reactions at the cathode were assumed to be non-limiting. In this study, Zeng et al. demonstrated that the performance of the anode and that of the cathode are intimately connected. Concurrent with the development of these conduction-based models, several diffusion-based models were also published. In 2007, Picioreanu et al. modeled a microbial fuel cell with both biofilm and planktonic species with electron transfer via diffusion-based EET.29 This multidimensional individual-based model considered the diffusion of redox mediators from the cells to a planar anode. Picioreanu et al. were able to use their model to describe experimental results obtained from Bond and Lovley.30 Incidentally, the experiment by Bond and Lovley, which utilized Geobacter sulfurreducens, most likely did not have electron mediators. Picioreanu et al. later expanded on their model and included multiple species by incorporating the International Water Association’s aerobic digestion model (ADM1)31 into the diffusion-based model.32 Furthermore, in 2010, Picioreanu et al. added electromigration using the Nernst-Planck equation and pH considerations.33 Collectively, these models show that both EET mechanisms can be used to describe current production in microbial fuel cells. They have also helped researchers optimize power and address microbial fuel cell design issues. However, none of these models investigates the combination, interaction, and relationship of diffusion- and conduction-based EET. This is necessary to determine which mechanism dominates under various experimental and natural conditions. Furthermore, such interactions are critical for mixed-species biofilms, where a variety of species that use different EET strategies may coexist34. The fact that mixed-species biofilms generally produce higher current densities than pure culture biofilms warrants the investigation of interactions between EET mechanisms. We believe that mathematical modeling can help us critically investigate these interactions and aid in experimental design.
In this study, we explore the possible connections between diffusion- and conduction-based EET and the conditions that affect the usage of each EET strategy by a biofilm. Specifically, we develop a model that includes four different cases of EET (Figure 1): 1) diffusion-based EET, 2) conduction-based EET, 3) isolated-dual EET, and 4) interacting-dual EET. Isolated-dual EET considers electron transfer through a combination of diffusion- and conduction-based EET mechanisms. In this case, a biofilm may use both pathways; however, the pathways are independent, noninteracting, and thus isolated from each other. Interacting-dual EET also considers electron transfer through a combination of diffusion- and conduction-based EET mechanisms; however, in this case the extracellular biofilm matrix acts as an extension of the electrode and can accept/donate electrons from/to a soluble mediator while conducting electrons from the cells to the electrode. This is in contrast to isolated-dual EET, in which the biofilm matrix cannot interact with mediators. The model is generic, intended for use with any biofilm-forming electrochemically active organism, applicable to a wide variety of conditions, and inclusive of both steady state and dynamic solutions. It provides, for the first time, the ability to simulate both cyclic and squarewave voltammetry of a biofilm using experimentally observed parameters. As an example application, an S. oneidensis biofilm was simulated using experimentally generated parameters and compared to a simulated G. sulfurreducens biofilm. We used our model to address a set of questions, shown in italic below.
Figure 1.
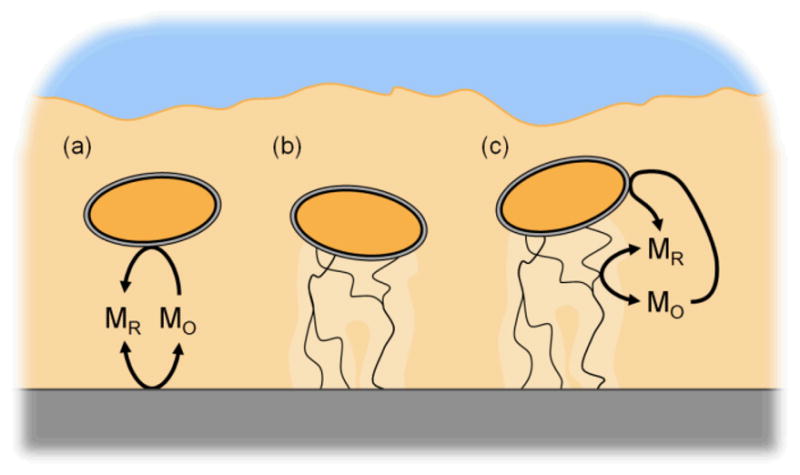
Schematic of the cases of extracellular electron transfer explored in this study. (a) Diffusion-based EET: redox-active mediators, which move through the biofilm by diffusion, are reduced by the cell and can exchange electrons at the electrode surface. (b) Conduction-based EET: electrons are transported through the conductive biofilm matrix directly to the electrode surface. A noninteracting combination of diffusion- and conduction-based EET (a and b) is called isolated-dual EET. (c) Interacting-dual EET: mediator interactions in a conductive biofilm. The conductive biofilm matrix acts as an extension of the electrode, allowing the matrix and mediators to exchange electrons.
How does the distribution of the EET mechanisms affect theoretical current production? This question addresses the contribution of each mechanism to total EET. Although this question is partially answered in the literature, readdressing this question allowed us to compare our predictions with previous literature studies. When would the simultaneous use of both diffusion-and conduction-based EET be beneficial for a biofilm? Since it has been experimentally demonstrated that some biofilms can use both mechanisms, we determined theoretically whether this generates any benefit for biofilm activity or the total electron transfer rate. How does biofilm spatial activity affect the EET mechanism? We asked this question to determine whether a biofilm with higher activity can produce higher current and whether nonuniform activity is connected with the EET mechanism. What are the theoretical maximum biofilm thicknesses for different biofilm conductivities? The literature on this topic is conflicting. There are studies claiming that thickness is limited by conductivity and that thickness is not limited. The answer to this question can tell us what the limiting factors controlling biofilm thickness are. How does the effective diffusion coefficient profile affect diffusion-based EET? Often effective diffusion coefficient values are assumed in the literature to be constant. Recently it has been shown that this is not correct. This question addresses how critical the selected values of the diffusion coefficients are for the predicted current. Can voltammetry determine the contributions of EET mechanisms used by the biofilm? The answer to this question is critically needed to determine what information idealized cyclic voltammetry (CV) or squarewave voltammetry (SQW) may provide. Which parameters are critical for determining the EET mechanisms and theoretical current production? There are many parameters used in our model. By changing their values, we tested how they contribute to the overall current. Finding the key parameters will help us in designing experiments and inform us on which variables to control or measure. What is the difference between the local biofilm potential and the redox potential? Recently, our group discovered the local biofilm potential, which is different from the redox potential. The answer to this question will allow us to compare them, since one is based on conduction and defined for the extracellular matrix (local biofilm potential), whereas the other is defined for the liquid phase (redox potential). What benefit may a biofilm gain by allowing mediators to interact with the conductive biofilm matrix? If the extracellular polymeric substances (EPS) that comprise the biofilm matrix are conductive and this matrix interacts with electron transfer mediators, this interaction should provide an advantage to biofilm growth. The answer to this question can help us determine the extent of this advantage.
General Model Formulation
The model simulates an electrochemically active biofilm residing on an impenetrable electrode, consisting of a homogeneous distribution of electrochemically active species that can oxidize a substrate to release high-energy electrons. Electrons from the microbial oxidation of substrate are transferred to the electrode through conduction-based and/or diffusion-based EET mechanisms, depending on the chosen input parameters. Furthermore, the model is capable of simulating time-based electrochemical experiments, specifically cyclic voltammetry and squarewave voltammetry, relying upon first principles and experimentally observed input parameters when possible. In this study, we investigate the simplest cases considering the interaction of the two EET mechanisms.
Biomass
The biofilm is comprised of a distribution of biomass (cells and extracellular polymeric substances, the biofilm matrix). It is assumed that the biomass is homogenous in three dimensions and does not change thickness or composition over time. This is a reasonable assumption as long as the biofilm has reached a pseudo-steady state and only short time frames are considered.35 Later in this study, the effect of heterogeneity on current production and EET mechanisms is explored by incorporating variable diffusion coefficients and density profiles. The biofilm has defined thickness, L (m); cell density, X (g m−3); and isotropic conductivity, κ (S m−1).
Biofilm metabolism
The biofilm subsists on the oxidation of substrate, S (mM), which is delivered to the biofilm matrix via diffusive mass transport. The substrate is supplied at a constant concentration to a large, well-mixed anodic chamber. The bulk concentration of substrate is considered constant because of the size of the chamber and the relatively slow consumption rate of substrate by the biofilm. The concentration at the biofilm surface is equal to the bulk concentration because of mixing in the anodic chamber. The substrate utilization rate is controlled by both the substrate concentration (electron donor concentration) and the electron acceptor concentration, through multiplicative Monod substrate utilization equations.36, 37 There are two possible electron transfer pathways; thus, there are two substrate utilization equations. For diffusion-based EET, substrate utilization is given by:
| (1) |
where qM (mol g−1 s−1) is the specific substrate utilization rate via diffusion-based EET, qmax (mol g−1 s−1) is the maximum specific substrate utilization rate, S (mM) is the substrate concentration, KS (mM) is the half-saturation constant of the substrate, Mo (mM) is the oxidized mediator concentration, and KM (mM) is the half-saturation constant of the mediator. For conduction-based EET, substrate utilization is given by the Nernst-Monod equation26:
| (2) |
where qC (mol g−1 s−1) is the specific substrate utilization rate via conduction-based EET, F (s A mol−1) is the Faraday constant,
 (J K−1 mol−1) is the universal gas constant, T (K) is the temperature, E (VSHE) is the local biofilm potential, and EKA(VSHE) is the half-maximum rate potential. The electron acceptor term, which is a function of E, is known as the Nernst-Monod term.26 The maximum specific substrate utilization rate is considered to be the same regardless of whether the EET is diffusion- or conduction-based, as it is assumed that the maximum specific substrate utilization rate is not affected by the EET mechanism used by the microorganism. In this model, diffusion- and conduction-based EET can be used simultaneously; thus, piecewise functions are needed to define a modified
and
if qM+ qC is larger than qmax
(J K−1 mol−1) is the universal gas constant, T (K) is the temperature, E (VSHE) is the local biofilm potential, and EKA(VSHE) is the half-maximum rate potential. The electron acceptor term, which is a function of E, is known as the Nernst-Monod term.26 The maximum specific substrate utilization rate is considered to be the same regardless of whether the EET is diffusion- or conduction-based, as it is assumed that the maximum specific substrate utilization rate is not affected by the EET mechanism used by the microorganism. In this model, diffusion- and conduction-based EET can be used simultaneously; thus, piecewise functions are needed to define a modified
and
if qM+ qC is larger than qmax
| (3) |
| (4) |
Note that, by definition, multiplicative Monod substrate utilization allows for the limitation of metabolism when the electron acceptor is limiting. For this model, the terminal electron acceptor is always the electrode; however diffusion- and conduction-based EET allow for two possible access paths for the electrode. Whether EET is 100% diffusion-based, 100% conduction-based, or a mixture of the two, the maximum substrate utilization rate is the same. The total specific substrate utilization rate, q (mol g−1 s−1), is given by:
| (5) |
Eqn (3) and (4) ensure q will never exceed qmax. Furthermore, the ratio will not deviate from qm/qc, which is determined by the relative availability of mediators or a conduction pathway, even if qm+qc does exceed qmax. Thus, when EET is a mixture of diffusion-based and conduction-based mechanisms, the EET mechanism percentages will not be a function of substrate concentration. The overall substrate reaction rate due to metabolism, RS (mol m−3 s−1), is given by:
| (6) |
Diffusion-based extracellular electron transfer
In the biofilm, the oxidized mediator, Mo, is reduced by cells at a rate proportional to the utilization of substrate, . It is speculated that redox mediators, such as flavins, can interact with outer membrane c-type cytochrome proteins, e.g., MtrC and OmcA, receiving electrons from the outer membrane cytochromes and transferring them to terminal electron acceptors outside of the cell. Here, it is assumed that the mediators are not fixed in location and that the distances between mediators and between mediators and the terminal electron acceptor are too great (greater than tens of Ångströms) for efficient electron hopping. Thus, for this mechanism, electrons are carried by mediators that move via diffusion in the biofilm and undergo subsequent cycles of oxidation and reduction reactions. The steps of diffusion-based EET can be summarized as:
Kim et al., Valesquez-Orta et al., and Lanthier et al. all found that the number of harvested electrons in actual systems is significantly lower than that expected from substrate oxidation with 100% coulombic efficiency.38–40 For this reason a correction factor, f, is defined to represent the fraction of electrons obtainable for external electrical energy production. The formation of the reduced form of the mediator, Mr, is given by:
| (7) |
where RM (mol m−3 s−1) is the reduction rate of Mo in the biofilm due to metabolism, y (unitless) is the electron equivalence of the substrate, f (unitless) is the fraction of electrons recoverable for current, and n (unitless) is the number of electrons transferred by a redox mediator. Note that an uppercase “R” in the provided equations indicates that the reaction is taking place in the biofilm matrix (i.e., is a volumetric reaction), whereas a lowercase “r” indicates that the reaction is taking place at the electrode surface. The biofilm is grown on a polarized electrode, where Mr and Mo can be oxidized and reduced, respectively, depending on the polarization potential. By convention, positive current is produced when the electrode oxidizes Mr, releasing electrons to the electrode and ultimately the electrochemical cell circuit. Negative current is produced when Mo is reduced. While the reaction at the electrode is reversible, it is assumed that Mr does not have the ability to deliver electrons back into the cell. The reaction of the mediator at the surface is governed by Butler-Volmer kinetics. The oxidation rate of Mr is given by:
| (8) |
where ro (mol m−2 s−1) is the oxidation rate of Mr at the electrode surface, Mr (mM) is the reduced mediator concentration, k0 (m s−1) is the standard heterogeneous rate constant for the mediator redox reaction, α (unitless) is the transfer coefficient for the mediator redox reaction, ε (VSHE) is the polarized electrode potential, and E0′ (VSHE) is the standard redox potential for the mediator redox reaction. The reduction rate of Mo, rr (mol m−2 s−1), is given by:
| (9) |
The reduction of Mo results in the formation of Mr; thus, the net generation rate of e− at the electrode surface, rM (mol m−2 s−1), is given by:
| (10) |
Conduction-based extracellular electron transfer
There is currently a debate as to exactly how conduction-based EET occurs in electrochemically active biofilms, whether by electron superexchange or by metallic-like conduction.24, 41, 42 However, in both cases electrons are conducted through the biofilm matrix, electron transfer occurs on shorter time scales than molecular diffusion, and current must be conserved. The steps of conduction-based EET can be summarized as:
Electrons originate in the biofilm in proportion to substrate utilization, , and propagate in a single direction toward the electrode. The rate at which e− is generated in the biofilm through metabolism, RC (mol m−3 s−1), and becomes available for conduction-based EET is given by:
| (11) |
Similar to the assumption for diffusion-based EET, electrons cannot be sent back to the cells (the microbial respiratory electron transport chain cannot work in reverse). In the future, this assumption may be modified to model cathodic electrochemically active biofilms that oxidize substrates extracellularly and may have applications in high-value chemical production (e.g., via electrosynthesis).
Mass balances
A mass balance of substrate within the biofilm is given by:
| (12) |
where DeS (m2 s−1) is the effective diffusion coefficient of substrate. Diffusion through a biofilm is impeded by high tortuosity in the matrix and interactions with both cells and extracellular polymeric substances; therefore, an effective diffusion coefficient is used. For solutes at low concentrations, where the chemical activity of the solute is close to unity (i.e., as in an ideal solution),43 the effective diffusion coefficient of any solute to which Fick’s laws are applicable can be obtained from:
| (13) |
where Dei (m2 s−1) is the effective Fickian diffusion coefficient of solute i, Di (m2 s−1) is the bulk liquid Fickian diffusion coefficient of solute i, De (m2 s−1) is the effective self-diffusion coefficient of water, and Daq (m2 s−1) is the bulk liquid self-diffusion coefficient of water. Note that the ratio De/Daq is called the relative effective diffusion coefficient, Dr (unitless). Eqn (13) is used for the solutes in this model. Mass balances of the oxidized and reduced mediator are given by:
| (14) |
| (15) |
It is assumed that the effective diffusion coefficients of the oxidized and reduced forms of the mediator are identical. Full justification for this assumption is given below in the Model Parameters section. Thus, if the initial concentration of mediators is uniform, then .
Current and potential
The overall current density produced by diffusion-based EET, jM (A m−2), is given by a form of Faraday’s law:
| (16) |
The current density produced by conduction-based EET, jC (A m−2), is a result of the cumulative electrons produced in the biofilm that are available through substrate utilization via conduction-based EET. Performing an electron balance on the biofilm yields:
| (17) |
It is assumed that the time required for electrons to travel through the biofilm is negligible compared to the time scale of the diffusion of dilute solutes in the biofilm; electrons are conducted instantaneously. For simulations considering the isolated-dual and interacting-dual EET cases, the total current density, j (A m−2), is the total current derived from both underlying EET mechanisms (diffusion-and conduction-based):
| (18) |
Therefore, for the isolated-dual and interacting-dual EET cases, the fraction of current provided by the underlying diffusion-based EET, d (unitless), and conduction-based EET, c (unitless), can be quantified as:
| (19) |
The phrase “percentage of EET mechanism” is herein used to refer to the percentage of current collected at the electrode by means of a particular mechanism. Coulombic efficiency (unitless), the ratio of the rate at which electrons are delivered to the electrode to the rate at which electrons are taken from the substrate, is calculated as:
| (20) |
Two different potentials are of primary interest in electrochemically active biofilms. First, because the biofilm matrix is conductive, a local biofilm potential, E (VSHE), can be calculated. Ohm’s law describes the current-voltage relationship for metallic-like conduction or for electron hopping, assuming that the distance between adjacent redox molecules is small24. The conductivity, κ, is only associated with electron movement within the biofilm matrix; it does not consider any ions or redox couples that are in solution outside of the matrix.
| (21) |
In the future, a different current-voltage relationship may be used if a consensus is formed regarding the true nature of conduction-based EET. Note that electron hopping has also been simulated as a diffusional process, using an effective electron diffusion coefficient to dictate the rate of electron flux for a given potential gradient23. The second potential of interest, the redox potential, Eredox (VSHE), which is associated with the soluble redox-active compounds in the biofilm interstitial space, can be calculated by applying the Nernst equation to the single redox couple, the mediator:
| (22) |
Note that the redox potential is generally a function of both mediator concentrations and pH.44, 45 This is based on the assumption that the mediator undergoes a proton-coupled redox reaction:
| (23) |
where m is the number of protons transferred per mediator redox reaction (note that if n≠m, other products, likely including buffering components, need to be included in this equation to ensure a net charge balance). However, because the standard reduction potential for this reaction is given in the biochemical standard state, and because it is assumed that the pH in the biofilm will be neutral and unchanging, a pH correction term is not included in eqn (22). Further justification for this is provided in the Model Application section.
A succinct summary of the entire system of equations, the initial and boundary conditions, and a schematic representation of the model (Figure S1) are provided in the Supplementary Information.
Interacting-dual extracellular electron transfer: mediator interactions with a conductive biofilm matrix
The above model formulation represents the “standard case.” However, we also wanted to explore the hypothesis that mediators are able to interact with, that is, exchange electrons with, a conductive biofilm matrix. This means that reduced mediators may transfer their electrons to the matrix and, likewise, oxidized mediators may accept electrons from the conductive matrix. In this case, dubbed interacting-dual EET, the matrix acts as an extension of the electrode and electron exchange can occur between mediators and the matrix, just as it can between mediators and the electrode surface. Mediators may not have to travel the entire distance between the reducing cell and the oxidizing electrode surface to transfer electrons. We wanted to explore this idea because of the mounting evidence of mediator and cytochrome interactions and the critical role cytochromes play in electrochemically active biofilm EET.46–49
We classify that any electrons that pass from a mediator into the conductive matrix and then proceed to the electrode are now considered arriving via conduction-based EET, while any electrons that pass from the conductive matrix to a mediator that is subsequently oxidized at the electrode surface is now considered arriving via diffusion-based EET. In simpler terms, the final form of transport that the electron encounters before being accepted by the electrode is the EET form attributed to it, regardless of the EET mode(s) it experienced along its journey. This distinction is required to quantify the percentage of each EET mode. The steps for interacting-dual electron transfer consist of steps from both diffusion- and conduction-based EET. Note that the steps shown here are only an example, as electrons may transfer between mediators and the conductive matrix several times before reaching the electrode.
A new variable is defined, the specific electrochemically active surface area, Sa (m−1), which is a measure of the active surface area available per volume of conductive biofilm matrix with which the mediator species can interact. This is based on the idea that even if the biofilm is highly conductive, generally only specific sites will be electrochemically active and allow interaction with electron mediators. This is unlike metal conductors, whose entire surface is generally available for electron transfer. An electrochemically active area may include c-type cytochromes, which have been found on nanowires, bound in extracellular polymeric substances, and on the outer membrane of S. oneidensis cells.48, 50–52
The following equations and modifications are relevant only to the cases in which mediators are allowed to interact with the matrix. First, the biofilm is now able to oxidize and reduce the mediators based on the local biofilm potential, as defined by eqn (21). This leads to a new set of redox reactions for the mediators in the biofilm. Similar to the redox reactions occurring at the surface of the electrode, it is assumed that the redox reactions occurring in the conductive biofilm matrix will follow Butler-Volmer kinetics. The oxidation rate of Mr in the biofilm due to interaction with the conductive matrix, Ro (mol m−3 s−1), is given by:
| (24) |
A new standard heterogeneous rate constant, , and transfer coefficient, αb (unitless), are used because it is not currently known whether these values will be the same for redox reactions occurring on the conductive biofilm matrix as for those on the electrode surface. The reduction rate of Mo, Rr (mol m−3 s−1), is given by:
| (25) |
A net generation rate of e− in the biofilm conductive matrix, RSa (mol m−3 s−1), is given by:
| (26) |
The new mass balances of the mediator are given by:
| (27) |
| (28) |
Eqn (27) and (28) replace eqn (14) and (15), respectively. Performing an electron balance on the biofilm yields:
| (29) |
This equation replaces eqn (17).
Model Implementation
The model was executed using a MATLAB client connection (Mathworks, Natick, MA, USA) to run finite element method software Comsol Multiphysics (COMSOL Inc., Burlington, MA, USA). This is similar to a previous squarewave voltammetry model developed by our group to simulate a voltammetric flavin microelectrode for use in biofilms.53 Briefly, a MATLAB m-file was initially generated using the Comsol chemical engineering module diffusion application mode for a surface reaction. This scaffold file was then structured to encompass all model parameters, geometry, finite element meshing, solvers (both stationary and time-dependent), and post-processing visualization.
Squarewave and cyclic voltammetry simulations were executed using independent custom m-files that controlled the dynamic electrode polarization potential, ε. Diagrams of the voltammetric wave forms are provided in the Supplementary Information (see Section IV Voltammetric Wave Forms, Fig. S4). To avoid jump discontinuities when squarewave simulations were run, which would prevent model convergence, the voltammetric signal changes between peak and trough potentials were approximated by a differentiable, and thus continuous, spline function consisting of two quarter-sine waves connected by a straight line, as developed in Nguyen et al.53 and shown in Figure 2. This was chosen over a Fourier series expansion to avoid Gibbs ringing artifacts in the model.
Figure 2.
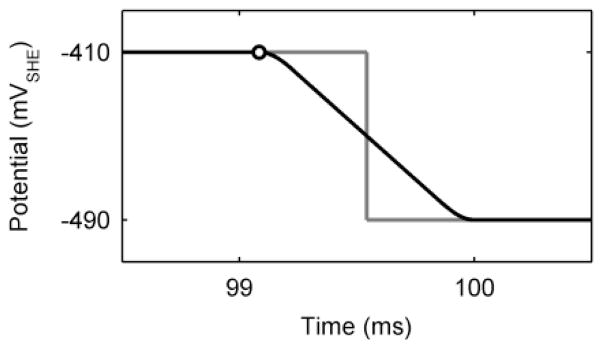
A spline function consisting of two quarter-sine waves connected by a straight line is used to smooth the transition between high and low potentials during simulated squarewave voltammetry (black line). The open circle shows the time when current is measured for the end of peak potential. The grey line shows the ideal unsmoothed transition.
The one-dimensional FEM mesh includes 10,000 elements, spaced 10 nm apart for the standard case. During SWV and CV simulations, the maximum time step was set to 100 μs. Relative and absolute tolerances were set to 10−11. These FEM settings were tested to ensure that increasing the number of elements and decreasing the maximum time step and tolerances did not significantly change the solution. It was concluded that these settings were more than rigorous enough to handle the rapid changes in the SWV waveform.
A one-at-a-time sensitivity analysis was performed to measure the sensitivity of steady state current production, j, and the fraction of current due to diffusion-based EET, d, to the model input parameters. The sensitivity was evaluated by calculating the resulting average elasticity given a ±25% change in each parameter. Elasticity, δ (unitless), also called relative sensitivity, measures the proportional effect of a change in a parameter value, p, on a model output.
| (30) |
| (31) |
Model Application: A Shewanella oneidensis biofilm
For the standard case, a four-day-old S. oneidensis MR-1 biofilm growing on a polarized graphite electrode was simulated. A four-day-old biofilm was chosen based on the availability of literature data. In the simulation, the electrode was the only available terminal electron acceptor, as no soluble electron-accepting chemicals were included and the system was therefore anaerobic. All parameter values discussed here for the standard case are summarized in Table 1. The polarization potential of the electrode was set at +300 mVSHE. This value was chosen to ensure that current production would not be limited by an insufficiently positive electron acceptor potential (note that while electrochemical reactions are not theoretically limited at this potential via Butler-Volmer kinetics, the biomass of Shewanellaceae biofilms have been shown to increase at more positive potentials72). The temperature was set at 30 °C, which is common for the growth of S. oneidensis MR-1.21, 22, 25, 39, 56, 57 Most parameters were chosen assuming a four-day-old biofilm, similar to that of Baron et al.56 and Renslow et al57. Based on these studies, a biofilm thickness of 100 μm and a lactate concentration of 25 mM were chosen. It was assumed that the impact of pH was negligible. This is based on microelectrode measurements by our group showing that inside a 100- to 200-μm-thick S. oneidensis biofilm respiring on a +600 mVSHE polarized electrode, pH varied by only 0.08 units45. Furthermore, when the phosphate buffer strength was changed from 10 mM to 100 mM the pH variance was found to be zero. Small pH variances for low-current, well-buffered systems have also been predicted by mathematical models.33, 73
Table 1.
Summary of model parameter values for the standard case
| Symbol | Description | Value | Units | Ref |
|---|---|---|---|---|
| Constants and system parameters | ||||
| ε | Polarized electrode potential | +300 | mVSHE | 54 |
| F | Faraday constant | 96485.3399 | s A mol−1 | 55 |
| R | Molar gas constant | 8.314472 | J K−1mol−1 | 55 |
| T | Temperature | 303.15 | K | 21, 22, 25, 56, 57 |
| Computation Parameters | ||||
| Number of finite elements | 10,000 | unitless | ||
| Finite element size | 0.01 | μm | ||
| Biofilm parameters | ||||
| Dr | Relative effective diffusion coefficient | 0.89 | unitless | 57 |
| f | Fraction of electrons recoverable for current | 0.6 | unitless | 39, 58, 59 |
| L | Biofilm thickness | 100 | μm | 57 |
| qmax | Maximum specific lactate utilization rate | 0.002 | mmol g protein −1 s−1 | 60 |
| X | Biofilm density | 1700 | g protein m −3 | 57, 61, 62 |
| Substrate parameters | ||||
| S | Bulk lactate concentration | 25 | mM | 57 |
| DeS | Effective diffusion coefficient for lactate | 1.09 · 10−9 | m2 s−1 | 57, 63–66 |
| KS | Half-saturation constant for lactate | 13.2 | mM | 60 |
| y | Electron equivalence of lactate | 4 | mmol-e− mmol-La−1 | 39, 67, 68 |
| Diffusion-based EET parameters | ||||
| Mo(bulk) | Bulk FMN concentration | 1 | μM | 25, 40 |
| Mr(bulk) | Bulk FMNH2 concentration | 0 | μM | |
| DeM | Effective diffusion coefficient for FMN/FMNH2 | 0.43 · 10−9 | m2 s−1 | 57, 63–66 |
| E0 | Standard redox potential for the FMN/FMNH2 redox reaction | −217 | mVSHE | 69 |
| k0 | Standard heterogeneous rate constant for the FMN/FMNH2 redox reaction | 1.6 · 10−5 | m s−1 | 70 |
| n | Electrons transferred per FMN/FMNH2 redox reaction | 2 | unitless | 70 |
| KM | Half-saturation constant for FMN | 0.1 | μM | 29 |
| α | Transfer coefficient for the FMN/FMNH2 redox reaction | 0.5 | unitless | 71 |
| Conduction-based EET parameters | ||||
| EKA | Half-maximum rate potential | −155 | mVSHE | 54 |
| κ | Biofilm conductivity | 0.5 | mS cm −1 | 54 |
Renslow et al.57 determined that the average relative effective diffusion coefficient, Dr, of a 100-μm-thick four-day-old biofilm was 0.89. Although the biofilm in that study was grown on a glass substratum as opposed to a polarized electrode, the Dr was found to be nearly identical to that of a 14-day-old S. oneidensis biofilm that was grown on a polarized electrode (Dr of 0.88)74. The biofilm density can be approximated from the following equation, which is modified from Renslow et al.57 and Fan et al.61 It assumes a 50% weight percent protein composition62, 75 (this is similar to the 55% weight percent protein used by Marcus et al.26, which was derived from Whitman et al.76):
| (32) |
As defined by eqn (32), for a Dr of 0.89, X is 1700 g-protein m−3. The maximum specific substrate utilization rate, 0.002 mmol g−1 s−1, and the half-saturation constant for lactate, 13.2 mM, were selected based on Tang et al.60 and Zeng and Zhang;77 however, other values are explored later in this study. Table S1 in the Supplementary Information shows the coulombic efficiencies of several anaerobic S. oneidensis MR-1-based microbial fuel cells. The highest coulombic efficiencies are 48–56%. From these data, the maximum fraction of electrons obtainable for current, f, is set at 0.6.
In the simulation, cells gain energy through the partial oxidation of lactate to acetate.39, 67, 68 This results in an electron equivalence value of 4 mmol-e− mmol-lactate−1:
| (33) |
Note that the partial oxidation of lactate to acetate yields 66.7% fewer electrons than the complete oxidation to carbon dioxide and that, while S. oneidensis MR-1 appears to be incapable of oxidizing lactate to completion under normal anaerobic conditions, other strains of S. oneidensis appear capable of the complete oxidation of lactate.58
Flavin mononucleotide (FMN), simulated as undergoing a fast single two-electron transfer step redox reaction with a standard redox potential of −217 mVSHE, was chosen as the mediating molecule for diffusion-based EET.7,10–13 See the extended flavin discussion in the Supplementary Information for more information regarding the assumptions for FMN as the mediating molecule. For the reduction and oxidation of FMN on the graphite electrode, a standard heterogeneous rate constant, k0, of 1.6 × 10⁻³ cm s−1 was assumed, based on the value obtained by Verhagen and Hagen for flavin adenine dinucleotide on a glassy carbon electrode70 (flavin adenine dinucleotide is related to FMN, having the same redox-active isoalloxazine group as FMN). This heterogeneous rate constant value is within the normal range given by Bard and Faulkner71 and similar to the standard heterogeneous rate found for cytochrome c on a glassy carbon electrode.78 Furthermore, it is assumed that the redox transfer coefficient is 0.5, which implies a symmetric energy barrier for the forward and reverse FMN redox reactions.71 Later in this study we explore the effect of different redox transfer coefficients, in part because Verhagen and Hagen found that for the redox of flavin adenine dinucleotide on glassy carbon, the transfer coefficient was around 0.34.70
The standard case simulation assumed an endogenous concentration of FMN only. Valesquez-Orta et al.40 studied S. oneidensis in a microbial fuel cell setup and found endogenous concentrations of extracellular FMN up to 0.1 μM and negligible extracellular riboflavin and flavin adenine dinucleotide in the anodic chamber after four days. On the other hand, von Canstein et al.25 found that planktonic S. oneidensis cultures produced 2 μmol gprotein−1 FMN, but negligible riboflavin and flavin adenine dinucleotide in 24 hours. If the standard case biofilm produced this amount, the concentration of FMN inside the biofilm would reach 3.4 μM. These numbers highlight the current dilemma in diffusion-based EET research, where the concentration of mediators inside the biofilm is likely to be much higher than that detected in the surrounding bulk liquid. For the standard case simulation, we assumed a concentration of 1 μM FMN, which represents a conservative estimate based on current understanding. This is similar to the concentration our group found near the base of an S. oneidensis biofilm using a voltammetric flavin microelectrode.53 Later in this study, the addition of exogenous mediators is explored through a parametric study to determine the effect on current and percentage of the EET mechanism. Baron et al.56 and Velasquez-Orta et al.40 added up to 5 μM of flavins, and Covington et al.79 added up to 10 μM of flavins. In this study we explore concentrations up to 30 μM. The half-saturation constant for FMN, Km, is 0.1 μM, which is 10% of the initial bulk FMN concentration, analogous to the value used by Picioreanu et al.29
The diffusion coefficients of all species in this model were calculated based on the Hayduk and Laudie method at 30 °C.65 See the extended diffusion coefficient discussion in the Supplementary Information for more details regarding this method. The diffusion coefficients of FMN and FMNH2 were assumed to be the same, because the diffusion coefficients of the oxidized and reduced forms were within 2% of each other. The diffusion coefficient was calculated to be 0.48 · 10−9 m2 s−1 at 30 °C, and thus the effective diffusion coefficient of FMN was 0.43 · 10−9 m2 s−1. The calculated diffusion coefficient of lactate was 1.22 · 10−9 m2 s−1, and the effective diffusion coefficient was 1.09 · 10−9 m2 s−1.
The final set of parameters listed in Table 1 relates to the conduction-based EET mechanism. Torres et al.54 showed that the macroscopic conductivity must be greater than or equal to 0.5 mS cm−1 using a model developed with the Nernst-Monod equation. For the standard case, we used 0.5 mS cm−1 because this conductivity is sufficient to prevent deviation from the Nernst-Monod ideal shape. Note that recent conductivity measurements of individual S. oneidensis nanowires were approximately 1000 mS cm−1.80 See Table S2 in the Supplementary Information for a materials conductivity comparison. Later in this study we show how the EET mechanism and current production are affected by different biofilm conductivities. Torres et al.54 found the measured half-maximum rate potential of a mixed-species wastewater biofilm with predominantly G. sulfurreducens to be −155 mVSHE. Furthermore, Marcus et al.26 originally predicted the half-maximum rate potential to be around 100 mV more positive than the open circuit anode potential. The anode open circuit potentials of S. oneidensis-based microbial fuel cells are generally around −260 mVSHE.58, 81 From these studies, we assume that the EKA of S. oneidensis will also be around −155 mVSHE.
Currently it is not known how much of an S. oneidensis biofilm is available for electrochemical interactions with flavin mediators. However, it is known that outer membrane cytochromes are critical for extracellular electron transfer46, 49, 82, and flavin molecules have been confirmed to interact with these proteins.47, 49 To estimate the surface area available for electron transfer between the matrix and the flavin mediators (Sa) we relied on atomic force microscopy and antibody recognition force microscopy of the outer membrane cytochromes (OmcA and MtrC) performed by Lower et al. (2007 and 2009).48, 83 They estimated that S. oneidensis MR-1 has between 4 · 1015 and 7 · 1015 cytochromes per square meter of surface area. The estimated surface area of a single rod-shaped S. oneidensis cell is 6.48 μm2, calculated using average measurements of cell length (3.38 μm) and width (0.61 μm) at 22 °C.84 Assuming a middling cytochrome coverage of 5.5 · 1015 m−2 and an average cytochrome diameter of 6.5 nm85, the cytochrome surface area coverage percentage is around 18%, which is similar to the 16% estimated by Lower et al.48 Assuming a single cell density of 1 g/cm3 (yielding a cell mass of 4.64 · 10−13 g-protein, comparable to that of Neidhardt et al.86) and a biofilm density of 1700 g-protein m−3, the estimated total cell surface area per volume is 24,000 m2/m3. This yields an estimated Sa of 4300 m−1. A reasonable range would be between 1900 and 8300 m−1, based on the variability of cell sizes, cytochrome surface coverage, and cytochrome sizes. However, the true Sa may be much smaller (even zero) because of steric hindrance of redox-active sites or the inability of flavin-cytochrome reactions to translate electrons to/from the conductive matrix. Note that the above calculations are based on outer membrane cytochromes located on the cell surface. However, it has been shown that the c-type cytochromes of Shewanella species can be secreted onto the extracellular polymeric substances and may not be associated with the cell surface.87 Future studies may further refine our estimation of Sa as more knowledge is gained on the role of cytochromes in the extracellular polymeric substances and their function in EET. In the standard case, Sa is not utilized. However, when the possible interactions between diffusion-and conduction-based EET are explored for interacting-dual EET, Sa is set to 4300 m−1, unless otherwise noted. It is also assumed that the redox transfer coefficient and the standard heterogeneous rate constant of the FMN/FMNH2 redox reactions are the same at the biofilm conductive matrix as they are at the electrode surface (i.e., αb = α and ).
Results and Discussions
To ensure that our model was robust and capable of handling a wide array of input parameters, a complete one-at-a-time parameters analysis was performed. This is presented in full in the Supplementary Information (Section IV Parameter Analysis). These results demonstrate that the model could indeed converge to a steady state solution for a wide range of parameters. The initial conditions were also tested to ensure that our solution was not dependent on the initial conditions of the model. This is presented in the Supplementary Information (Section II Steady State Solution Convergence). Four initial conditions were tested, representing four extremes, and it was found that all the conditions yielded the identical final solutions (measured as current, percentage EET, and mediator depth profiles) and that they all converged smoothly and rapidly.
Here we apply our model to answer questions that are critical for understanding EET in S. oneidensis. Furthermore, by varying the model parameter values from the standard case parameter values listed in Table 1, we compare and contrast features of another model electrochemically active biofilm, G. sulfurreducens, with those of S. oneidensis. We chose the standard case from commonly observed experimental or theoretically accepted parameter values, as described in the Model Application section. Throughout this study, white-filled circles in figures represent the results at the given locations for the standard case, provided in Table 1.
How does the fractional distribution of extracellular electron transfer mechanisms affect theoretical current production?
Figure 3 shows the steady state current production and coulombic efficiency as a function of the percentage of diffusion-based EET (without allowing the EET mechanisms to interact, i.e., isolated-dual EET). In the standard case, the steady state current density is 0.046 A/m2, with ~13% of the current coming from diffusion-based EET (~87% coming from conduction-based EET) and a coulombic efficiency of 53%. This is similar to current measured in actual S. oneidensis systems.45, 59, 74, 88 Figure 3 shows that as the percentage of diffusion-based EET decreases, the current increases to a maximum of 0.052 A/m2 at 100% conduction-based EET. The current reaches a minimum at 0.008 A/m2 at 100% diffusion-based EET. The coulombic efficiency also increases as more of the current is collected by conduction-based EET. Note that the highest coulombic efficiency that the model can generate is 60% because that is the fraction of electrons that are recoverable for current (see Table 1). In practical terms, these results demonstrate that no electrons are lost along the conductive EET pathway. Compared to the conduction-based EET pathway, diffusion-based EET cannot sustain high current production. This is due to several causes: 1) the slow rate of electron transfer via diffusion (a mediator flux to the electrode of ~4 · 10−8 mol m−2 s−1, compared to an equivalent flux for conduction-based EET of ~3 · 10−7 mol m−2 s−1); 2) the loss of current through the diffusion of reduced mediators out of the top of the biofilm (mediator flux loss of ~4 · 10−8 mol m−2 s−1); and 3) the reduction of nearly all of the mediators in the middle of the biofilm, resulting in a low biofilm activity (low qM) and uneven activity by depth. This will be discussed further in the Spatial Activity section below. In actual systems, diffusion-based EET may be further adversely affected by the loss of flavins due to adsorption to the electrode and the biofilm matrix25.
Figure 3.
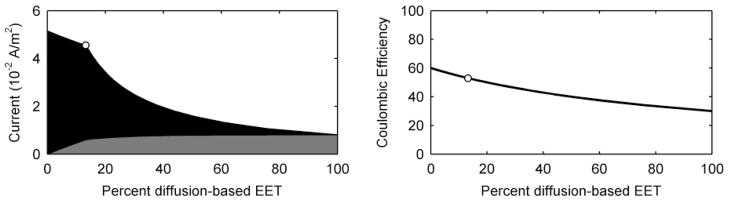
Steady state current production and coulombic efficiency as a function of changing only the percentage of EET mechanism for the standard case. Grey represents the current due to diffusion-based EET, and black represents the current due to conduction-based EET. The white-filled circles represent the parameter value and the corresponding current and percentage of EET for the model standard case.
Three cases are defined in Table 2: a low-conductivity case and two high-activity cases (distinguished as the “high-activity case” and the “2× high-activity case”). These cases were designed to determine whether diffusion-based EET could generate higher current if the biofilm conductivity or activity were changed. In the low-conductivity case, the conductivity of the biofilm is lowered to 10−5 mS/cm, identical to that used by Marcus et al. (2007) for their low-conductivity case.26 The high-activity case transforms the model to behave like a G. sulfurreducens biofilm. For this we assume a biofilm density similar to that measured in a G. sulfurreducens biofilm respiring on an electrode,74 120,000 g/m3, and a much higher maximum substrate utilization rate, 0.014 mmol g−1 s−1.60 The 2× high-activity case is identical, except that the maximum substrate utilization rate is set to 0.028 mmol g−1 s−1. For each case, we explore the results when both EET mechanisms are allowed, when only conduction-based EET is allowed, and when only diffusion-based EET is allowed.
Table 2.
Steady state current production, local biofilm potential drop, and percentage of mediators in the reduced form in the biofilm for the standard case, low-conductivity case, and high-activity cases. Results are shown for when both EET mechanisms are allowed, for diffusion-based EET only, and for conduction-based EET only. The top row displays the parameter values that are used for each case, if they are different from the standard case as given in Table 1.
| Parameter values | Standard Case | Low-Conductivity Case | High-Activity Case | 2× High-Activity Case |
|---|---|---|---|---|
|
| ||||
| See Table 1 κ = 0.5 mS/cm |
κ = 10−5 mS/cm | qmax = 0.014 mmol g−1 s−1 X = 120,000 g/m3 |
qmax = 0.028 mmol g−1 s−1 X = 120,000 g/m3 |
|
|
| ||||
| Both EET mechanisms | 0.046 A/m2 | 0.024 A/m2 | 24.09 A/m2 | 45.62 A/m2 |
| < 1-mV drop | 530-mV drop | 24-mV drop | 47-mV drop | |
| 80.1% mediators reduced | 82.4% mediators reduced | 99.1% mediators reduced | 99.2% mediators reduced | |
| 100% Conduction-based EET | 0.052 A/m2 | 0.022 A/m2 | 24.22 A/m2 | 45.81 A/m2 |
| < 1-mV drop | 533-mV drop | 25-mV drop | 47-mV drop | |
| 100% Diffusion-based EET | 0.008 A/m2 | 0.008 A/m2 | 0.18 A/m2 | 0.25 A/m2 |
| 84.5% mediators reduced | 84.5% mediators reduced | 99.2% mediators reduced | 99.4% mediators reduced | |
Table 2 shows the predicted steady state current, the local biofilm potential drop inside the biofilm, and the percentage of mediators in the biofilm that are in the reduced form. The data reveal several reasons diffusion-based EET is not well suited to high current production. First, in all cases the majority of the mediators are in a reduced form. This shows that a mediator concentration of 1 μM severely limits diffusion-based EET. Other studies in the literature are consistent with this result because increasing the mediator concentration in the system can increase current production.40, 56, 79 Second, in all cases except the low-conductivity case, we see that having both diffusion- and conduction-based EET results in lower current than conduction-based EET alone. This result is not intuitive because it is anticipated that allowing for a second electron transfer pathway would increase current production by decreasing the electron acceptor bottleneck. This made us ask the question: When would having both EET mechanisms be beneficial for the biofilm? This question is addressed in the next section. A third trend in the Table 2 data is that current produced solely by diffusion-based EET always remains very low (well under 1 A/m2), while conduction-based EET can reach much higher current values. Specifically looking at the high-activity case, conduction-based EET is capable of significantly higher current, comparable to current produced experimentally in G. sulfurreducens.44 For 100% diffusion-based EET at high activity, nearly all of the mediators are in the reduced form. Increasing the activity as in the 2× high-activity case only increased the percentage of reduced mediators by 0.2%. This demonstrates the intrinsic limitation of diffusion-based EET: even if the biofilm is capable of higher activity, the low concentration and slow diffusion of mediators restrict the amount of current that is possible. Similar to the predictions made by Torres et al.,18 these results confirm that diffusion-based EET cannot account for most of the current produced in common microbial fuel cells. Some form of conduction-based EET must be present.
In summary, our simulation results show that diffusion-based EET cannot sustain high current (>1 A/m2). This is due to both the slow rate of transfer via diffusion and the loss of current caused by the diffusion of reduced mediators out of the biofilm into the bulk solution. Conduction-based EET is required for higher current production, like that observed for G. sulfurreducens biofilms. Finally, we conclude that the use of any diffusion-based EET is likely to decrease the efficiency of electron transfer for S. oneidensis. This most likely explains why higher coulombic efficiencies are observed in batch systems. In batch systems, mediators are allowed to accumulate in the supernatant, decreasing the number of electrons that are lost from the system. In continuously fed systems, the mediators are washed out of the reactor.
When would the simultaneous use of both extracellular electron transfer mechanisms be beneficial for the biofilm?
From the results presented in Table 2, it is reasonable to determine whether a biofilm may benefit from using multiple EET mechanisms. From the standard-case results, it appears that 100% conduction-based EET will always yield the highest current and thus support the highest level of metabolism. However, there are cases when having both modes of EET available can enable higher levels of metabolism than either mode alone. The low-conductivity case shown in Table 2 presents one such example. When conductivity is low, the potential drop (533 mV) inside the biofilm begins to restrict conduction-based EET. Adding mediators provides a secondary electron acceptor and reduces the load on the conductive biofilm matrix. However, this addition is small, providing only a 9% increase in current over conduction-based EET alone.
A second example in which the utilization of both EET modes provides a metabolic benefit is when the electrode potential is very low, for example, when the electrode has a potential equal to the half-maximum rate potential. This condition is akin to the environment experienced by cells located in anoxic subsurface sediments or wetland soils, where the terminal electron acceptors (e.g., Fe3+, SO42+, CO2, etc.) may have low standard reduction potentials.89 Figure 4 shows current and coulombic efficiency as a function of the percentage of diffusion-based EET when the electrode potential is equal to the half-maximum rate potential. The peak current occurs when there is ~20% diffusion-based EET, giving a 21% increase in current over conduction-based EET alone. Note that this is only possible because the half-maximum rate potential for conduction-based EET is more positive than the standard reduction potential of FMN.
Figure 4.
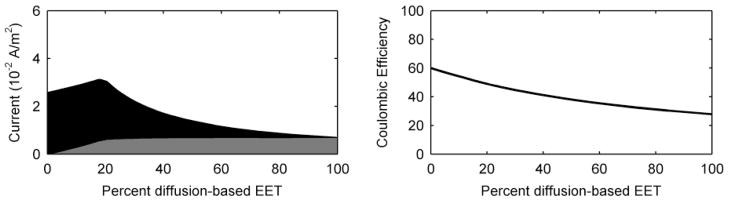
Steady state current production and coulombic efficiency as a function of the percentage of the EET mechanism for a case in which the electrode potential is equal to the half-maximum rate potential. Grey represents the current due to diffusion-based EET, and black represents the current due to conduction-based EET.
Because there is evidence of both diffusion- and conduction-based EET in S. oneidensis, we hypothesize that there must be a metabolic advantage for having both mechanisms. The model demonstrates that if the biofilm conductivity is low, if the biofilm half-maximum rate potential and mediator standard reduction potential are different, and/or if the terminal electron acceptor potential is very low, then there may be an advantage to having both mechanisms available concurrently. Later in this study, it is shown that having both diffusion- and conduction-based EET mechanisms further improves the current production if the mechanisms are allowed to interact (i.e., interacting-dual EET).
In summary, our simulation results show that the availability of diffusion-based EET does not contribute to increased biofilm metabolism unless conduction-based EET is restricted or unavailable. As a specific case, when the electrode potential is equal to the half-maximum rate potential, the total current can increase when some diffusion-based EET is allowed, even though the overall coulombic efficiency drops. Finally, under natural conditions, having both mechanisms available could provide a metabolic advantage for S. oneidensis.
How does biofilm spatial activity affect the extracellular electron transfer mechanism?
Current production, while generally attributed to the biofilm as whole, is a product of electrons generated throughout the biofilm and is likely not a spatially homogenous phenomenon. It is important to understand where the electrons come from within the biofilm. Furthermore, the spatial activity inside the biofilm can provide more clues as to why S. oneidensis may have more than one EET mechanism available simultaneously. Figure 5 shows the metabolic activity through the biofilm thickness, as measured by q (qM and qC shown separately as grey and black, respectively). Also shown are the percentages of qM and qc over the biofilm thickness. These represent the spatially resolved EET mechanism(s) utilized to accept electrons within the biofilm. Because the mediators may accept electrons and then diffuse out of the top of the biofilm, the values presented in Figure 5 do not necessarily reflect the EET mechanism percentages for electrons that contribute to current at the electrode. For the standard case, electrons are produced evenly throughout the biofilm. As discussed above, diffusion-based EET is not utilized in the middle of the biofilm, solely because all the mediators are in the reduced form and cannot accept more electrons. Diffusion-based EET is maximized near the base of the biofilm, where the mediators are oxidized by the electrode, and near the top of the biofilm, where oxidized mediators diffuse into the biofilm. For the low-conductivity case, the base of the biofilm looks similar to the standard case; however, near the middle and top of the biofilm qM falls off rapidly. This is due to the local biofilm potential drop caused by the low conductivity. In this case, the top of the biofilm has a local biofilm potential of only −230 mVSHE, preventing the transfer of electrons through conduction; however, diffusion-based EET allows the top of the biofilm to stay active. Note that most of the electrons produced near the top of the biofilm are subsequently lost to the bulk liquid via mediator diffusion, resulting in a coulombic efficiency of only 45%. While this state is counterproductive for extracting energy from electrochemically active biofilms for practical applications, for biofilm survival, having both mechanisms provides a way for cells near the top to survive. A primary finding from these results is that the EET mechanism depends on the local microenvironment conditions.
Figure 5.
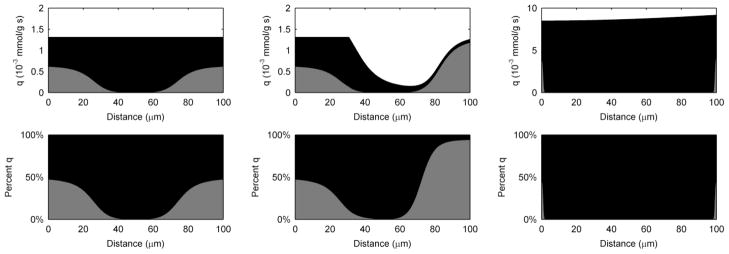
Biofilm activity by depth as measured by the substrate utilization rate, q, and percentage of q obtained using diffusion-based or conduction-based EET. Grey represents the portion due to diffusion-based EET, and black represents the portion due to conduction-based EET. Left) standard case, middle) low-conductivity case, right) high-activity case.
For the high-activity case, diffusion-based EET is negligible. This is because conduction is the only EET mechanism capable of transferring the large quantity of electrons associated with high activity. One peculiar feature of high activity is that more electrons are generated near the top of the biofilm, even though this region is far from the electron acceptor. This is possible because the conductivity of the biofilm is high enough in this case not to be a limitation; thus, activity and electron production are highest near the top of the biofilm, where the substrate concentration is the highest. In Figure 6, this ability is highlighted by the simulation of a thick (750-μm) biofilm using the 2× high-activity parameter values and conduction-based EET alone. Here we see that the top of the biofilm is very active, but the base has negligible activity. The substrate concentration depth profile shows that the electron donor is restricted from the base of the biofilm (Figure 6). Recently, our group obtained supporting experimental results for a several-hundred-micron-thick G. sulfurreducens biofilm grown in an electrochemical-nuclear magnetic resonance microimaging reactor.90 In that study, the top of the biofilm was shown to be active while the base was inactive because of the lack of substrate caused by mass transfer limitations. A profile like this is only possible if the biofilm conductivity is sufficiently high to prevent a prohibitive local biofilm potential drop. Thus, if the conductivity is high enough, a biofilm grown on a solid electron-accepting surface will not have its thickness restricted by electrical resistance. It has been hypothesized in the literature that biofilms relying on conduction-based EET, composed of organisms such as G. sulfurreducens, have limited thickness because of the electrical resistance across the biofilm matrix.26, 91, 92 However, as shown in Figure 6, cells at the top of high-conductivity biofilms may be metabolically active and use the biofilm matrix as an electrical conduit, even across metabolically inactive cells.
Figure 6.

Biofilm activity by depth as measured by the substrate utilization rate, q, and the substrate concentration depth profile of a thick, highly active biofilm utilizing conduction-based EET alone.
In summary, our simulation results show that the EET mechanism depends on local microenvironment conditions. Biofilm metabolic activity controls which EET mechanism(s) will be utilized. Mediators can allow regions distal to an electron-accepting surface to be active when conductivity is low (10−5 mS/cm). When conductivity is high, the top of a conductive biofilm can be active, even when the base is limited by electron donor availability.
What are the theoretical maximum biofilm thicknesses for different conductivities?
While biofilms may grow thick enough to restrict cells at their base from receiving nutrients, for practical applications it is often desirable to have a biofilm that is entirely active across its thickness. To determine the maximum theoretical biofilm thickness, the model is restricted to cases where the biofilm is not substrate-limited and the entire biofilm is active. We define the limiting biofilm thickness to be the distance at which the Nernst-Monod term drops to below 0.01 (the point in the biofilm where the biofilm activity is restricted to just 1% of qmax by potential drop limitations). Figure 7 shows the results. For the standard case, the maximum biofilm thickness increases to several mm as the conductivity increases. This is because the biofilm activity is low for the standard case and does not produce a significant local biofilm potential drop. The low activity of S. oneidensis may be one of the reasons why it is generally capable of growing much thicker biofilms than G. sulfurreducens. On the other hand, the high-activity case predicts lower maximum biofilm thicknesses. In a previous study, we grew electrode-respiring G. sulfurreducens biofilms that were over 500 μm thick90, revealing that the biofilm conductivity may be greater than 0.01 mS/cm. In the literature, G. sulfurreducens biofilms have been shown to grow across 1-cm gaps, indicating that conductivities of >0.1 mS/cm are likely. This is similar to the predicted minimum conductivity of 0.5 mS/cm given by Torres et al.,54 which is necessary to avoid non-Nernstian low-scan CV voltammograms. From these results, and the accumulating evidence in the literature, biofilm thickness does not appear to be limited by low conductivity for most G. sulfurreducens biofilms, the majority of which are less than 100 μm thick in the literature.
Figure 7.
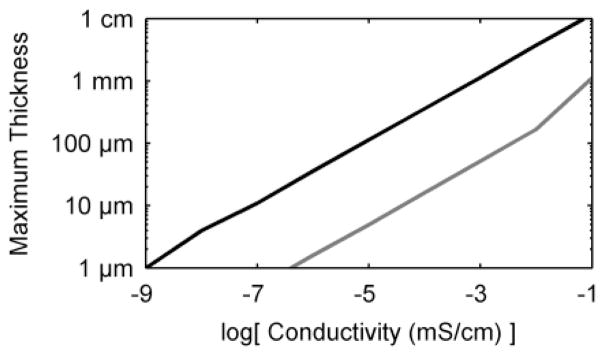
Maximum biofilm thickness as a function of conductivity, for conduction-based EET biofilms only. Black) standard case, grey) high-activity case
In summary, our simulation results show that the thickness of G. sulfurreducens biofilms is not limited by conductivity in most cases.
How does the diffusion coefficient profile affect diffusion-based extracellular electron transfer?
Historically, mathematical models of biofilm metabolism have used a constant, i.e., flat, effective diffusion coefficient profile through the depth of the biofilm.23, 26, 29, 32, 33, 73, 93, 94 This was explored in detail in a recent study by our group.74 In that study, we showed that the assumed effective diffusion coefficient profile for the substrate could affect the prediction of current output for a conduction-based EET biofilm. We hypothesized that this effect would be more pronounced for diffusion-based EET, in which the effective diffusion coefficient would influence both the substrate diffusion and the mediators. This hypothesis is tested by examining three assumptions for the relative effective diffusion coefficient profile: 1) a constant profile, 2) a linearly decreasing profile, and 3) an empirical profile. The empirical profile was obtained using pulsed-field gradient nuclear magnetic resonance of a 100-μm-thick S. oneidensis biofilm (the biofilm on which the standard case parameters were based)57. The linear profile was generated by making a linear fit between the empirical value at the top and that at the base of the biofilm. The constant profile was the average of the entire empirical profile. The profiles for these three cases are shown in Figure 8.
Figure 8.
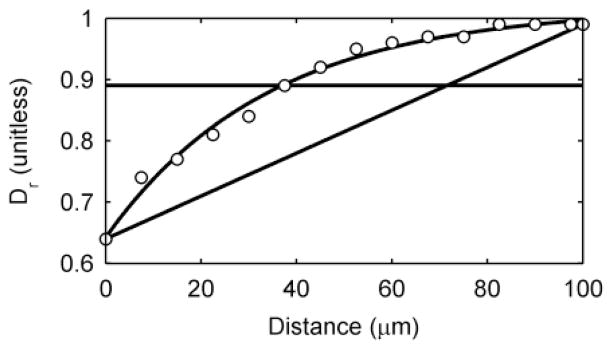
Three relative effective diffusion coefficient profiles. A constant profile, a linearly decreasing profile, and an empirical profile, based on data obtained experimentally using pulsed-field gradient nuclear magnetic resonance (data shown as white-filled circles).
Table 3 shows the effects of different relative effective diffusion coefficient profiles on steady state current and coulombic efficiency for a diffusion-based EET biofilm. Because Dr is indicative of the biofilm density, as seen in eqn (32) and discussed above, the results are shown with and without a correction for biofilm density based on the diffusion coefficient profile. With no correction for biofilm density, current densities ranged from 6.94 to 8.06 mA/m2. This variation in current densities is accounted for by the variation in coulombic efficiency and the variation in activity across the biofilm depth. When the biofilm density is corrected, the current varies by over 80%. The empirical profile yields a current density of 14.44 mA/m2 and a coulombic efficiency of 49%, compared to 8.06 mA/m2 and 30% efficiency for a constant profile. These results show the significance of using empirical diffusion coefficients to predict current. With the correction for density there is a higher biofilm activity very close to the electrode, resulting in fewer reduced mediators being lost to the bulk. In this case, the top of the biofilm acts as a protective diffusion barrier to slow the loss of mediators, keeping the mediators near the most active portion of the biofilm and the electrode. Perhaps variable relative effective diffusion coefficient and density profiles, as measured in many biofilm systems, are a life strategy of electrochemically active biofilms to minimize mediator loss and maximize redox cycling rates. In summary, our simulation results show that diffusion coefficient assumptions affect predicted current production.
Table 3.
Effects of different relative effective diffusion coefficient profiles on steady state current and coulombic efficiency for a diffusion-based EET biofilm
| Profile | Current | Coulombic efficiency |
|---|---|---|
| No correction for biofilm density | ||
| Constant | 8.06 mA/m2 | 30% |
| Linear | 6.94 mA/m2 | 27% |
| Empirical | 7.12 mA/m2 | 27% |
| With correction for biofilm density | ||
| Constant | 8.06 mA/m2 | 30% |
| Linear | 14.70 mA/m2 | 45% |
| Empirical | 14.44 mA/m2 | 49% |
Can voltammetry determine the percentage distribution of the extracellular electron transfer mechanisms used by the biofilm?
Although both diffusion- and conduction-based EET mechanisms have been observed in S. oneidensis biofilms, there have not been direct measurements of both mechanisms occurring simultaneously. Each mechanism has only been studied independently. One of our goals was to test whether simulations of common voltammetric techniques could be used to determine the percentage of electrons delivered by each EET mechanism in isolated-dual EET. If so, this would enable the use of voltammetry coupled to model fitting to distinguish the EET percentages in actual systems. While CV of electrochemically active biofilms has been simulated before,23 this is the first time it has been performed using experimentally observed parameters. This is critical if we are ever to perform model fitting of actual CVs. Figure 9 shows the simulated CV at three different scan rates (1, 200, 1000 mV/s) for different EET percentages, with a starting and minimum potential of −500 mVSHE and a maximum potential of +100 mVSHE. Because our model is an idealized simulation and lacks background currents, higher scan rates are required to observe the transient diffusion or Cottrell behavior. At the slow scan rates, typical sigmoid voltammograms are observed for all EET percentages. As the scan rate increases, Faradaic peaks become apparent for those systems that have a diffusion-based EET component. In the case of diffusion-based EET only, at 1000 mV/s we see large redox peaks centered on the standard redox potential of flavins, typical for diffusion-based EET. In the case of conduction-based EET only, the voltammogram shape is independent of the scan rate, as there are no diffusion limitations and current can flow freely in the conductive biofilm matrix. We were unable to easily identify features in the voltammograms that would allow us to back-calculate the percentage of electrons delivered by each EET mechanism. For example, the half-limiting-current slopes for the slow scan CVs (normalized by the limiting current) were not indicative of the percentage of the EET mechanism (9.6 mV−1, 9.7 mV−1, 8.8 mV−1, and 11.8 mV−1, for 100%, 87%, 50%, and 0% conduction-based EET, respectively). The ratio between maximum peak current and limiting current is linearly correlated with the percentage of the EET mechanism (e.g., at a 1000-mV/s scan rate, peak current to limiting current is 1, 1.13, 1.25, and 1.75 for 100%, 87%, 50%, and 0% conduction-based EET, respectively). However, to use this method to determine the percentages of the EET mechanisms, at least two calibration voltammograms representing biofilms with known EET mechanism percentages would need to be obtained. No method for doing this is currently known.
Figure 9.
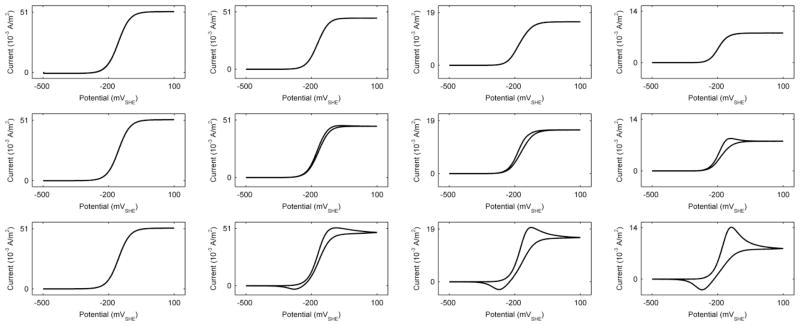
Simulated cyclic voltammograms. Each row represents a different scan rate: Top) 1 mV/s, middle) 200 mV/s, bottom) 1000 mV/s. Each column represents a different percentage of the EET mechanism: Column 1) 100% conduction-based EET only, column 2) standard case (~13% diffusion-based EET), column 3) 50/50% conduction-/diffusion-based EET, Column 4) 100% diffusion-based EET only.
Unfortunately, the simulation of squarewave voltammetry did not offer a better solution for determining the percentage of the EET mechanism. The squarewave voltammetry parameters used were a starting potential of −500 mVSHE, a final potential of 100 mVSHE, a potential step height of 5 mV, a pulse potential of 40 mV, and a 20-Hz scan frequency. These are identical to the parameters used in our previous study, which used squarewave voltammetry to detect flavin concentrations inside S. oneidensis biofilms.53 Figure 10 shows the simulated squarewave voltammetry results. The shapes of the differential-current voltammograms are nearly identical regardless of the EET mechanisms. We measured the half-height peak widths to determine whether they corresponded to percentages of EET; however, the trend was not exploitable (124.09 mV, 112.28 mV, 114.52 mV, and 103.38 mV for 100%, 87%, 50%, and 0% conduction-based EET, respectively). At least for this idealized model, CV and SQW are limited and are not good tools for determining the percentage contribution of each EET mechanism for biofilms that utilizes more than one EET mechanism. Furthermore, our idealized model cannot currently replicate some of the complex voltammograms produced in experimental systems. In summary, our simulation results show that idealized CV and SQW are currently not good tools for determining the specific percentage of the EET mechanism. A more sophisticated model, capable of simulating experimental voltammograms, will need to be developed so that the limits of these techniques can be explored and their true ability to discern the percentage distribution of the various EET mechanisms can be tested.
Figure 10.
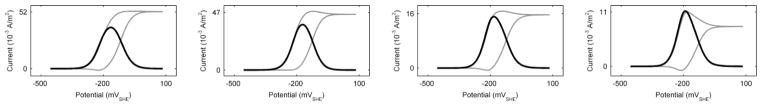
Simulated squarewave forward and backward (grey) and differential current (black). From left to right: 100% conduction-based EET only, standard case (~13% diffusion-based EET), 50/50% conduction-/diffusion-based EET, and 100% diffusion-based EET only.
Which parameters are critical for determining the extracellular electron transfer mechanisms and theoretical current production?
Although the CV and SQW simulations were not capable of determining the contributions of the various EET mechanisms, it is possible to determine which parameters are critical for determining them. To get a better idea of the impact of each parameter on current and the contributions of the various EET mechanisms, sensitivity analysis was performed by measuring elasticity. Furthermore, a complete parameter analysis was performed to cover larger parameter ranges. In principle, a model with a huge number of parameters makes it difficult to study the real underlying physical phenomena of the simulated system. Given enough parameters, a model can be forced to fit any experimental data. However, parameter and sensitivity analysis can be used to determine which parameters are critical and which are trivial. Table 4 shows the results of the sensitivity analysis. The most critical parameters for the total current were biofilm thickness, fraction of electrons recoverable for current, biofilm density, maximum specific lactate utilization rate, and electron equivalence of lactate. These parameters control how much biomass is present and how efficient that biomass is at converting substrate into electrons. It is important to remember that this sensitivity analysis is based on a variation in parameters of ±25% from the standard case. Therefore, the parameters in the sensitivity analysis were weighted to favor conduction-based EET, which accounts for 87% of current in the standard case. In this case, the electron donor is not limiting, because the potential drop is not significant across the 100-μm biofilm thickness. Parameters of secondary importance include the bulk lactate concentration and the half-saturation constant for lactate. These are only secondary because the standard case operates at a substrate concentration that would typically be described as non-limiting.
Table 4.
Sensitivity analysis as measured by elasticity [see eqn (30) and (31)]. Elasticity measures the proportional effect of a change in a parameter value. These relative sensitivities were evaluated by successively making a finite change of 25% in each independent variable and monitoring how total current, j, and percentage of current due to diffusion-based EET, d, responded.
| Symbol | Description | Total Current, j | % of Diffusion-Based EET, d |
|---|---|---|---|
| system parameters | |||
| ε | Polarized electrode potential | 0 | 0 |
| Biofilm parameters | |||
| Dr | Relative effective diffusion coefficient | −0.07 | 0.57 |
| f | Fraction of electrons recoverable for current | 1.07 | −0.59 |
| L | Biofilm thickness | 1.13 | −1.23 |
| qmax | Maximum specific lactate utilization rate | 1.07 | −0.59 |
| X | Biofilm density | 1.07 | −0.59 |
| Substrate parameters | |||
| S | Bulk lactate concentration | 0.38 | −0.21 |
| DeS | Effective diffusion coefficient for lactate | 0 | 0 |
| KS | Half-saturation constant for lactate | −0.37 | 0 |
| y | Electron equivalence of lactate | 1.07 | −0.59 |
| Diffusion-based EET parameters | |||
| Mo(bulk) | Bulk FMN concentration | −0.07 | 0.64 |
| DeM | Effective diffusion coefficient for FMN/FMNH2 | −0.07 | 0.57 |
| E0′ | Standard redox potential for the FMN/FMNH2 redox reaction | 0 | 0 |
| k0 | Standard heterogeneous rate constant for the FMN/FMNH2 redox reaction | 0 | 0 |
| n | Electrons transferred per FMN/FMNH2 redox reaction | −0.07 | 0.57 |
| KM | Half-saturation constant for FMN | 0.01 | −0.07 |
| α | Transfer coefficient for the FMN/FMNH2 redox reaction | 0 | 0 |
| Conduction-based EET parameters | |||
| EKA | Half-maximum rate potential | 0 | 0 |
| κ | Biofilm conductivity | 0 | 0 |
The most critical parameter affecting the percentage of EET is the biofilm thickness. This is expected because the current produced via diffusion-based EET consists entirely of electrons delivered to the electrode. Thus, for the standard case, in which the diffusion coefficient profile is constant, half of the electrons produced and subsequently accepted by mediators are lost to the bulk solution (thus the coulombic efficiency for 100% diffusion-based EET, shown in Figure 3, is half of f, i.e., 30%). Another critical parameter for determining the percentage of diffusion-based EET is the mediator concentration. Currently the intrabiofilm mediator concentration is unknown in continuous flow systems. In a recent study by our group we measured only up to 0.7 μM flavin in an S. oneidensis biofilm using a flavin microelectrode, and this was localized to the ~50 μm at the base of the 300-μm-thick biofilm, where it was confirmed that no O2 was present.53 Elsewhere in that biofilm, flavin concentrations were below detection. Our model confirms that such low concentrations of mediators cannot account for the high currents measured in many systems. Thus, we believe that the best measure of the dominating EET mechanism in electrochemically active biofilms is the steady state current production. If the current rises higher than 1 A/m2 then conduction-based EET is likely to be the dominant mechanism, contingent on confirmation that any possible mediator concentration is low. For this reason, we also see that any parameter that increases the electron-producing activity per volume of the biofilm (such as qmax, X, f, or y) will decrease the percentage contribution of diffusion-based EET. The mediator concentration is too low to handle any further increase in electron production by the biofilm. As shown in Table 2, most of the mediators are already in the reduced form and unable to accept more electrons even in the standard case, which has low activity.
The full parameter analysis (available in the Supplementary Information Section IV Parameter Analysis section), gives a better look at how each parameter controls current and percentage of EET. We tested a large range for each parameter to allow for all possible realistic values and to highlight the regions where the parameter values have a large impact on the final solution. As in the sensitivity analysis, it is quickly apparent from the parameter analysis that the percentage of diffusion-based EET is maximized when the biofilm activity and amount of biomass are low. This may be one reason diffusion-based EET is observed in S. oneidensis, but not in G. sulfurreducens, which is denser and has a higher activity. It is interesting to see that even if the diffusion coefficient of the mediator is increased by a factor of over 10, the current stays relatively low. Only by changing the conductivity or the half-maximum rate potential value is it possible to achieve 100% diffusion-based EET. Therefore, the three most revealing measurements for determining the contributions of the different EET mechanisms in electrochemically active biofilms are the steady state current, biofilm conductivity, and mediator concentration.
What is the difference between the local biofilm potential and redox potential?
Recently we introduced the concept of the local biofilm potential and compared it to redox potential.44 In that study we showed that there was a difference between the potential measured with a redox microelectrode and that measured with an electrode that was electronically connected to the biofilm matrix. Briefly, redox potential is determined by the soluble redox species with which an electrode (i.e., a platinized platinum microelectrode) is able to equilibrate. In most systems, this results in a mixed potential, which is dependent on multiple redox couples. Note that not all redox couples are capable of interacting (that is, exchanging electrons) with an electrode.89 The redox potential is governed by the Nernst equation [eqn (22)] and is intimately associated with diffusion-based EET. The local biofilm potential is only measurable after an electrode is electronically connected with the biofilm matrix.44 It is currently unknown exactly what this potential comprises. Here, we simulate it as the potential drop associated with resistance through the biofilm matrix, governed by Ohm’s laws [eqn (21)]; it is therefore intimately associated with conduction-based EET. Even though the model in this study does not yet fully represent all of the complexities of an actual system, it is capable of demonstrating that the local biofilm potential and redox potential represent two distinct and critically important functions in electrochemically active biofilms. Figure 11 shows the profiles of local biofilm potential and redox potential for the standard case and for the low-conductivity case. For the standard case, the conductivity is high enough to prevent any significant potential drop for the local biofilm potential. The redox potential declines rapidly from the electrode potential to between −200 and −350 mVSHE through the biofilm.
Figure 11.
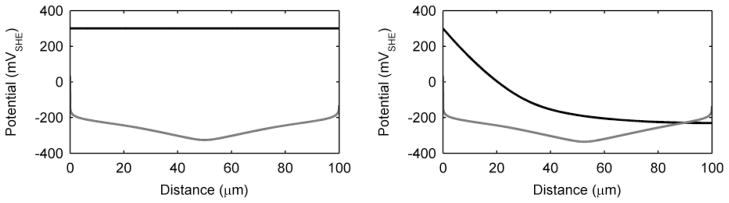
Local biofilm potential (black) and redox potential (grey) for the standard case (left) and the low-conductivity case (right).
The slopes of the local biofilm potential and the redox potential are indicative of the net flux of electrons in the system for conduction-based and diffusion-based EET, respectively. When the slope is negative, there is a local net flux of electrons toward the electrode; alternatively, when the slope is positive, there is a local net flux of electrons toward the bulk. For the standard case, the slope of the local biofilm potential is negative (electrons flow toward the polarized electrode), even though this is not visible at the scale shown. The negative slope of the local biofilm potential becomes clear in the low-conductivity case. In this figure, we see a local biofilm potential very similar to those predicted originally by Marcus et al.26 The cause of the variable biofilm activity in Figure 5 is now apparent, as the local biofilm potential drops to values slightly more negative than the half-maximum rate potential value, thus prohibiting significant electron conduction from regions distal to the electrode. The positive slope of the redox potential at regions further than 50 μm from the electrode visually shows the loss of mediators (and thus electrons) into the bulk solution. A reduced flavin molecule at a distance greater than 50 μm from the bottom of the biofilm has a higher probability of being lost to the bulk than it has of interacting with the electrode. The redox potential profile in Figure 11, with a negative slope near the electrode and a positive slope near the top of the biofilm, was also predicted by Picioreanu et al. (2010).33 This type of profile is indicative of redox-active molecules acting as mediators for electron transfer. However, experimentally measured redox profiles in S. oneidensis biofilms do not have this profile.45 Our group observed a redox profile in an S. oneidensis biofilm that was continually positive (increasing potential toward the top of the biofilm) regardless of the polarization potential of the electrode substratum. In view of our modeling results, this experimental profile suggests that the biofilm was not respiring using diffusion-based EET to the electrode.
In summary, our simulation results show that a large decrease in local biofilm potential is indicative of low biofilm conductivity. Local biofilm potential and redox potential are two distinct measurements, and it cannot be assumed that they will have the same value.
What benefit may a biofilm gain by allowing mediators to interact with the conductive biofilm matrix?
Currently it is not known whether any biofilm uses both EET mechanisms simultaneously. Our simulations have theoretically confirmed that there may be a metabolic advantage for biofilms that utilize both mechanisms. We hypothesize that if the two EET mechanisms interact (interacting-dual EET) this may provide a further metabolic advantage. To test this, the term specific electrochemically active surface area (Sa) was introduced. This is the surface area within the biofilm matrix on which mediators may be reduced or oxidized through the depth of the biofilm. Figure 12 shows a parameter analysis plot for Sa and biofilm activity by depth when Sa is set to 4300 m−1. The parameter analysis plot shows that high Sa values allow for higher steady state current and that the electrons delivered via diffusion-based EET approach 0% as Sa increases. This is due to the definition of the percentage of EET, in which the final mode in which an electron arrives at the electrode is attributed to that EET mechanism, even if it originated from a different mechanism. These results show that as Sa increases, electrons produced via metabolism ultimately enter the conductive biofilm matrix. The cause for the increase in current is demonstrated in the rightmost figures in Figure 12. Throughout the biofilm thickness, the number of electrons derived from the diffusion-based EET mechanism (grey) remains constant. This is in contrast to the results in Figure 5, which show that, without interaction, diffusion-based EET drops to zero in the center of the biofilm. Adding the possibility of interaction enables two things: 1) qm stays maximized because of the continuous oxidation of local mediators by the conductive biofilm matrix, and 2) fewer electrons are lost to the bulk because mediators are rapidly reduced locally without having to diffuse long distances (i.e., to the electrode). Thus, having interaction between diffusion- and conduction-based EET (interacting-dual EET) allows for a further metabolic advantage over having two independent mechanisms.
Figure 12.
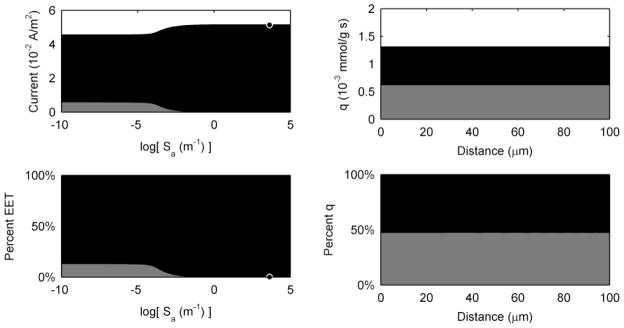
Left) Effect of parameter Sa on steady state current and percentage EET. The black-filled circles illustrate the Sa value (4300 m−1) used for all subsequent interaction figures. Right) Biofilm activity by depth as measured by substrate utilization rate, q, and percentage of q obtained from diffusion-based or conduction-based EET. Grey represents the portion due to diffusion-based EET, and black represents the portion due to conduction-based EET.
Figure 13 demonstrates the effect of Sa on the local biofilm potential and redox potential profiles. Unlike the case in which interactions are not allowed (see rightmost plot in Figure 11), the redox potential profile is dependent on the local biofilm potential if interactions between the two mechanisms are allowed. This can be observed in the exaggerated case in which Sa is increased 100-fold. The local biofilm potential and redox potential are nearly identical from the middle of the biofilm to the top. This is because the local biofilm potential controls the rate of the mediator reaction at the biofilm matrix surfaces. The mediator concentration defines the redox potential.
Figure 13.
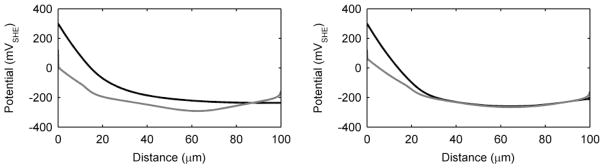
Local biofilm potential (black) and redox potential (grey) for Left) the low-conductivity case with interactions allowed and Right) the low-conductivity case with the electrochemically active surface area increased 100 times.
In summary, our simulation results show that interaction between mediators and the conductive biofilm matrix could support higher biofilm metabolic activity. Interaction between mediators and the conductive biofilm matrix may be advantageous for the biofilm because it reduces the requirement for high mediator concentrations, limits mediator losses, and allows for higher biofilm densities. Closely related local biofilm potential and redox potential profiles could be indicative of a strong interaction between mediators and the conductive biofilm matrix.
Conclusions
We have developed a mathematical model simulating four different extracellular electron transfer cases for electrochemically active biofilms: 1) diffusion-based EET; 2) conduction-based EET; 3) isolated-dual EET; and 4) interacting-dual EET. The model was tested using commonly observed experimental conditions. We concluded that
The availability of diffusion-based EET does not contribute to increased biofilm metabolism unless conduction-based EET is restricted or unavailable;
Under natural conditions, having both mechanisms available may provide a metabolic advantage for S. oneidensis;
When conductivity is high, the upper biofilm layer near the aqueous phase boundary of a conductive biofilm can be active, even when the base is limited by a low electron donor concentration.
Based on our model, simulated CV and SQW are unable to determine the specific percentages of the EET mechanism with the current version of the model;
The most critical parameters for the total current from an S. oneidensis biofilm are biofilm thickness, fraction of electrons recoverable for current, biofilm density, maximum specific lactate utilization rate, and electron equivalence of lactate;
The most critical parameters for determining the EET mechanism are mediator concentration and current production;
Interaction between mediators and the conductive biofilm matrix can support higher biofilm metabolic activity;
Interaction between mediators and the conductive biofilm matrix may be advantageous for the biofilm because it reduces the requirement for high mediator concentrations, limits mediator losses, and allows for higher biofilm densities.
Supplementary Material
Acknowledgments
This research was supported by the U.S. Office of Naval Research (ONR), grant #N00014-09-1-0090, NSF-CAREER award #0954186 and by the U.S. Department of Energy (DOE), Office of Biological and Environmental Research (BER), as part of BER’s Subsurface Biogeochemistry Research Program (SBR). This contribution originates, in part, from the SBR Scientific Focus Area (SFA) at the Pacific Northwest National Laboratory (PNNL). Ryan Renslow and Jerome Babauta acknowledge the NIH Protein Biotechnology Training Grant (T32-GM008336).
Nomenclature
- α
Transfer coefficient for the mediator redox reaction at the electrode surface (unitless)
- αb
Transfer coefficient for the mediator redox reaction at the conductive biofilm matrix (unitless)
- Cello
Illustrative of a cell capable of oxidizing substrate
- Cellr
Illustrative of a cell that has stored electrons from oxidizing substrate
- c
Fraction of current due to conduction-based EET (unitless)
- d
Fraction of current due to diffusion-based EET (unitless)
- Daq
Bulk liquid self-diffusion coefficients of water (m2 s−1)
- De
Effective self-diffusion coefficient of water (m2 s−1)
- Dei
Effective Fickian diffusion coefficient of solute i (m2 s−1)
- DeM
Effective diffusion coefficient of mediator (m2 s−1)
- DeS
Effective diffusion coefficient of substrate (m2 s−1)
- Di
Bulk liquid Fickian diffusion coefficient of solute i (m2 s−1)
- Dr
Relative effective diffusion coefficient (unitless)
- E
Local biofilm potential (VSHE)
- E0′
Standard redox potential for the mediator redox reaction at the biochemical standard state (VSHE)
- EKA
Half-maximum rate potential (VSHE)
- Eredox
Redox potential (VSHE)
- ε
Polarized electrode potential (VSHE)
- F
Faraday constant (s A mol−1)
- f
Fraction of electrons recoverable for current (unitless)
- j
Total current produced by the biofilm (A m−2)
- jC
Current produced by conduction-based EET (A m−2)
- jM
Current produced by diffusion-based EET (A m−2);
- k0
Standard heterogeneous rate constant for the mediator redox reaction at the electrode surface (m s−1)
Standard heterogeneous rate constant for the mediator redox reaction at the conductive biofilm matrix (m s−1)
- KM
Half-saturation constant for the mediator (mM)
- KS
Half-saturation constant for the substrate (mM)
- κ
Biofilm conductivity (S m−1)
- L
Biofilm thickness (m)
- Mo
Oxidized mediator concentration (mM)
- Mr
Reduced mediator concentration (mM)
- Matrixo
Illustrative of a matrix capable of oxidizing substrate
- Matrixr
Illustrative of a matrix capable of reducing substrate
- m
Protons transferred per mediator redox reaction (unitless)
- n
Electrons transferred per mediator redox reaction (unitless)
- P
Product concentration (mM)
- q
Total specific substrate utilization rate (mol g−1 s−1)
- qC
Specific substrate utilization rate via conduction-based EET (mol g−1 s−1)
Modified specific substrate utilization rate via conduction-based EET (mol g−1 s−1)
- qM
Specific substrate utilization rate via diffusion-based EET (mol g−1 s−1)
Modified specific substrate utilization rate via diffusion-based EET (mol g−1 s−1)
- qmax
Maximum specific substrate utilization rate (mol g−1 s−1)
- R
Molar gas constant (J K−1 mol−1)
- RC
Generation rate of e− in the biofilm due to metabolism (mol m−3 s−1)
- rM
Net generation rate of e− at the electrode surface (mol m−2 s−1)
- RM
Reduction rate of Mo in the biofilm due to metabolism (mol m−3 s−1)
- Ro
Oxidation rate of Mr in the biofilm due to interaction with the conductive matrix (mol m−3 s−1)
- ro
Oxidation rate of Mr at the electrode surface (mol m−2 s−1)
- Rr
Reduction rate of Mr in the biofilm due to interaction with the conductive matrix (mol m−3 s−1)
- rr
Reduction rate of Mo at the electrode surface (mol m−2 s−1)
- RS
Overall substrate consumption rate due to metabolism (mol m−3 s−1)
- RSa
Generation rate of e− in the biofilm due to mediator interaction with the conductive matrix (mol m−3 s−1)
- S
Substrate concentration (mM)
- Sa
Specific electrochemically active surface area (m−1)
- T
Temperature (K)
- t
Time (s)
- X
Biofilm density (g m−3)
- y
Electron equivalence of lactate (unitless)
- x
Distance from electrode surface (m)
- δj,p
Elasticity for parameter p and model output j (unitless)
- δd,p
Elasticity for parameter p and model output d (unitless)
Works Cited
- 1.Borole AP, Reguera G, Ringeisen B, Wang ZW, Feng YJ, Kim BH. Energy Environ Sci. 2011;4:4813–4834. [Google Scholar]
- 2.Logan BE. Nat Rev Microbiol. 2009;7:375–381. doi: 10.1038/nrmicro2113. [DOI] [PubMed] [Google Scholar]
- 3.Lovley DR. Nat Rev Microbiol. 2006;4:497–508. doi: 10.1038/nrmicro1442. [DOI] [PubMed] [Google Scholar]
- 4.Lovley DR. Curr Opin Biotechnol. 2008;19:564–571. doi: 10.1016/j.copbio.2008.10.005. [DOI] [PubMed] [Google Scholar]
- 5.Donovan C, Dewan A, Heo D, Beyenal H. Environ Sci Technol. 2008;42:8591–8596. doi: 10.1021/es801763g. [DOI] [PubMed] [Google Scholar]
- 6.Zhang F, Tian L, He Z. J Power Sources. 2011;196:9568–9573. [Google Scholar]
- 7.Geelhoed JS, Stams AJM. Environ Sci Technol. 2011;45:815–820. doi: 10.1021/es102842p. [DOI] [PubMed] [Google Scholar]
- 8.Liu H, Grot S, Logan BE. Environ Sci Technol. 2005;39:4317–4320. doi: 10.1021/es050244p. [DOI] [PubMed] [Google Scholar]
- 9.Du Z, Li H, Gu T. Biotechnology Advances. 2007;25:464–482. doi: 10.1016/j.biotechadv.2007.05.004. [DOI] [PubMed] [Google Scholar]
- 10.Liu H, Ramnarayanan R, Logan BE. Environ Sci Technol. 2004;38:2281–2285. doi: 10.1021/es034923g. [DOI] [PubMed] [Google Scholar]
- 11.Finneran KT, Anderson RT, Nevin KP, Lovley DR. Soil & Sediment Contamination. 2002;11:339–357. [Google Scholar]
- 12.Lovley DR. Journal of Industrial Microbiology & Biotechnology. 1997;18:75–81. [Google Scholar]
- 13.Lovley DR, Baedecker MJ, Lonergan DJ, Cozzarelli IM, Phillips EJP, Siegel DI. Nature. 1989;339:297–300. [Google Scholar]
- 14.Beech WB, Sunner J. Curr Opin Biotechnol. 2004;15:181–186. doi: 10.1016/j.copbio.2004.05.001. [DOI] [PubMed] [Google Scholar]
- 15.Kan J, Chellamuthu P, Obraztsova A, Moore JE, Nealson KH. Journal of Applied Microbiology. 2011;111:329–337. doi: 10.1111/j.1365-2672.2011.05055.x. [DOI] [PubMed] [Google Scholar]
- 16.Gralnick JA, Newman DK. Molecular Microbiology. 2007;65:1–11. doi: 10.1111/j.1365-2958.2007.05778.x. [DOI] [PMC free article] [PubMed] [Google Scholar]
- 17.Shi L, Squier TC, Zachara JM, Fredrickson JK. Molecular Microbiology. 2007;65:12–20. doi: 10.1111/j.1365-2958.2007.05783.x. [DOI] [PMC free article] [PubMed] [Google Scholar]
- 18.Torres CI, Marcus AK, Lee HS, Parameswaran P, Krajmalnik-Brown R, Rittmann BE. Fems Microbiol Rev. 2010;34:3–17. doi: 10.1111/j.1574-6976.2009.00191.x. [DOI] [PubMed] [Google Scholar]
- 19.Brutinel ED, Gralnick JA. Applied Microbiology and Biotechnology. 2012;93:41–48. doi: 10.1007/s00253-011-3653-0. [DOI] [PubMed] [Google Scholar]
- 20.Kotloski NJ, Gralnick JA. mBio. 2013:4. doi: 10.1128/mBio.00553-12. [DOI] [PMC free article] [PubMed] [Google Scholar]
- 21.Marsili E, Baron DB, Shikhare ID, Coursolle D, Gralnick JA, Bond DR. Proceedings of the National Academy of Sciences of the United States of America. 2008;105:3968–3973. doi: 10.1073/pnas.0710525105. [DOI] [PMC free article] [PubMed] [Google Scholar]
- 22.Gorby YA, Yanina S, McLean JS, Rosso KM, Moyles D, Dohnalkova A, Beveridge TJ, Chang IS, Kim BH, Kim KS, Culley DE, Reed SB, Romine MF, Saffarini DA, Hill EA, Shi L, Elias DA, Kennedy DW, Pinchuk G, Watanabe K, Ishii S, Logan B, Nealson KH, Fredrickson JK. Proceedings of the National Academy of Sciences of the United States of America. 2006;103:11358–11363. doi: 10.1073/pnas.0604517103. [DOI] [PMC free article] [PubMed] [Google Scholar]
- 23.Strycharz SM, Malanoski AP, Snider RM, Yi H, Lovley DR, Tender LM. Energy & Environmental Science. 2011;4:896–913. [Google Scholar]
- 24.Strycharz-Glaven SM, Snider RM, Guiseppi-Elie A, Tender LM. Energy Environ Sci. 2011;4:4366–4379. [Google Scholar]
- 25.von Canstein H, Ogawa J, Shimizu S, Lloyd JR. Appl Environ Microbiol. 2008;74:615–623. doi: 10.1128/AEM.01387-07. [DOI] [PMC free article] [PubMed] [Google Scholar]
- 26.Marcus AK, Torres CI, Rittmann BE. Biotechnol Bioeng. 2007;98:1171–1182. doi: 10.1002/bit.21533. [DOI] [PubMed] [Google Scholar]
- 27.Pinto RP, Srinivasan B, Manuel MF, Tartakovsky B. Bioresour Technol. 2010;101:5256–5265. doi: 10.1016/j.biortech.2010.01.122. [DOI] [PubMed] [Google Scholar]
- 28.Zeng YZ, Choo YF, Kim BH, Wu P. J Power Sources. 2010;195:79–89. [Google Scholar]
- 29.Picioreanu C, Head IM, Katuri KP, van Loosdrecht MCM, Scott K. Water Res. 2007;41:2921–2940. doi: 10.1016/j.watres.2007.04.009. [DOI] [PubMed] [Google Scholar]
- 30.Bond DR, Lovley DR. Appl Environ Microbiol. 2003;69:1548–1555. doi: 10.1128/AEM.69.3.1548-1555.2003. [DOI] [PMC free article] [PubMed] [Google Scholar]
- 31.Batstone DJ, Keller J, Angelidaki I, Kalyuzhnyi SV, Pavlostathis SG, Rozzi A, Sanders WTM, Siegrist H, Vavilin VA. Water Science and Technology. 2002;45:65–73. [PubMed] [Google Scholar]
- 32.Picioreanu C, Katuri KP, Head IM, van Loosdrecht MCM, Scott K. Water Science and Technology. 2008;57:965–971. doi: 10.2166/wst.2008.095. [DOI] [PubMed] [Google Scholar]
- 33.Picioreanu C, van Loosdrecht MCM, Curtis TP, Scott K. Bioelectrochemistry. 2010;78:8–24. doi: 10.1016/j.bioelechem.2009.04.009. [DOI] [PubMed] [Google Scholar]
- 34.Nevin KP, Richter H, Covalla SF, Johnson JP, Woodard TL, Orloff AL, Jia H, Zhang M, Lovley DR. Environmental Microbiology. 2008;10:2505–2514. doi: 10.1111/j.1462-2920.2008.01675.x. [DOI] [PubMed] [Google Scholar]
- 35.Kissel J, McCarty P, Street R. Journal of Environmental Engineering. 1984;110:393–411. [Google Scholar]
- 36.Bae W, Rittmann BE. Biotechnol Bioeng. 1996;49:683–689. doi: 10.1002/(SICI)1097-0290(19960320)49:6<683::AID-BIT10>3.0.CO;2-7. [DOI] [PubMed] [Google Scholar]
- 37.Rittmann BE, Dovantzis K. Water Res. 1983;17:1727–1734. [Google Scholar]
- 38.Kim JR, Premier GC, Hawkes FR, Rodriguez J, Dinsdale RM, Guwy AJ. Bioresour Technol. 2010;101:1190–1198. doi: 10.1016/j.biortech.2009.09.023. [DOI] [PubMed] [Google Scholar]
- 39.Lanthier M, Gregory KB, Lovley DR. FEMS Microbiol Lett. 2008;278:29–35. doi: 10.1111/j.1574-6968.2007.00964.x. [DOI] [PMC free article] [PubMed] [Google Scholar]
- 40.Velasquez-Orta SB, Head IM, Curtis TP, Scott K, Lloyd JR, von Canstein H. Applied Microbiology and Biotechnology. 2010;85:1373–1381. doi: 10.1007/s00253-009-2172-8. [DOI] [PubMed] [Google Scholar]
- 41.Malvankar NS, Tuominen MT, Lovley DR. Energy Environ Sci. 2012;5:6247–6249. [Google Scholar]
- 42.Strycharz-Glaven SM, Tender LM. Energy Environ Sci. 2012;5:6250–6255. [Google Scholar]
- 43.IUPAC. Compendium of Chemical Terminology (the “Gold Book”) 2. Blackwell Scientific Publications; Oxford: 1997. [Google Scholar]
- 44.Babauta JT, Nguyen HD, Harrington TD, Renslow R, Beyenal H. Biotechnol Bioeng. 2012;109:2651–2662. doi: 10.1002/bit.24538. [DOI] [PMC free article] [PubMed] [Google Scholar]
- 45.Babauta JT, Hung Duc N, Beyenal H. Environ Sci Technol. 2011;45:6654–6660. doi: 10.1021/es200865u. [DOI] [PMC free article] [PubMed] [Google Scholar]
- 46.Bouhenni RA, Vora GJ, Biffinger JC, Shirodkar S, Brockman K, Ray R, Wu P, Johnson BJ, Biddle EM, Marshall MJ, Fitzgerald LA, Little BJ, Fredrickson JK, Beliaev AS, Ringeisen BR, Saffarini DA. Electroanalysis. 2010;22:856–864. [Google Scholar]
- 47.Johs A, Shi L, Droubay T, Ankner JF, Liang L. Biophysical Journal. 2010;98:3035–3043. doi: 10.1016/j.bpj.2010.03.049. [DOI] [PMC free article] [PubMed] [Google Scholar]
- 48.Lower BH, Yongsunthon R, Shi L, Wildling L, Gruber HJ, Wigginton NS, Reardon CL, Pinchuk GE, Droubay TC, Boily JF, Lower SK. Appl Environ Microbiol. 2009;75:2931–2935. doi: 10.1128/AEM.02108-08. [DOI] [PMC free article] [PubMed] [Google Scholar]
- 49.Ross DE, Brantley SL, Tien M. Appl Environ Microbiol. 2009;75:5218–5226. doi: 10.1128/AEM.00544-09. [DOI] [PMC free article] [PubMed] [Google Scholar]
- 50.Leang C, Qian X, Mester T, Lovley DR. Appl Environ Microbiol. 2010;76:4080–4084. doi: 10.1128/AEM.00023-10. [DOI] [PMC free article] [PubMed] [Google Scholar]
- 51.Myers CR, Myers JM. Lett Appl Microbiol. 2003;37:254–258. doi: 10.1046/j.1472-765x.2003.01389.x. [DOI] [PubMed] [Google Scholar]
- 52.Shi LA, Richardson DJ, Wang ZM, Kerisit SN, Rosso KM, Zachara JM, Fredrickson JK. Environ Microbiol Rep. 2009;1:220–227. doi: 10.1111/j.1758-2229.2009.00035.x. [DOI] [PubMed] [Google Scholar]
- 53.Nguyen HD, Renslow R, Babauta J, Ahmed B, Beyenal H. Sensors and Actuators B-Chemical. 2012;161:929–937. doi: 10.1016/j.snb.2011.11.066. [DOI] [PMC free article] [PubMed] [Google Scholar]
- 54.Torres CI, Marcus AK, Parameswaran P, Rittmann BE. Environ Sci Technol. 2008;42:6593–6597. doi: 10.1021/es800970w. [DOI] [PubMed] [Google Scholar]
- 55.Mohr PJ, Taylor BN, Newell DB. Rev Mod Phys. 2008;80:633–730. doi: 10.1103/RevModPhys.93.025010. [DOI] [PMC free article] [PubMed] [Google Scholar]
- 56.Baron D, LaBelle E, Coursolle D, Gralnick JA, Bond DR. J Biol Chem. 2009;284:28865–28873. doi: 10.1074/jbc.M109.043455. [DOI] [PMC free article] [PubMed] [Google Scholar]
- 57.Renslow RS, Majors PD, McLean JS, Fredrickson JK, Ahmed B, Beyenal H. Biotechnol Bioeng. 2010;106:928–937. doi: 10.1002/bit.22755. [DOI] [PMC free article] [PubMed] [Google Scholar]
- 58.Bretschger O, Cheung ACM, Mansfeld F, Nealson KH. Electroanalysis. 2010;22:883–894. [Google Scholar]
- 59.Newton GJ, Mori S, Nakamura R, Hashimoto K, Watanabe K. Appl Environ Microbiol. 2009;75:7674–7681. doi: 10.1128/AEM.01142-09. [DOI] [PMC free article] [PubMed] [Google Scholar]
- 60.Tang YJ, Meadows AL, Keasling JD. Biotechnol Bioeng. 2007;96:125–133. doi: 10.1002/bit.21101. [DOI] [PubMed] [Google Scholar]
- 61.Fan LS, Leyvaramos R, Wisecarver KD, Zehner BJ. Biotechnol Bioeng. 1990;35:279–286. doi: 10.1002/bit.260350309. [DOI] [PubMed] [Google Scholar]
- 62.Nelson DL, Lehninger AL, Cox MM. Lehninger Principles of Biochemistry. W. H. Freeman; New York: 2008. [Google Scholar]
- 63.Bas GL. The Molecular Volumes of Liquid Chemical Compounds from the point of view of Kopp. Longmans, Green & Co; London: 1915. [Google Scholar]
- 64.EPA. [Accessed December 16, 2010.];EPA On-line Tools for Site Assessment Calculation: Estimated Diffusion Coefficients - Extended Chemical Range. http://www.epa.gov/athens/learn2model/part-two/onsite/estdiffusion-ext.html.
- 65.Hayduk W, Laudie H. AIChE Journal. 1974;20:611–615. [Google Scholar]
- 66.Tucker WA, Nelken LH. In: Handbook of chemical property estimation methods: environmental behavior of organic compounds. Lyman WJ, Rosenblatt DH, Reehl WF, editors. American Chemical Society; Washington, DC: 1982. [Google Scholar]
- 67.Rosenbaum M, Cotta MA, Angenent LT. Biotechnol Bioeng. 2010;105:880–888. doi: 10.1002/bit.22621. [DOI] [PubMed] [Google Scholar]
- 68.Lovley DR, Phillips EJP, Caccavo F. Appl Environ Microbiol. 1992;58:3205–3206. doi: 10.1128/aem.58.9.3205-3208.1992. [DOI] [PMC free article] [PubMed] [Google Scholar]
- 69.Ksenzhek OS, Petrova SA. Bioelectrochemistry and Bioenergetics. 1983;11:105–127. [Google Scholar]
- 70.Verhagen MF, Hagen WR. Journal of Electroanalytical Chemistry. 1992;334:339–350. [Google Scholar]
- 71.Bard AJ, Faulkner LR. Electrochemical Methods: Fundamentals and Applications. Wiley; New York: 2001. [Google Scholar]
- 72.Carmona-Martinez AA, Harnisch F, Kuhlicke U, Neu TR, Schroder U. Bioelectrochemistry (Amsterdam, Netherlands) 2012 doi: 10.1016/j.bioelechem.2012.05.002. [DOI] [PubMed] [Google Scholar]
- 73.Marcus AK, Torres CI, Rittmann BE. Electrochimica Acta. 2010;55:6964–6972. [Google Scholar]
- 74.Renslow RS, Babauta JT, Majors PD, Beyenal H. Energy Environ Sci. 2013;6:595–607. doi: 10.1039/C2EE23394K. [DOI] [PMC free article] [PubMed] [Google Scholar]
- 75.Rittmann B, McCarty P. Microbial Kinetics. Chapter 3. McGraw-Hill; New York, NY, USA: 2000. p. 768. [Google Scholar]
- 76.Whitman WB, Coleman DC, Wiebe WJ. Proceedings of the National Academy of Sciences of the United States of America. 1998;95:6578–6583. doi: 10.1073/pnas.95.12.6578. [DOI] [PMC free article] [PubMed] [Google Scholar]
- 77.Zeng H, Zhang TC. Water Res. 2005;39:4941–4952. doi: 10.1016/j.watres.2005.09.034. [DOI] [PubMed] [Google Scholar]
- 78.Hagen WR. European Journal of Biochemistry. 1989;182:523–530. doi: 10.1111/j.1432-1033.1989.tb14859.x. [DOI] [PubMed] [Google Scholar]
- 79.Covington ED, Gelbmann CB, Kotloski NJ, Gralnick JA. Molecular Microbiology. 2010;78:519–532. doi: 10.1111/j.1365-2958.2010.07353.x. [DOI] [PubMed] [Google Scholar]
- 80.El-Naggar MY, Wanger G, Leung KM, Yuzvinsky TD, Southam G, Yang J, Lau WM, Nealson KH, Gorby YA. Proceedings of the National Academy of Sciences of the United States of America. 2010;107:18127–18131. doi: 10.1073/pnas.1004880107. [DOI] [PMC free article] [PubMed] [Google Scholar]
- 81.Manohar AK, Bretschger O, Nealson KH, Mansfeld F. Bioelectrochemistry. 2008;72:149–154. doi: 10.1016/j.bioelechem.2008.01.004. [DOI] [PubMed] [Google Scholar]
- 82.Lower BH, Yongsunthon R, Shi L, Wildling L, Gruber HJ, Wigginton NS, Reardon CL, Pinchuk GE, Droubay TC, Boily JF, Lower SK. Appl Environ Microbiol. 2009;75:2931–2935. doi: 10.1128/AEM.02108-08. [DOI] [PMC free article] [PubMed] [Google Scholar]
- 83.Lower BH, Shi L, Yongsunthon R, Droubay TC, McCready DE, Lower SK. Journal of Bacteriology. 2007;189:4944–4952. doi: 10.1128/JB.01518-06. [DOI] [PMC free article] [PubMed] [Google Scholar]
- 84.Abboud R, Popa R, Souza-Egipsy V, Giometti CS, Tollaksen S, Mosher JJ, Findlay RH, Nealson KH. Appl Environ Microbiol. 2005;71:811–816. doi: 10.1128/AEM.71.2.811-816.2005. [DOI] [PMC free article] [PubMed] [Google Scholar]
- 85.Wigginton NS, Rosso KM, Lower BH, Shi L, Hochella MF., Jr Geochimica Et Cosmochimica Acta. 2007;71:543–555. [Google Scholar]
- 86.Neidhardt FC, Ingraham JL, Schaechter M. Physiology of the bacterial cell: a molecular approach. Sinauer Associates; Sunderland: 1990. [Google Scholar]
- 87.Cao B, Shi L, Brown RN, Xiong Y, Fredrickson JK, Romine MF, Marshall MJ, Lipton MS, Beyenal H. Environmental Microbiology. 2011;13:1018–1031. doi: 10.1111/j.1462-2920.2010.02407.x. [DOI] [PubMed] [Google Scholar]
- 88.Ringeisen BR, Henderson E, Wu PK, Pietron J, Ray R, Little B, Biffinger JC, Jones-Meehan JM. Environmental science & technology. 2006;40:2629–2634. doi: 10.1021/es052254w. [DOI] [PubMed] [Google Scholar]
- 89.Delaune R, Reddy K. In: Encyclopedia of Soils in the Environment. Hillel D, editor. Academic Press; 2005. pp. 366–371. [Google Scholar]
- 90.Renslow R, Babauta J, Dohnalkova A, Boyanov M, Kemner K, Majors P, Fredrickson J, Beyenal H. Energy & Environmental Science. 2013 doi: 10.1039/C3EE40203G. [DOI] [PMC free article] [PubMed] [Google Scholar]
- 91.Jain A, Gazzola G, Panzera A, Zanoni M, Marsili E. Electrochim Acta. 2011;56:10776–10785. [Google Scholar]
- 92.Liu Y, Kim H, Franklin R, Bond DR. Energy Environ Sci. 2010;3:1782–1788. [Google Scholar]
- 93.Marcus AK, Torres CI, Rittmann BE. Bioresource Technology. 2011;102:253–262. doi: 10.1016/j.biortech.2010.03.100. [DOI] [PubMed] [Google Scholar]
- 94.Merkey BV, Chopp DL. Bulletin of Mathematical Biology. 2012;74:834–857. doi: 10.1007/s11538-011-9690-0. [DOI] [PubMed] [Google Scholar]
Associated Data
This section collects any data citations, data availability statements, or supplementary materials included in this article.