Abstract
OmpF, a multiionic porin from Escherichia coli, is a useful protypical model system for addressing general questions about electrostatic interactions in the confinement of an aqueous molecular pore. Here, favorable anion locations in the OmpF pore were mapped by anomalous X-ray scattering of Br− ions from four different crystal structures and compared with Mg2+ sites and Rb+ sites from a previous anomalous diffraction study to provide a complete picture of cation and anion transfer paths along the OmpF channel. By comparing structures with various crystallization conditions, we find that anions bind in discrete clusters along the entire length of the OmpF pore, whereas cations find conserved binding sites with the extracellular, surface-exposed loops. Results from molecular dynamics simulations are consistent with the experimental data and help highlight the critical residues that preferentially contact either cations or anions during permeation. Analysis of these results provides new insights into the molecular mechanisms that determine ion selectivity in OmpF porin.
INTRODUCTION
The outer membrane (OM) of Gram-negative bacteria is a highly specialized structure that lies outside the cytoplasmic membrane and peptidoglycan layer, and forms the interface between the cell and its external environment. Pioneering studies of Nikaido and co-workers demonstrated the existence of hydrophilic pores embedded in the bacterial OM1,2, termed porins, and established the role of porin proteins in OM permeability of small molecules in vivo3 and in vitro by means of reconstituted vesicles4,5. OmpF, the best characterized porin found in E. coli, is a multiionic trimeric channel that facilitates the simultaneous passage of water molecules, positive and negative ions, and hydrophilic solutes with molecular masses up to 600 Da across the OM6,7. Each OmpF monomer is composed of a 16-stranded β-barrel with long loops that extend into the extracellular solution8,9. The topology of each pore, which functions independently of the other two subunits, consists of two large aqueous vestibules (with areas of 15 and 50 nm2 at the extracellular and periplasmic mouths, respectively) and narrows in the middle (with an area of 3 nm2) due to the folding of an extracellular loop (loop 3) into the channel lumen, forming the constriction zone8,9. The presence of acidic residues (D113, E117 and D121) on loop 3, which face a cluster of basic residues (R42, R82 and R132) on the opposing β-barrel wall, creates a unique electrostatic environment in this constricted region. This separation of charged OmpF pore residues extends into the wide extracellular and periplasmic vestibules as well.
A better understanding of the mechanism of ion permeability in a wide aqueous pore such as OmpF can provide important insights into the function of other biological channels. In that sense, OmpF is a useful model system to investigate electrostatic interactions in the confinement of an aqueous molecular pore. For example, mutations within the wide vestibular cavity at the intracellular entrance of K+ channels are known to greatly affect the conductance of these channels10. Although the large OmpF pore size prevents ion specificity, conductance recordings from electrophysiology experiments and computational methods have shown a slight preference for cations at neutral pH11–13. Furthermore, theoretical studies suggest that ions do not randomly diffuse across the OmpF pore. Molecular dynamics (MD), Brownian dynamics (BD) and continuum electrodiffusion models have shown that cation and anion transport is regulated by interactions between permeating ions and OmpF ionizable residues, which extend over 40 Å along the entire length of the channel12,13. Furthermore, these computational studies have identified two separate pathways for the flow of cations and anions across the OmpF channel, suggesting that charge effects in multiionic channels play a nontrivial role12,13.
While the previous results from simulation studies of OmpF are tantalizing, there is a critical need to validate our understanding of the mechanism of specificity from direct experimental evidence. Previous structural studies based on anomalous diffraction have helped identify a set of favorable cation locations in OmpF crystals soaked in RbCl14. Here we report the results from bromide anomalous X-ray scattering data to reveal the favorable locations of Br− ions in the OmpF pore. The results are compared with previous structural studies and analysis of all-atom MD simulations to give new insights into the mechanisms by which a wide multiionic aqueous pore such as OmpF discriminates between ionic species.
RESULTS
Crystallization of OmpF protein
OmpF crystals grown in 0.1 M sodium cacodylate, 0.2 M MgCl2 and 50% PEG 200 were subsequently soaked in solutions with 0.1 M KBr, 0.2 M KBr, 0.3 M KBr or 0.2 M NaBr, in the absence of MgCl2, and their structures were determined (referred hereafter as 0.1MKBr-OmpF, 0.2MKBr-OmpF, 0.3MKBr-OmpF and 0.2MNaBr-OmpF). While 0.1MKBr-OmpF (1.9 Å resolution) and 0.2MKBr-OmpF (2.2 Å resolution) crystallized in the P3 space group and contained two monomers, each from a separate trimer channel, in the asymmetric unit, 0.3MKBr-OmpF (C2 space group, 2.1 Å resolution) and 0.2MNaBr-OmpF (P212121 space group, 2.1 Å resolution) each contained a single trimer channel in the asymmetric unit (Supplemental Table S1). Anomalous maps for several bound ions are included as additional information; see Supplemental Figure S1 for the 0.1MKBr-OmpF structure, Supplemental Figure S2a and S2b for the 0.2MKBr-OmpF structure, Supplemental Figure S3a, S3b, and S3c for the 0.3MKBr-OmpF structure, and Supplemental Figure S4a for the 0.2MNaBr-OmpF structure.
OmpF crystal structures show discrete clusters of anion binding sites
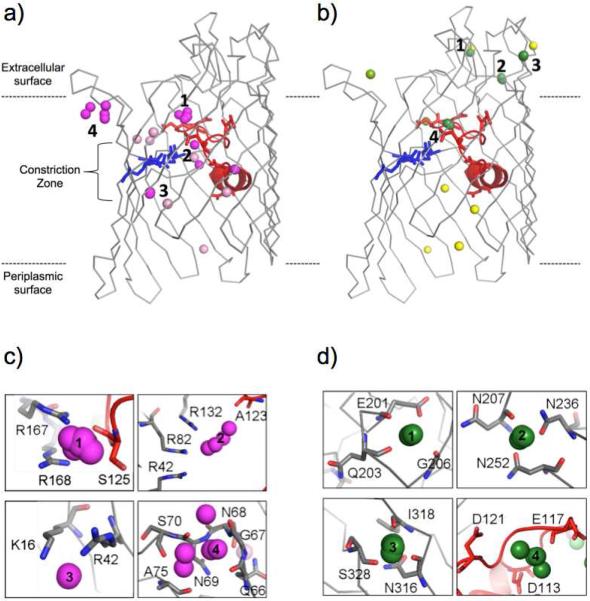
A superposition of all 10 chains from the four structures shows Br− ions clustered in discrete positions within the OmpF pore (Figure 1a). The most pronounced binding site (cluster 1) is represented in all 4 structures and found just above the narrow constriction zone within the nitrogen or oxygen atoms of S125 (Figure 1c and Table 1) in an extracellular pore. Br− ions found at this site form interactions with the side chain atoms of R167 and R168 and the backbone nitrogen or oxygen atoms of S125 (Figure 1c and Table 1). In a second Br− binding site (cluster 2), represented by both chains of the 0.2MKBr-OmpF structure, a Br− ion is located within the constriction zone, closely associated with the cluster of arginine residues (R42, R82 and R132) and the backbone oxygen atom of A123 (Figure 1c and Table 1). Finally, a third Br− ion binding site (cluster 3), found in all chains of the 0.3MKBr-OmpF and 0.2MNaBr-OmpF structures, is located just below the constriction zone in the periplasmic OmpF vestibule. At this position, the Br− interacts with the K16 and R42 side chain atoms (Figure 1c and Table 1). There is an additional cluster of Br− ions (cluster 4) located near extracellular loop 2, or the latching loop, which functions by connecting one monomer to its neighbor by reaching into the pore of the adjacent subunit. This cluster of Br− ions interacts with the backbone nitrogen or oxygen atoms of Q66, G67, N68, N69, S70 and A75 (Figure 1c and Table 1), but is only found in the 0.1MKBr-OmpF and 0.2MKBr-OmpF structures, which do not contain the entire trimeric channel in the asymmetric unit. In addition, there are 8 Br− ions found at unique positions of the pore only present in a single OmpF monomer. These Br− ions are positioned along one face of the β-barrel wall, away from acidic loop 3 (Figures 1a and 2a).
Figure 1.
Cation and anion binding sites in the OmpF pore identified by X-ray crystallography. Side view representations of a single OmpF monomer (shown in gray) with loop 3 along with acidic residues (D107, D113, D121, D126, D127, and E 117 shown as red sticks), and the arginine cluster on the β barrel (R42, R82 and R132 shown as blue sticks) with ion positions (shown as spheres). In (A) are shown the superimposed clusters of Br- ions (magenta) from the 0.1MKBr-OmpF, 0.2MKBr-OmpF, 0.3MKBr-OmpF, and 0.2MNaBr-OmpF X-ray structures, numbered and compared with Br- ions found in unique positions in a single structure (pink). In (B) are shown the clusters of Mg2+ ions (dark green) from the 0.3MKBr-OmpF and 0.2MNaBr-OmpF X-ray structures, numbered and compared with Mg2+ ions found in unique positions in a single structure (light green) and Rb+ ions from PDB ID 3HWB (yellow). Close-up views of (C) Br- and (D) Mg2+ clusters are shown with neighboring OmpF residues (sticks).
Table 1.
Anion interactions with OmpF channel residues.
| OmpF Regions | Cl− Contacts (MD) | Br− Contacts (X-ray) |
|---|---|---|
| Extracellular Loopsa | K25 (L1); E71, G72, A73 (L2); T165 (L4); N198 (L5); S248 (L6); K279, K281 (L7); K323 (L8) |
Q66, G67, N68, N69, S70, A75 (L2) |
| Extracellular Pore | K80, K160, Y124, S125, R167, R168, K209, K210, R235, K253 | T81, R100, A123, S125, G134, R163, R167, R168 |
| Constriction Zone | R42, R82, R132 | M38, Y40, R42, R132 |
| Periplasmic Pore | A1, K16, K46, K89, S142, Y302, Q339 | K16, K89, R140, S142, R270, K305, Q339 |
| Periplasmic Turns | Y4, K6, K10, K305 | N306, S308 |
The extracellular loops (L) that correspond to each residue are indicated.
Figure 2.
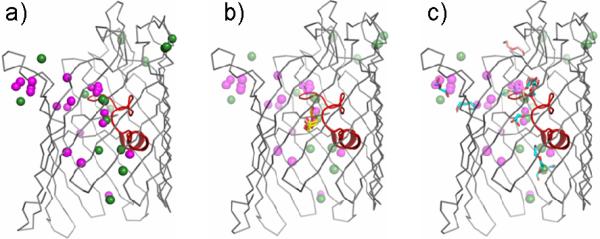
Ion and small molecule permeation by OmpF porin. A side view representation of a single OmpF monomer (gray with loop 3 colored red) shows (a) the superposition of ions from all X-ray structures compared in this study (cations colored green and anions colored magenta) as well as binding sites for (b) glycerol from the 0.1MKBr-OmpF (orange sticks) and 0.3MKBr-OmpF (yellow sticks) structures and (c) PEG molecules from the 0.3MKBr-OmpF (cyan sticks) and 0.2MNaBr-OmpF (salmon sticks) structures, superimposed with the ion sites for comparison.
X-ray structures show a different OmpF binding profile for cations
The 0.3MKBr-OmpF and 0.2MNaBr-OmpF structures include residual Mg2+ ions from the crystallization condition, even after subsequent crystal soaking in Mg2+-free solution. Most of these Mg2+ ions are found in three distinct clusters, where they interact with residues of extracellular loops 5, 6, and 8 (Figure 1b). Specifically, Mg2+ ions, found in all three chains of the 0.3MKBr-OmpF structure (cluster 1), are coordinated by loop 5 residues including the E201 side chain and the backbone oxygen atoms of Q203 and G206 (Figure 1d and Table 2). In a second Mg2+-binding site (cluster 2), Mg2+ ions from both the 0.3MKBr-OmpF and 0.2MNaBr-OmpF structures interact with the backbone oxygen atom of N207 and the side chain carbonyl atom of N236 and N252 from loop 6 (Figure 1d and Table 2). Finally, the 0.3MKBr-OmpF structure reveals a third extracellular Mg2+ binding site (cluster 3) through interactions with the backbone oxygen atoms of N316, I318 and S328 of loop 8 (Figure 1d and Table 2). A fourth cation-binding site is found inside the OmpF pore, near the constriction zone (cluster 4). Specifically, Mg2+ ions from the 0.2MNaBr-OmpF structure interact with the E117 side chain atoms (Figure 1d and Table 2). The Mg2+-binding sites identified in the present work were also compared with previous structural analysis of Rb+ binding in the OmpF channel (PDB ID 3HWB)14. This comparison showed Rb+ ions bind OmpF extracellular loops 5, 6, and 8 in the same regions as the Mg2+ ions in the present work (Figure 1b), and additional Rb+ ions were positioned within the periplasmic OmpF vestibule, coordinated by tyrosine side chains or backbone oxygen atoms.
Table 2.
Cation interactions with OmpF channel residues
| OmpF Regions | K+ Contacts (MD) | Mg2+/Rb+ Contacts (X-ray)a |
|---|---|---|
| Extracellular Loopsb | S24, E29, N35 (L1); E162, D164, D172 (L4); D195, E201, Q203, P204, G206, N207 (L5); N246 (L6); D282, E284, D288 (L7); N316, D319, D321, S328, D329, D330 (L8) | E201, Q203, G206, N207 (L5); N236, N252 (L6); N316, I318, S328, D330 (L8) |
| Extracellular Pore | – | – |
| Constriction Zone | D113, L115, E117, G119, G120 | Y102, Y106, D113, M114, E117 |
| Periplasmic Pore | Y32, E48, E181, D221 | Q264, G268, T300, Y302 |
| Periplasmic Turns | D54, D92, G146, D149, E183, D266 | – |
Rb+ contacts are from PDB ID 3HWB.
The extracellular loops (L) that correspond to each residue are indicated.
X-ray structures show glycerol and PEG binding in the OmpF pore
In addition to ions (Figure 2a), the present OmpF X-ray structures also reveal binding of small molecules (Supplemental Figure S3d and S4b), present in either the crystallization or cryoprotection solutions. This is not surprising since OmpF has been shown to allow translocation of hydrophilic solutes with molecular masses up to 600 Da. For example, a glycerol molecule, present in the cryoprotection solution, could be modeled in the constriction zone in each chain of the 0.1MKBr-OmpF and 0.3MKBr-OmpF structures at the same position as the Br− cluster 2 binding site (Figure 2b). Furthermore, elongated densities, likely corresponding to polyethylene glycol (PEG) molecules from the crystallization solution, were found at many positions within the OmpF pore where ions were found in subsequent structures (Figure 2c), suggesting that a subset of residues are involved in both translocation of ions and small molecules across the OmpF pore.
Molecular dynamics analysis of ion binding and translocation across the OmpF pore
In order to show that the ion binding sites resolved in the X-ray structures were not influenced by crystal packing, buffer effects, or uptake of small molecules from the crystallization or cryoprotectant solutions, ion transfer paths across OmpF were determined by an all-atom MD simulation of the trimer channel embedded in a 1-palmitoyl-2-oleoyl-snglycero-3-phosphocholine (POPC) bilayer, surrounded by a solution of 1 M KCl. After a 50 ns equilibration period, known OmpF properties were recapitulated, including a slight cation-selectivity (I+/I− of 1.57) and a separation of K+ and Cl− ion permeation pathways across the entire length of the wide aqueous channel (Figures 3 and 4).
Figure 3.
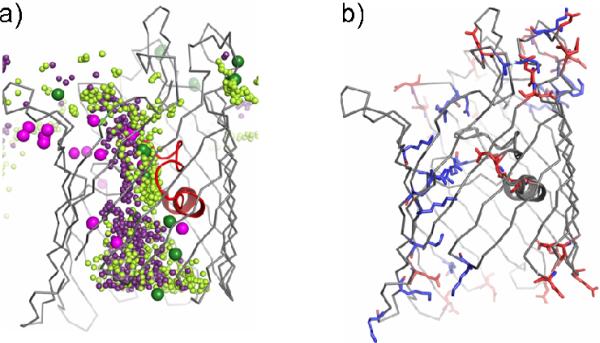
Ion permeation pathway. (a) A superposition of ions from all the X-ray structures compared in this work (large spheres; cations colored dark green and anions colored magenta) and ion positions extracted every 0.5 ns along a 50 ns MD trajectory with 1 M KCl (small spheres; cations colored lime green and anions colored purple) are compared in a side view representation of a single OmpF monomer (gray with loop 3 colored red). (b) OmpF basic residues (blue) contacted by anions and acidic residues (red) contacted by cations along the permeation pathway during the MD trajectory are shown as sticks.
Figure 4.
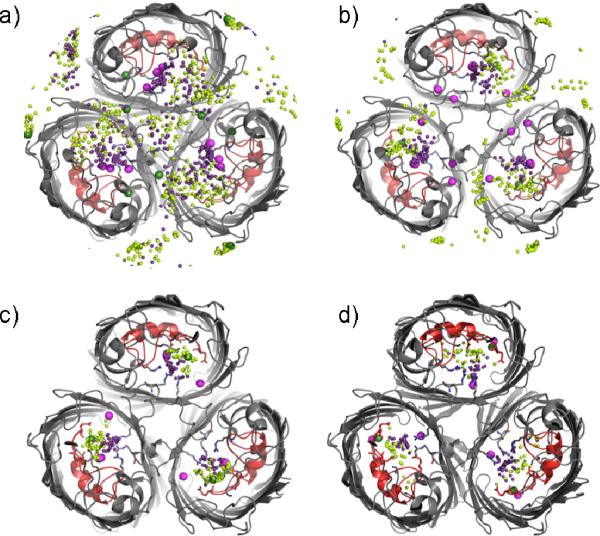
X-ray structures and all-atom MD simulations show similar ion-binding sites. Cross-sectional views of the OmpF trimer (gray with loop 3 colored red) seen from the extracellular side with ions from the X-ray structures (large spheres; cations colored dark green and anions colored magenta) superimposed with ion positions extracted every 0.5 ns along a 50 ns MD trajectory with 1 M KCl (small spheres; cations colored lime green and anions colored purple). The cross-sections are defined along the pore axis with respect to the constriction zone (defined at 0 Å) and each span a 5 Å distance centered at 10 Å (a), 5 Å (b), 0 Å (c) or -10Å (d).
Ion interactions with OmpF residues were comprehensively assessed by calculating the number of contacts every 100 ps along the 50 ns trajectory. OmpF residues that interacted with Cl−, but not K+, ions included many basic pore residues along the entire length of the channel (K80, K160, R167, R168, K209, K210, R235 and K253 in the extracellular vestibule; R42, R82 and R132 in the constriction zone; and K16, K46 and K89 in the periplasmic vestibule), but were mainly restricted to one face of the β-barrel wall interior (Figure 3b, Table 1 and Supplemental Table S2). Analysis of OmpF residues contacted by K+ ions (Table 2 and and Supplemental Table S3) included many acidic and polar residues found on the OmpF extracellular loops 5 to 8 (D195, E201, Q203, N207, N246, D282, E284, D288, N316, D319, D321, S328, D329 and D330) or periplasmic turns (D54, D92, D149, E183 and D266). However, K+ ions contacted very few residues within the pore and the highest contributions were confined to the narrow constriction zone (Figure 3b).
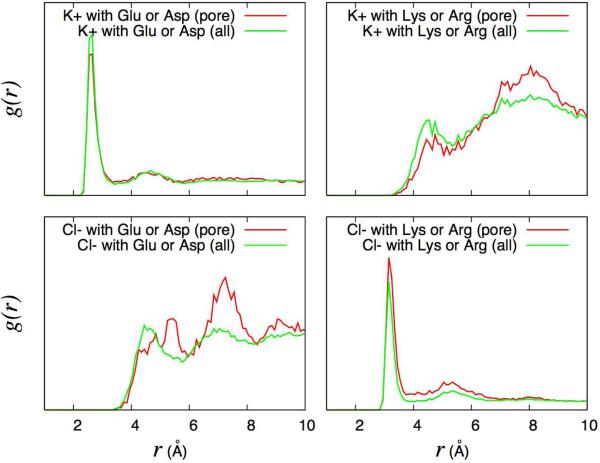
The radial distribution functions, g(r), of the K+ and Cl− ions with the charged OmpF pore residues are shown in Figure 5. The radial distribution functions show strong interactions between K+ ions and acidic residues, and between Cl− ions and basic residues. Some weak pairing for pairs of like charges is also observed, between K+ ions and basic residues, as well as between Cl− ions and acidic residues. The overall picture remains the same, whether one includes only the pore residues (red line) or all charged residues (green line), and further analysis indicates that the constriction zone residues alone (D113, E117 and D121) account for the majority of the electrostatic interactions with diffusing K+ across the OmpF pore.
Figure 5.
Radial distribution functions g(r) calculated from MD between the K+ and Cl− ions and the charged OmpF residues. All the g(r) are normalized to be equal to 1.0 at r=10 Å.
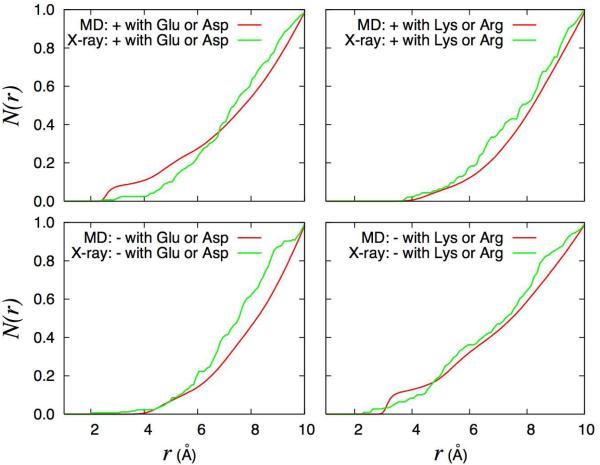
The running coordination number, N(r), between ions and the charged OmpF pore residues calculated from the MD trajectory and X-ray structures is shown in Figure 6. For the sake of comparison, all the N(r) were normalized to reach a value of 1.0 at a distance r = 10 Å (the scaling factors vary between 0.5 and 1.4). The most noticeable difference between MD and X-ray concerns the spatial distribution of cations with respect to the acidic residues: there are more cations near acidic residues at short distances (r < 6 Å) in the MD than in the X-ray. In contrast, there are more anions near acidic residues at very short distances (r < 4 Å)) in the X-ray than in the MD. There are more anions near basic residues at very short distances (r < 3 Å) in the X-ray than in the MD (though there are more in the MD at slightly larger distances with r between 3 and 5 Å), and the number of cations near basic residues at short distances is the same in MD and X-ray.
Figure 6.
Running coordination number between ions and the charged OmpF pore residues. The spherical atomic coordination number function N(r) between the side chain atoms of charged residues in the OmpF pore is calculated by integrating the radial distribution function g(r) and is normalized to 1.0 at a distance of 10 Å (the rescaling factors vary between 0.5 and 1.4). The ion distribution calculated from a 50 ns MD trajectory with 1 M KCl is compared with the results from X-ray structures. For the MD (red lines), the cations and anions are K+ and Cl−, respectively. For the X-ray structures (green lines), the cations are Rb+ and Mg2+ ions, and the anions are Br− ions. Top left: K+ ions and Asp or Glu residues; Top right: K+ ions and Arg or Lys residues; Bottom left Cl− ions and Asp or Glu residues; Bottom right: Cl− ions and Arg or Lys residues.
These structural features about ion distribution in OmpF were extracted from a 50 ns MD simulation at 1 M KCl. At such a high salt concentration, the cationic specificity of OmpF is expected to be considerably reduced due to electrostatic screening. An additional MD simulation of 50 ns, in which the KCl concentration was reduced from 1 M to 150 mM, dramatically increased cation-selectivity of the OmpF channel (I+/I− of 6.70), as previously reported13. The decrease in anion permeation events had little effect on the cation permeation pathway as the majority of contacts between diffusing K+ and OmpF residues remained with the extracellular loops and periplasmic mouth of the OmpF channel (Supplemental Table S4).
CONCLUSIONS AND DISCUSSION
Cations and anions form separate permeation pathways across OmpF
To determine the pathway of cation and anion transfer across the OmpF pore experimentally, and identify residues playing an important role in ion permeation, OmpF crystals were soaked in 0.1, 0.2, or 0.3 M KBr or 0.2 M NaBr and Br− positions were determined using bromide anomalous X-ray scattering data. These Br− positions were then compared with previously identified Rb+ positions from experiments in which OmpF crystals were soaked in 0.3 M RbCl (PDB ID 3HWB)14. For the sake of simplicity, the cation and anion positions observed in the X-ray scattering experiments are loosely referred to as “binding sites” in the present discussion. However, given the large conductance of OmpF, the lumen of the pore is certainly not expected to present any deep free energy wells for monovalent anions and cations. A reasonable interpretation is that the observed positions indeed represent favorable locations within the pore, but those correspond to shallow free energy wells on the order of ~kBT12,13. Such ion positions can only be revealed by carrying out scattering experiments at liquid nitrogen temperature to remove the influence of thermal fluctuations. Consistent with this view, no ion binding sites were previously detected in X-ray scattering experiments carried out at room temperature8. As observed in Figures 1a and 1c, the Br− ions are clustered in three regions within the OmpF pore (magenta spheres). The Br− ions from cluster 1 are found near residues R167 and R168 in the extracellular pore vestibule, Br− ions from cluster 2 are near the constriction zone arginines R42, R82, and R132, and the Br− ions from cluster 3 are located just below the constriction zone in the periplasmic pore vestibule near K16. There is also a fourth Br− cluster outside the lumen of the OmpF pore (Figure 1a). Additional Br− ions, observed at unique sites from a single chain within a given OmpF structure (pink spheres in Figure 1a) may not represent tight binding interactions, but give some insights into anion translocation across OmpF and suggest that anions remain associated with basic and hydrophilic residues along the β-barrel wall during transfer across the length of the pore (Figures 1a and 2a). X-ray data from the 0.3MKBr-OmpF and 0.2MNaBr-OmpF structures also show the most prominent binding sites for Mg2+ ions (green spheres in Figure 1b and 1d), which were present in the crystallization solution. These provide good illustrative examples of the strong interactions formed by divalent cations with OmpF residues. In stark contrast to the anion binding profile, Mg2+ ions are bound in three clusters near the extracellular loops 5, 6 and 8. In these sites, the Mg2+ ions are coordinated by polar side chains and backbone carbonyl oxygens (Figure 1d, Table 2). There is an additional cluster of Mg2+ ions found in the pore near the constriction zone, coordinated by the E117 side chain. A comparison with the RbCl OmpF structure (PDB ID 3HWB)14 shows a similar constriction zone binding site for Rb+ ions and additional Rb+ sites suggest that cation permeation across the OmpF pore is mainly facilitated by interactions with polar side chain and backbone atoms.
A comparison of ion binding sites (Figures 3a and 4) identified from the X-ray structures (large spheres) with K+ and Cl− ion positions extracted from snapshots along an MD trajectory (small spheres) shows excellent qualitative agreement with respect to the overall ion positions. This comparison supports the concept of two separate transfer pathways for cations and anions across the OmpF pore, which was previously proposed on the basis of MD simulations12,13. The X-ray structures and MD simulation data (Table 1) each suggest that permeating anions enter the OmpF extracellular vestibule near loop 2 and follow the electric field generated by R167 and R168 in the extracellular vestibule. The anions then pass across the constriction zone through favorable interactions with the cluster of arginine residues on the β-barrel wall (R42, R82 and R132), and continue their path along the β-barrel wall across the periplasmic side of the pore, in an anticlockwise rotation, through interactions with K16, K46, K89, R140 and R270. In contrast, both the X-ray and MD simulation data (Table 2) suggest that cations form considerable interactions with residues of surface-exposed loops 5 to 8 on the opposite side of the pore. Upon entering the pore lumen, the cations associate with acidic residues on loop 3 in the constriction zone (D113, E117 and D121) and continue down across the periplasmic side of the pore through interactions with mostly tyrosine side chain or backbone oxygen atoms. The differences between anion and cation permeation pathways across OmpF are further illustrated by g(r) calculations between the ions and charged pore residues, which show that while Cl− interact with basic residues in all regions of the pore, K+ only interact with acidic residues in the constriction zone (Figure 5). Furthermore, the close correspondence between the X-ray and MD results (Figure 6) provides strong evidence that the positions of cations and anions are not an artifact caused by the crystallization conditions.
Ion selectivity
Understanding the mechanisms by which wide aqueous pores discriminate between different types of ions is a first, necessary step for adequately interpreting the principles underlying channel selectivity in general15. One of the most straightforward measures of channel selectivity is the reversal potential (Vrev), which is the transmembrane voltage that must be applied to yield zero net current in the presence of an ion gradient across the membrane. Several experimental studies have reported values of Vrev for the OmpF channel11,16–19, and Vrev has also been calculated from theoretical BD and continuum electrodiffusion approximations13,20–22, and recently using a new methodology to impose a concentration gradient in all-atom MD simulations23. In each case, OmpF porin displays a K+ to Cl− permeability ratio (PK/PCl) of ~4.
Two main factors that can contribute to channel selectivity include differences in cation and anion diffusion rates during transfer, and specific ion-interactions with the channel along the permeation pathway19,24. If one assumes that differences in diffusional rates of K+ and Cl− can be neglected in a wide aqueous pore, then the slight cation-selectivity displayed by OmpF should correlate with the pore's electrostatic environment25. However, the OmpF channel contains a greater number of basic than acidic pore residues, giving a net positive charge per monomer at neutral pH26. This counter intuitive observation is also true for the related OmpC porin, which displays even greater cation-selectivity compared to OmpF (PK/PCl of 26)11. In order to provide new insights into the molecular determinants of ion selectivity in wide pores, we applied a combined experimental and computational approach to identify OmpF residues that interact with cations and anions in several structural models and calculate the frequency of OmpF-ion contacts along an all-atom MD trajectory. Results of this combined approach show that, although anions contact many basic pore residues during transfer across OmpF, cations only come in contact with acidic pore residues in the narrow constriction zone, and instead find the most prominent binding sites near the OmpF extracellular loops 5 to 8 (Figures 1b and 3b). Interestingly, a previous OmpF structure (PDB ID 3POX)27 shows K+ ions bound in each of the three extracellular loop cation-binding clusters identified in this work (Mg2+ clusters 1, 2 and 3), and the crystal structure of OmpC porin (PDB ID 2J1N)28 also shows a Mg2+ ion bound at the cation cluster 3 site. Therefore, the OmpF surface exposed loops provide binding sites for both divalent and monovalent cations and are independent of the crystallization conditions or crystal space groups.
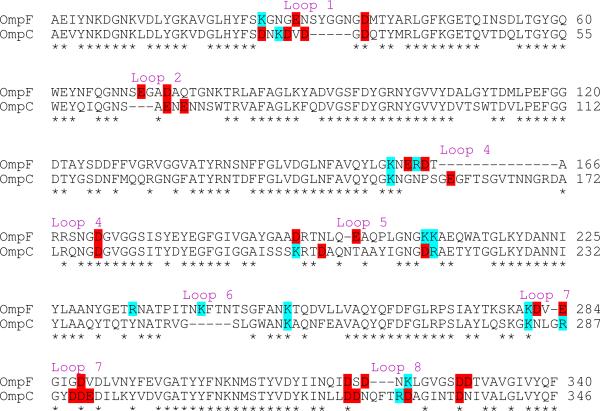
Although the most pronounced channel-cation interactions in the OmpF pore occur with the acidic residues in the narrow constriction zone (D113, E117 and D121), surprisingly, site-directed mutation of these residues does not eliminate OmpF's cation-selectivity26. This suggests that the pore's specificity arises from the influence of multiple residues distributed over a wide region of the channel21,29–31. The highest sequence diversity among members of the porin family resides within the extracellular loops, which have been previously shown to provide important binding and molecular recognition sites for many molecules, including phages, bacteriocins, antibodies, and various nutrient transport complexes32. A sequence comparison (Figure 7) shows a net negative charge of the OmpF extracellular loop residues (16 negatively charged aspartates and glutamates and 10 positively charged lysines and arginines, giving a net 6 negatively charged loop residues per monomer), which is even more pronounced for the OmpC porin (17 negatively charged aspartates and glutamates and 8 positively charged lysines and arginines, giving a net 9 negatively charged loop residues per monomer).
Figure 7. Comparison of E. coli OmpF and E. coli OmpC porin sequences.
Sequence alignment generated by ClustalW2 with basic (cyan) and acidic (red) surface-exposed extracellular loop residues highlighted. Conserved residues are indicated by stars below the sequences.
Therefore, the porin surface-exposed loops may contribute to overall channel selectivity for OmpF and OmpC by helping to recruit cations to the channel mouth. Alternatively, although anions make favorable electrostatic interactions with basic residues along the entire length of the OmpF pore, cation interactions with OmpF residues occur instead mostly through polar side chain and backbone oxygen atoms. The lack of specific cation-channel interactions in the OmpF pore may therefore allow for faster transfer across the channel, thereby increasing cation conductances. Mutation of surface loop and basic pore residues identified in this work as possible contributors to ion-selectivity could help distinguish between these two possibilities. Thus, by comparing a detailed theoretical model with an experimental picture of ion interaction sites by X-ray crystallography, we have identified novel factors leading to ion selectivity in large aqueous channels.
EXPERIMENTAL SECTION
Expression, isolation and purification of OmpF protein
OmpF was expressed in E. coli strain BL21(DE3)Omp533 using the pRSF-1b plasmid (Novagen) and purified from OM fractions by inner membrane solubilization as described previously34,35.
Crystallization and data collection
Crystals of E. coli OmpF protein were grown as described previously34 and soaked for 2 days in different concentrations of KBr (0.1, 0.2 and 0.3 M) or 0.2 M NaBr by replacing the mother liquor with 50% PEG 200, 25% glycerol, 0.1 M sodium cacodylate (pH 6.5) and the respective concentration of monovalent salts. Diffraction data were collected at beamlines GM/CA-XSD 23-ID and NE-CAT 24-ID-C at the Advanced Photon Source (Argonne National Lab). Processing of diffraction data was carried out with the HKL2000 suite of programs36. Data collection and refinement statistics are given in Table S1. Single-wavelength anomalous dispersion (SAD) data was collected at the Br edge (0.91956 Å) for all Br soaked protein crystals. 0.1MKBr-OmpF and 0.2MKBr-OmpF crystallized in the P3 space group and contained two monomers, each from a separate channel, in the asymmetric unit. 0.3MKBr-OmpF (C2 space group) and 0.2MNaBr-OmpF (P212121 space group) each contained three monomers from a single channel in the asymmetric unit.
Structure determination and refinement
The 0.2MKBr-OmpF, 0.3MKBr-OmpF and 0.2MNaBr-OmpF structures were solved by molecular replacement (MR) with Phaser v2.137 using PDB ID 2OMF9 as the starting model and refined by REFMAC38, each implemented in the CCP4 program suite39. The Br− ions were determined at 5.0 σ contour level using the Br anomalous map generated by the FFT program in the CCP4 suite and confirmed using the Phaser-EP program in Phenix40. Mg2+ ions were determined by examining the |FO-FC| difference map peaks at 5.0 σ contour level. The 0.1MKBr-OmpF structure was solved using AutoMR with PDB ID 2OMF9 as the starting model and refined using phenix.refine41 implemented in the Phenix program. The Br− ions were determined using the Autosol42 program in Phenix and were confirmed by examining the peaks using a Br anomalous map at 10.0 σ contour level. Water molecules were assigned by COOT43 for all above models. Unassigned densities observed in the channel pore were modeled as PEG and glycerol molecules.
Molecular dynamics simulations
All simulations were carried out using the NAMD scalable molecular dynamics program44 together with the all-atom CHARMM27 force field for protein and lipids45,46 and TIP3P for water47. Tetragonal periodic boundary conditions were applied with a distance of 123.50 Å in the XY-direction and 127.55 Å in the Z-direction and electrostatic interactions were calculated using the Particle-Mesh Ewald method48 with a grid spacing of 1 Å−1. Simulations were performed at constant pressure (1 atm) and temperature (300 K) with a time step of 2 fs. The simulation system, constructed by CHARMM-GUI49 consisted of the OmpF trimer, 330 POPC lipid molecules, 45,000 water molecules, and either 1 M or 150 mM KCl, for a total system size of ~200,000 atoms. The structure of the protein was taken from PDB ID 2OMF9 and residues E296, D312 and D127 were protonated12,13,50. Ionic current used to calculate I+/I− was determined by calculating the charge displacement across the membrane51–53 using:
where zi and qi are the z-coordinate and charge of ion i, respectively, with a timestep, t, of 100 ps (the results are independent of t). The spherical atomic radial distribution function, g(r), between the ions and OmpF charged pore residues (K16, R42, K46, E62, K80, R82, K89, D97, R100, D107, D113, E117, D121, D126, R132, R140, R167, R168, E181, R196, K219, D221, R270, D290) was implemented in VMD54, defined as55,
where r is the distance between a pair of particles, p(r) is the average number of atom pairs found at a distance between r and r + Δr, V is the total volume of the system, and Npairs is the number of unique pairs of atoms. OmpF-ion contacts (defined within a cutoff of 3 Å for K+ or 3.75 Å for Cl− based on the g(r) calculations in Figure 5a) were counted every 100 ps along the 50 ns trajectory (Tables S2-S4). The running coordination number N(r) was calculated by integrating the g(r) from 0 to a distance r.
Supplementary Material
ACKNOWLEDGEMENTS
X-ray diffraction data were collected at the Advanced Photon Source of Argonne National Laboratory through beamlines GM/CA-XSD 23-ID (funded by the National Cancer Institute supported by grant Y1-CO-1020 and the National Institute of General Medical Sciences through grant Y1-GM-1104) and NE/CAT 24-ID-C (funded by the National Center for Research Resources through grant 5P41RR015301-10 and the National Institute of General Medical Sciences by grant 8 P41 GM103403-10).
Funding Sources
These studies were supported by the National Institute of General Medical Sciences of the National Institutes of Health (NIH/NIGMS) through grant GM062342.
ABBREVIATIONS
- OM
outer membrane
- MD
molecular dynamics
- BD
Brownian dynamics
- PEG
polyethylene glycol
- POPC
1-palmitoyl-2-oleoyl-sn-glycero-3-phosphocholine
- g(r)
radial distribution function
- N(r)
running coordination number
- Vrev
reversal potential
- SAD
single-wavelength anomalous dispersion
- MR
molecular replacement
Footnotes
Author Contributions
The manuscript was written through contributions of all authors. All authors have given approval to the final version of the manuscript.
The authors declare no competing financial interest.
Accession numbers. The coordinates have been deposited in the PDB with accession codes 4LSE (0.2M NaBr), 4LSF (0.1M KBr), 4LSH (0.2M KBr) and 4LSI (0.3M KBr).
ASSOCIATED CONTENT
Crystallographic information files (CIF) for 0.1MKBr-OmpF, 0.2MKBr-OmpF, 0.3MKBr-OmpF and 0.2MNaBr-OmpF and supplementary tables containing contacts between OmpF residues and K+ and Cl− or molecular dynamics simulations are provided. This material is available free of charge via the Internet at http://pubs.acs.org.
REFERENCES
- 1.Decad GM, Nikaido HJ. Bacteriol. 1976;128:325–336. doi: 10.1128/jb.128.1.325-336.1976. [DOI] [PMC free article] [PubMed] [Google Scholar]
- 2.Nakae T, Nikaido H. J. Biol. Chem. 1975;250:7359–7365. [PubMed] [Google Scholar]
- 3.Bavoil P, Nikaido H, Von Meyenburg K. Mol. Gen. Genet. 1977;158:23–33. doi: 10.1007/BF00455116. [DOI] [PubMed] [Google Scholar]
- 4.Nakae T. J. Biol. Chem. 1976;251:2176–2178. [PubMed] [Google Scholar]
- 5.Nakae T. Biochem. Biophys. Res. Commun. 1976;71:877–884. doi: 10.1016/0006-291x(76)90913-x. [DOI] [PubMed] [Google Scholar]
- 6.Jap BK, Walian PJ. Q. Rev. Biophys. 1990;23:367–403. doi: 10.1017/s003358350000559x. [DOI] [PubMed] [Google Scholar]
- 7.Nikaido H. J. Bioenerg. Biomembr. 1993;25:581–589. doi: 10.1007/BF00770245. [DOI] [PubMed] [Google Scholar]
- 8.Cowan SW, Schirmer T, Rummel G, Steiert M, Ghosh R, Pauptit RA, Jansonius JN, Rosenbusch JP. Nature. 1992;358:727–733. doi: 10.1038/358727a0. [DOI] [PubMed] [Google Scholar]
- 9.Cowan SW, Garavito RM, Jansonius JN, Jenkins JA, Karlsson R, Konig N, Pai EF, Pauptit RA, Rizkallah PJ, Rosenbusch JP, Rummel G, Schirmer T. Structure. 1995;3:1041–1050. doi: 10.1016/s0969-2126(01)00240-4. [DOI] [PubMed] [Google Scholar]
- 10.LeMasurier M. J. Gen. Physiol. 2001;118:303–314. doi: 10.1085/jgp.118.3.303. [DOI] [PMC free article] [PubMed] [Google Scholar]
- 11.Benz R, Schmid A, Hancock R. J. Bacteriol. 1985;162:722–727. doi: 10.1128/jb.162.2.722-727.1985. [DOI] [PMC free article] [PubMed] [Google Scholar]
- 12.Im W, Roux B. J. Mol. Biol. 2002;319:1177–1197. doi: 10.1016/S0022-2836(02)00380-7. [DOI] [PubMed] [Google Scholar]
- 13.Im W, Roux B. J. Mol. Biol. 2002;322:851–869. doi: 10.1016/s0022-2836(02)00778-7. [DOI] [PubMed] [Google Scholar]
- 14.Dhakshnamoorthy B, Raychaudhury S, Blachowicz L, Roux B. J. Mol. Biol. 2010;396:293–300. doi: 10.1016/j.jmb.2009.11.042. [DOI] [PMC free article] [PubMed] [Google Scholar]
- 15.Corry B. Mol. Biosyst. 2006;2:527–535. doi: 10.1039/b610062g. [DOI] [PubMed] [Google Scholar]
- 16.Lakey JH, Watts JP, Lea EJ. Biochim. Biophys. Acta. 1985;817:208–216. doi: 10.1016/0005-2736(85)90022-7. [DOI] [PubMed] [Google Scholar]
- 17.Danelon C, Suenaga A, Winterhalter M, Yamato I. Biophys. Chem. 2003;104:591–603. doi: 10.1016/s0301-4622(03)00062-0. [DOI] [PubMed] [Google Scholar]
- 18.Nestorovich EM, Rostovtseva TK, Bezrukov SM. Biophys. J. 2003;85:3718–3729. doi: 10.1016/S0006-3495(03)74788-2. [DOI] [PMC free article] [PubMed] [Google Scholar]
- 19.López ML, Aguilella-Arzo M, Aguilella VM, Alcaraz A. J. Phys. Chem. B. 2009;113:8745–8751. doi: 10.1021/jp902267g. [DOI] [PubMed] [Google Scholar]
- 20.Schirmer T, Phale PS. J. Mol. Biol. 1999;294:1159–1167. doi: 10.1006/jmbi.1999.3326. [DOI] [PubMed] [Google Scholar]
- 21.Aguilella-Arzo M, García-Celma JJ, Cervera J, Alcaraz A, Aguilella VM. Bioelectrochemistry. 2007;70:320–327. doi: 10.1016/j.bioelechem.2006.04.005. [DOI] [PubMed] [Google Scholar]
- 22.López ML, García-Giménez E, Aguilella VM, Alcaraz A. J. Phys. Condens. Matter. 2010;22:454106. doi: 10.1088/0953-8984/22/45/454106. [DOI] [PubMed] [Google Scholar]
- 23.Khalili-Araghi F, Ziervogel B, Gumbart JC. J. Gen. Physiol. 2013 doi: 10.1085/jgp.201311014. (in press) [DOI] [PMC free article] [PubMed] [Google Scholar]
- 24.Gillespie D, Eisenberg RS. Eur. Biophys. J. 2002;31:454–466. doi: 10.1007/s00249-002-0239-x. [DOI] [PubMed] [Google Scholar]
- 25.Alcaraz A, Nestorovich EM, Aguilella-Arzo M, Aguilella VM, Bezrukov SM. Biophys. J. 2004;87:943–957. doi: 10.1529/biophysj.104/043414. [DOI] [PMC free article] [PubMed] [Google Scholar]
- 26.Aguilella VM, Queralt-Martín M, Aguilella-Arzo M, Alcaraz A. Integr. Biol. 2011;3:159–172. doi: 10.1039/c0ib00048e. [DOI] [PubMed] [Google Scholar]
- 27.Efremov RG, Sazanov LA. J. Struct. Biol. 2012;178:311–318. doi: 10.1016/j.jsb.2012.03.005. [DOI] [PubMed] [Google Scholar]
- 28.Baslé A, Rummel G, Storici P, Rosenbusch JP, Schirmer T. J. Mol. Biol. 2006;362:933–942. doi: 10.1016/j.jmb.2006.08.002. [DOI] [PubMed] [Google Scholar]
- 29.Miedema H, Meter-Arkema A, Wierenga J, Tang J, Eisenberg B, Nonner W, Hektor H, Gillespie D, Meijberg W. Biophys. J. 2004;87:3137–3147. doi: 10.1529/biophysj.104.041384. [DOI] [PMC free article] [PubMed] [Google Scholar]
- 30.Vrouenraets M, Wierenga J, Meijberg W, Miedema H. Biophys. J. 2006;90:1202–1211. doi: 10.1529/biophysj.105.072298. [DOI] [PMC free article] [PubMed] [Google Scholar]
- 31.García-Giménez E, Alcaraz A, Aguilella VM. Phys. Rev. E Stat. Nonlin. Soft Matter Phys. 2010;81:021912. doi: 10.1103/PhysRevE.81.021912. [DOI] [PubMed] [Google Scholar]
- 32.Nikaido H. Microbiol. Mol. Biol. Rev. 2003;67:593–656. doi: 10.1128/MMBR.67.4.593-656.2003. [DOI] [PMC free article] [PubMed] [Google Scholar]
- 33.Prilipov A, Phale PS, Van Gelder P, Rosenbusch JP, Koebnik R. FEMS Microbiol. Lett. 1998;163:65–72. doi: 10.1111/j.1574-6968.1998.tb13027.x. [DOI] [PubMed] [Google Scholar]
- 34.Ziervogel BK, Roux B. Structure. 2013;21:76–87. doi: 10.1016/j.str.2012.10.014. [DOI] [PMC free article] [PubMed] [Google Scholar]
- 35.Taylor R, Burgner JW, Clifton J, Cramer WA. J. Biol. Chem. 1998;273:31113–31118. doi: 10.1074/jbc.273.47.31113. [DOI] [PubMed] [Google Scholar]
- 36.Otwinowski Z, Minor W. Methods Enzymol. 1997;276:307–326. doi: 10.1016/S0076-6879(97)76066-X. [DOI] [PubMed] [Google Scholar]
- 37.McCoy AJ, Grosse-Kunstleve RW, Adams PD, Winn MD, Storoni LC, Read RJ. J. Appl. Crystallogr. 2007;40:658–674. doi: 10.1107/S0021889807021206. [DOI] [PMC free article] [PubMed] [Google Scholar]
- 38.Murshudov GN, Vagin AA, Dodson EJ. Acta Crystallog. D. 1997;D53:240–255. doi: 10.1107/S0907444996012255. [DOI] [PubMed] [Google Scholar]
- 39.Winn MD, Ballard C, Cowtan KD, Dodson EJ, Emsley P, Evans P, Keegan R, Krissinel E, Leslie AG, Mccoy A, McNicholas S, Murshudov G, Pannu N, Potterton E, Powell HR, Read R, Vagin A, Wilson K. Acta Crystallog. D. 2011;67:235–242. doi: 10.1107/S0907444910045749. [DOI] [PMC free article] [PubMed] [Google Scholar]
- 40.Adams PD, Afonine PV, Bunkóczi G, Chen VB, Davis IW, Echols N, Headd JJ, Hung L-W, Kapral GJ, Grosse-Kunstleve RW, McCoy AJ, Moriarty NW, Oeffner R, Read RJ, Richardson DC, Richardson JS, Terwilliger TC, Zwart PH. Acta Crystallog. D. 2010;66:213–221. doi: 10.1107/S0907444909052925. [DOI] [PMC free article] [PubMed] [Google Scholar]
- 41.Afonine PV, Grosse-Kunstleve RW, Adams PD. Acta Crystallog. D. 2005;61:850–855. doi: 10.1107/S0907444905007894. [DOI] [PMC free article] [PubMed] [Google Scholar]
- 42.Terwilliger TC, Adams PD, Read RJ, McCoy AJ, Moriarty NW, Grosse-Kunstleve RW, Afonine PV, Zwart PH, Hung LW. Acta Crystallog. D. 2009;65:582–601. doi: 10.1107/S0907444909012098. [DOI] [PMC free article] [PubMed] [Google Scholar]
- 43.Emsley P, Cowtan K. Acta Crystallog. D. 2004;60:2126–2132. doi: 10.1107/S0907444904019158. [DOI] [PubMed] [Google Scholar]
- 44.Phillips JC, Braun R, Wang W, Gumbart J, Tajkhorshid E, Villa E, Chipot C, Skeel RD, Kalé L, Schulten K. J. Comput. Chem. 2005;26:1781–1802. doi: 10.1002/jcc.20289. [DOI] [PMC free article] [PubMed] [Google Scholar]
- 45.Feller SE, Yin D, Pastor RW, MacKerell AD. Biophys. J. 1997;73:2269–2279. doi: 10.1016/S0006-3495(97)78259-6. [DOI] [PMC free article] [PubMed] [Google Scholar]
- 46.Klauda JB, Venable RM, Freites JA, O'Connor JW, Tobias DJ, Mondragon-Ramirez C, Vorobyov I, MacKerell AD, Pastor RW. J. Phys. Chem. B. 2010;114:7830–7843. doi: 10.1021/jp101759q. [DOI] [PMC free article] [PubMed] [Google Scholar]
- 47.Jorgensen WL, Chandrasekhar J, Madura JD, Impey RW, Klein ML. J. Chem. Phys. 1983;79:926–935. [Google Scholar]
- 48.Darden TA, Pedersen LG. Environ. Health Perspect. 1993;101:410–412. doi: 10.1289/ehp.93101410. [DOI] [PMC free article] [PubMed] [Google Scholar]
- 49.Jo S, Kim T, Iyer VG, Im W. J. Comput. Chem. 2008;29:1859–1865. doi: 10.1002/jcc.20945. [DOI] [PubMed] [Google Scholar]
- 50.Varma S, Chiu S-W, Jakobsson E. Biophys. J. 2006;90:112–123. doi: 10.1529/biophysj.105.059329. [DOI] [PMC free article] [PubMed] [Google Scholar]
- 51.Pezeshki S, Chimerel C, Bessonov AN, Winterhalter M, Kleinekathofer U. Biophys. J. 2009;97:1898–1906. doi: 10.1016/j.bpj.2009.07.018. [DOI] [PMC free article] [PubMed] [Google Scholar]
- 52.Aksimentiev A, Schulten K. Biophys. J. 2005;88:3745–3761. doi: 10.1529/biophysj.104.058727. [DOI] [PMC free article] [PubMed] [Google Scholar]
- 53.Crozier PS, Henderson D, Rowley RL, Busath DD. Biophys. J. 2001;81:3077–3089. doi: 10.1016/S0006-3495(01)75946-2. [DOI] [PMC free article] [PubMed] [Google Scholar]
- 54.Humphrey W, Dalke A, Schulten K. J. Mol. Graph. 1996;14:33–8. 27–8. doi: 10.1016/0263-7855(96)00018-5. [DOI] [PubMed] [Google Scholar]
- 55.Levine BG, Stone JE, Kohlmeyer A. J. Comput. Phys. 2011;230:3556–3569. doi: 10.1016/j.jcp.2011.01.048. [DOI] [PMC free article] [PubMed] [Google Scholar]
Associated Data
This section collects any data citations, data availability statements, or supplementary materials included in this article.


