

Background: Deoxyhypusine synthase promotes mRNA translation by catalyzing the hypusine modification of eIF5A.
Results: Inhibition of deoxyhypusine synthase reduced accumulation and proliferation of Th1 cells in type 1 diabetic mice and in vitro by reducing CD25 expression in T cells.
Conclusion: Deoxyhypusine synthase promotes Th1 cell proliferation and differentiation.
Significance: Inhibition of deoxyhypusine synthase may provide a novel strategy for reducing diabetogenic Th1 cells in type 1 diabetes.
Keywords: Diabetes, Immunology, Islet, Mouse, T Cell
Abstract
In type 1 diabetes, cytokines arising from immune cells cause islet β cell dysfunction even before overt hyperglycemia. Deoxyhypusine synthase catalyzes the crucial hypusine modification of the factor eIF5A, which promotes the translation of a subset of mRNAs involved in cytokine responses. Here, we tested the hypothesis that deoxyhypusine synthase and, secondarily, hypusinated eIF5A contribute to the pathogenesis of type 1 diabetes using the non-obese diabetic (NOD) mouse model. Pre-diabetic NOD mice that received injections of the deoxyhypusine inhibitor N1-guanyl-1,7-diaminoheptane (GC7) demonstrated significantly improved glucose tolerance, more robust insulin secretion, and reduced insulitis compared with control animals. Analysis of tissues from treated mice revealed selective reductions in diabetogenic T helper type 1 (Th1) cells in the pancreatic lymph nodes, a primary site of antigen presentation. Isolated mouse CD90.2+ splenocytes stimulated in vitro with anti-CD3/anti-CD28 and IL-2 to mimic autoimmune T cell activation exhibited proliferation and differentiation of CD4+ T cell subsets (Th1, Th17, and Treg), but those treated with the deoxyhypusine synthase inhibitor GC7 showed a dose-dependent block in T cell proliferation with selective reduction in Th1 cells, similar to that observed in NOD mice. Inhibition of deoxyhypusine synthase blocked post-transcriptional expression of CD25, the high affinity IL-2 receptor α chain. Our results suggest a previously unrecognized role for deoxyhypusine synthase in promoting T cell proliferation and differentiation via regulation of CD25. Inhibition of deoxyhypusine synthase may provide a strategy for reducing diabetogenic Th1 cells and preserving β cell function in type 1 diabetes.
Introduction
The development of type 1 diabetes mellitus (T1D)2 involves a cascade of events that results in the eventual autoimmune destruction of insulin-producing islet β cells. In the pre-diabetic phase, evidence suggests that β cell autoantigens, presented in the context of MHC class II molecules by antigen-presenting cells, stimulate CD4+ T helper cells in local pancreatic lymph nodes. This stimulatory event initiates signals that lead to the infiltration of islets by macrophages, CD8+ T cells, and CD4+ T cells (among others), resulting in insulitis and the release of pro-inflammatory cytokines (IL-1β, IFN-γ, TNF-α) (for reviews, see Refs. 1, 2). Whereas the pathogenesis of T1D has primarily been studied in non-obese diabetic (NOD) mice, there is evidence that it also applies to humans with T1D (3, 4). The insulitis phase precedes the development of diabetes in the NOD mouse by several weeks, and recent studies in pre-diabetic NOD mice and humans suggest that defects in β cell function in the early insulitis phase, possibly a result of endoplasmic reticulum stress, result in glucose intolerance (5–7). Maintenance of β cell mass and function has been of recent interest in the area of T1D therapeutics, particularly with the findings from the Diabetes Control and Complications Trial that persistence of β cell function (as assessed by serum C-peptide) independently reduces the risk of microvascular complications and hypoglycemia (8). In this study, we tested whether inhibition of a new target, deoxyhypusine synthase (DHS), might offer a novel approach to preserve β cell function in the face of ongoing autoimmunity in T1D.
DHS is an enzyme that catalyzes the rate-limiting step in the post-translational conversion of lysine to hypusine, which is curiously found only at position 50 in eukaryotic translation initiation factors 5A1 and 5A2 (eIF5A1 and eIF5A2) (9). eIF5A1 is the primary isoform present in most cell types, and will simply be referred to here as “eIF5A.” Although originally identified as a translation initiation factor, recent studies have revealed that eIF5A appears to participate in the elongation phase of mRNA translation in eukaryotes, possibly via interaction with the elongation factor eEF2 (10–12). Studies from our group have shown that eIF5A participates in the innate immune response, wherein the normal response to cytokines within the β cell is dependent upon the hypusinated form of eIF5A (eIF5AHyp). eIF5AHyp is responsible for binding to the mRNA encoding inducible nitric-oxide synthase (iNOS) and ensuring its translation at the ribosome (13, 14). Specific inhibition of DHS using N1-guanyl-1,7-diaminoheptane (GC7) resulted in protection of islets from cytokine-induced dysfunction (13). A role for eIF5AHyp has also been suggested in the adaptive immune response. In dendritic cells (DCs), upon exposure to antigen, eIF5AHyp ensures the nucleocytoplasmic shuttling and translation of the mRNA encoding the cell maturation marker CD83 (15). In T cells and B cells, eIF5AHyp and its modifying enzyme DHS have been suggested to promote cellular proliferation (16, 17). Because T1D emanates from a confluence of both the innate and adaptive immune responses (1, 18), we hypothesized that DHS and eIF5AHyp contribute to the immunopathogenesis of T1D.
To investigate a role for DHS (and by inference eIF5AHyp) in T1D pathogenesis, we performed DHS inhibition studies (using GC7) in the NOD mouse model. Our results indicate that DHS contributes to glucose intolerance and insulitis and suggest further that DHS plays a central role in the proliferation and differentiation of pathogenic T helper type 1 (Th1) cells through regulation of the cell surface expression of CD25 (the IL-2 receptor α chain). We therefore propose that DHS inhibition may serve as a novel approach for the reduction of pathogenic Th1 cells in the treatment of T1D.
EXPERIMENTAL PROCEDURES
Animals and Methods
All procedures involving mice were approved by the Indiana University Animal Care and Use Committee, and all experiments were performed in agreement with the principles and procedures outlined in the National Institutes of Health Guidelines for the Care and Use of Experimental Animals. Mice were housed in a specific pathogen-free environment under controlled conditions of temperature and light (12 h on/12 h off) and were provided free access to water and food. Female NOD/ShiLTJ (NOD) mice were obtained from Jackson Laboratories. Beginning at 6 weeks of age, groups of 10 NOD mice were subjected to daily intraperitoneal injections of GC7 as described previously at doses of 0.5, 4, and 10 mg/kg for a total of 4 weeks. Some mice were euthanized at the end of the 4-week treatment period for harvesting of tissues; others were euthanized upon the development of diabetes (two consecutive blood glucose readings ≥300 mg/dl) or when the animals reached 20 weeks of age (whichever came first). The spleen and pancreatic lymph nodes were harvested at the time of euthanasia. Spleens were lysed with red blood cell lysis buffer (155 mm NH4Cl, 12 mm NaHCO3, 0.1 mm EDTA) before washing. Pancreatic islets were isolated following collagenase digestion (19). Intraperitoneal glucose tolerance tests (GTTs) (2 mg/kg glucose injection) on fasted animals were performed as described previously (20).
Immunohistochemistry and Insulitis Scoring
Pancreata were harvested, fixed, embedded, and sectioned as described previously (20). Tissue images (three pancreas sections at least 70 μm apart from three animals per group) were acquired on an Axio-Observer Z1 microscope (Zeiss) fitted with an AxioCam high resolution color camera and scored for insulitis using the following grading scheme: grade 1 = no islet-associated mononuclear cell infiltrates; grade 2 = peri-insulitis affecting <50% of the circumference of the islet without evidence of islet invasion; grade 3 = peri-insulitis affecting >50% of the circumference of the islet without evidence of islet invasion; grade 4 = islet invasion. Approximately 150 islets/pancreas were evaluated for insulitis scoring. For the immunofluorescence studies, frozen pancreas sections were stained with insulin, anti-CD4 (clone RM4-5), and 4′,6-diamidino-2-phenylindole (for visualization of nuclei), and images were acquired using an Axio-Observer Z1 microscope as described above.
RNA Analyses
Quantitative RT-PCR was performed using SYBR Green technology. RNA was isolated as described previously (21), as were primers for spliced Xbp1 (22). Primers for mouse Il2ra mRNA were: forward, 5′-CTTGCTGATGTTGGGGTTTC-3′, and reverse, 5′-CAGTTTAGGATGGTGCCGTT-3′. All data were normalized to the message encoding β2 microglobulin, and represent the average of independent determinations from at least three independent experiments.
Flow Cytometric Analysis
Spleen samples were treated with red blood cell lysis buffer for 3 min prior to washing with phosphate-buffered solution of 154 mm NaCl. For Treg analyses, equal volumes of the single cell suspensions were stained using anti-CD4 (clone RM4-5), and anti-CD25 (PC61.5) antibodies and fixed overnight before being permeabilized and stained with anti-Foxp3 (FJK-16s) antibody according to the manufacturer's instructions (eBioscience). For the Th1 and Th17 cell analyses, equal volumes of the single cell suspensions were first incubated with 1× Cell Stimulation Mixture (eBioscience) for 4 h prior to staining with anti-CD4 antibody; cells were again fixed overnight then permeabilized and stained for IL-17A (eBio17B7) and IFN-γ (XMG1.2) according to the manufacturer's instructions (eBioscience). For DC analyses, equal volumes of the single cell suspensions were stained with anti-CD11c (N418), anti-MHCII (M5/144.15.2), anti-CD11b (M1/70), anti-CD83 (3D11), and anti-CD80 (16–10A1). Cells were analyzed using a FACSCalibur flow cytometer (BD Biosciences), an LSRII flow cytometer (BD Biosciences), and FlowJo software (TreeStar).
For flow cytometric analyses following stimulation in vitro, single cell suspensions were made from spleens harvested from mice as described above. Mouse pan T cells (CD90.2+) were isolated from spleens and pancreatic lymph nodes using the Dynabeads FlowComp Mouse Pan T (CD90.2) kit (Invitrogen). 106 cells were cultured in the presence of 75 units/ml recombinant human IL-2 (ProSpec) and activated with anti-CD3/anti-CD28 antibody-coated beads (Invitrogen) at a concentration of one bead/cell for 4 days. Cells were then harvested, nonspecific Fc-mediated interactions were blocked with anti-CD16/32 (clone 93), and cells were stained as described above for the examination of Treg, Th1, and Th17 cell populations. The LIVE/DEAD® Fixable Violet Dead Cell Stain kit (Invitrogen) allowed for the exclusion of dead cells. Cells were analyzed using a BD LSRII flow cytometer (BD Biosciences) and FlowJo software.
Studies of Cellular Proliferation
For determination of cellular proliferation, single cell suspensions of cells were incubated in 5 μm membrane dye carboxyfluorescein diacetate succinimidyl ester (CFSE) for 10 min at 37 °C, diluted with 5 volumes of ice-cold media, and incubated for 5 min on ice. Samples were then washed with PBS three times and subjected to stimulation in vitro as described above.
Immunoblot Analyses
Pan T cells were centrifuged through a Ficoll gradient to separate live cells from dead cells. Protein lysates from live cells were immunoblotted for CD25, hypusine, total eIF5A, GAPDH, and iNOS and visualized using an Odyssey Imaging System (Li-Cor Biosciences) as described previously (13).
Hormone and Cytokine Analyses
Serum insulin was measured using the Ultra Sensitive Mouse Insulin ELISA kit (Crystal Chem), and serum proinsulin was measured using the Proinsulin Rat/Mouse ELISA kit (Mercodia). Cytokine levels were measured using the Multi-Analyte ELISArray (Qiagen) or single analyte ELISA kits (eBioscience).
Statistical Analyses
All data are presented as the mean ± S.E. One-way ANOVA (with either the Bonferroni or Dunnett's post test) was used for comparisons involving more than two conditions. Survival curve analyses were analyzed using the log-rank (Mantel-Cox) test. Prism 5 software was used for all statistical analyses, including AUC analyses via the trapezoidal method (23). Statistical significance was assumed at p < 0.05.
RESULTS
Inhibition of DHS in Pre-diabetic NOD Mice Protects against Glucose Intolerance
To address the role of DHS in the pathogenesis of autoimmune T1D, we employed the well characterized DHS inhibitor GC7. GC7 is potent at inhibiting DHS in vitro and in cells (24–26), and intraperitoneal injections of GC7 have shown efficacy in streptozotocin models and mouse models of type 2 diabetes (13, 27). To date, however, no studies have shown efficacy of GC7 in the NOD mouse model of type 1 diabetes. We subjected 6-week-old pre-diabetic NOD mice to 4 weeks of daily GC7 treatment (0, 0.5, 4, and 10 mg/kg body weight) and then performed analysis of glucose homeostasis. We have shown previously that NOD mice in the pre-diabetic phase of the disease (6–10 weeks of age) show progressive β cell dysfunction because of increasing insulitis and endoplasmic reticulum stress (6). As shown in Fig. 1A, treatment with GC7 at all doses resulted in significantly improved glucose tolerance in 10-week-old pre-diabetic mice at the end of the 4-week treatment period. These improvements in glucose tolerance are reflected in a statistically reduced AUC for the GC7-treated animals (Fig. 1B). Insulin levels during the GTT were measured within the control and 4 mg/kg GC7 groups (Fig. 1C). Analysis of these results revealed that although the AUC for insulin secretion was not different between groups (Fig. 1D), the change in insulin levels (Δinsulin) during the first 2 min following glucose injection was significantly greater in GC7-treated animals compared with controls (Fig. 1E). The Δinsulin at 10 min, however, was not different between the two groups (Fig. 1F). These results are consistent with prior studies that show that insulin secretion during the first 2 min of a GTT were most closely correlated with overall glycemic control in NOD mice (5, 6).
FIGURE 1.

Effect of DHS inhibition on glycemic control in pre-diabetic NOD mice. Female NOD mice were injected daily with different doses of the DHS inhibitor GC7 in the pre-diabetic period beginning at 6 weeks of age and ending at 10 weeks of age. A, results of intraperitoneal GTTs from pre-diabetic NOD mice at age 10 weeks that received vehicle control (n = 6), 0.5 mg/kg GC7 (n = 10), 4 mg/kg GC7 (n = 7), and 10 mg/kg GC7 (n = 9). B, AUC analysis of GTT data in A. * indicates that the corresponding value is significantly different from vehicle control by one-way ANOVA or the Mann-Whitney U test. C, results of serum insulin ELISAs following intraperitoneal glucose administration in pre-diabetic NOD mice at 10 weeks of age that received vehicle control (n = 4, filled symbols) and 4 mg/kg GC7 (n = 4, open symbols). D, AUC analysis of serum insulin data in C. E, change in serum insulin levels between 0 and 2 min following intraperitoneal glucose administration. * indicates that the value is significantly different from Control by two-tailed t test. F, change in serum insulin levels between 1 and 10 min following intraperitoneal glucose administration.
mRNA analysis from islets of 10-week-old pre-diabetic NOD mice showed that there was a significant reduction in the spliced form of Xbp1 in GC7-treated mice (Fig. 2). Spliced Xbp1 is a reflection of inositol-requiring enzyme 1 (IRE-1) activity in the unfolded protein response/ER stress pathway. These studies suggest that improvements in glycemic control in GC7-treated animals were likely secondary to improvements in β cell function and reduced ER stress.
FIGURE 2.
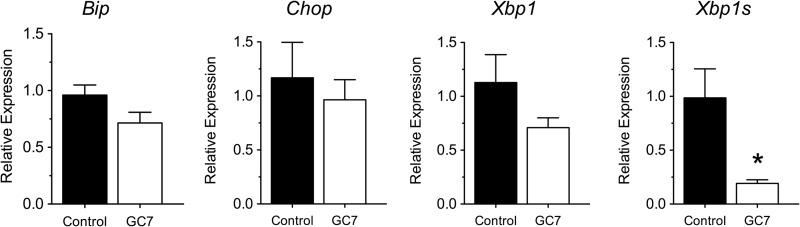
Effect of DHS inhibition on markers of ER stress in islets from NOD mice. Female NOD mice (n = 4) were injected daily with 4 mg/kg DHS inhibitor GC7 in the pre-diabetic period beginning at 6 weeks of age and ending at 10 weeks of age, after which islets were isolated and subjected to RT-PCR. The figure shows results of RT-PCR for the genes Bip, Chop, Xbp1, and spliced Xbp1s (Xbp1s). Data were normalized to the housekeeping gene Actb. * indicates that values are significantly different from vehicle controls by a two-tailed t test.
Inhibition of DHS Reduces Insulitis and Percentage of Th1 Cells in Pancreatic Lymph Nodes
The improvements in glycemic control and islet ER stress led us to examine more carefully the occurrence of insulitis in GC7-treated mice, as changes in immune cell infiltration and/or make-up in the pancreas might account for our findings. Pancreata from 10-week-old pre-diabetic control and GC7-treated mice were harvested and examined by immunohistochemistry for severity of insulitis. Representative images (Fig. 3A) show reductions in the severity of insulitis in the control versus the 4 mg/kg GC7-treated groups, and quantification from multiple tissue sections revealed dose-dependent reductions in both incidence and severity of insulitis in GC7-treated groups (Fig. 3B). Notably, development of diabetes in the 4 mg/kg GC7-treated group (n = 22 animals) was delayed in the initial 5 weeks following cessation of therapy (until 15 weeks of age, p < 0.05 by log-rank test), but this delay in diabetes did not persist in the subsequent 6 weeks (until 21 weeks of age, p = 0.3 by log-rank test), as shown in Fig. 3C.
FIGURE 3.

Insulitis and diabetes incidence in NOD mice. Female NOD mice were injected daily with vehicle control or 4 mg/kg of the DHS inhibitor GC7 in the pre-diabetic period beginning at 6 weeks of age and ending at 10 weeks of age. A, representative images of pancreata immunostained for insulin (brown) and counterstained with hematoxylin (blue) from pre-diabetic 10-week-old mice (magnification, ×400). Arrows identify invading immune cell infiltrate. B, results of quantification of insulitis in pre-diabetic 10-week-old mice (n = 3 per group, total of 100–150 islets per group). C, diabetes incidence in female NOD mice treated with vehicle control (n = 22) or 4 mg/kg GC7 (n = 22). The period over which GC7 was administered is indicated by the bracketed line.
Upon development of diabetes, which was diagnosed by two consecutive blood glucose readings of ≥300 mg/dl, the spleen and pancreatic lymph nodes of control and GC7-treated animals were then harvested, and CD4+ T cells in these tissues were examined by flow cytometry. Although no differences in the percentages of Th1 (CD4+/IFN-γ+), Th17 (CD4+/IL-17A+), and Treg (CD4+/CD25+/Foxp3+) cells were seen between control and GC7-treated groups in the spleen (Fig. 4A), there was a significant 2-fold reduction in Th1 cell percentage in the pancreatic lymph node of GC7-treated animals compared with controls (Fig. 4B).
FIGURE 4.

Effect of DHS inhibition in vivo on T cell subtypes in NOD mice. Female NOD mice were injected daily with vehicle control or varying concentrations of the DHS inhibitor GC7 in the pre-diabetic period beginning at 6 weeks of age and ending at 10 weeks of age (n = 5–9 per group). Upon development of diabetes, Th1, Th17, and Treg cell populations were examined via flow cytometry within spleens (A) and pancreatic lymph nodes (B). * indicates that values are significantly different from vehicle controls by one-way ANOVA.
Separately, we examined levels of conventional DCs (MHCII+CD11c+CD11b+) in NOD mice treated with 4 mg/kg GC7. Conventional DCs in the pancreatic lymph nodes at 10 weeks of age were too rare to quantitate (data not shown). In the spleens, although conventional DC percentages in GC7-treated mice increased, there was a trend (p = 0.06) toward a reduction in CD83+ expression in this cell population (Fig. 5). CD83 is a maturation marker for DCs (28), and this latter result is in accordance with the reported role of DHS in the maintenance of the CD83 surface expression on mature DCs (15).
FIGURE 5.

Effect of DHS inhibition in vivo on conventional DC percentages in NOD mice. Female NOD mice were injected daily with vehicle control or 4 mg/kg of the DHS inhibitor GC7 in the pre-diabetic period beginning at 6 weeks of age and ending at 10 weeks of age (n = 4–5 per group). Upon development of diabetes, conventional DC (MHCII+CD11c+CD11b+) percentages within spleens (left) and median fluorescence intensity of CD83 on gated conventional DCs (right) were examined by flow cytometry. * indicates that values are significantly different from vehicle controls by a two-tailed t test.
Inhibition of DHS Attenuates T Cell Proliferation by Reducing Cell Surface CD25 Expression
Given the reductions in insulitis and Th1 cell percentages in pancreatic lymph nodes upon DHS inhibition, we considered the possibility that DHS might directly control the T cell proliferative and polarization responses to autoantigens in mice. To test this possibility, CD90.2+ T cells from spleen and pancreatic lymph nodes from C57BL6/J mice were harvested, treated with varying doses of GC7 (0, 1, 10, 100 μm), and stimulated for 4 days with anti-CD3/anti-CD28 and IL-2 to mimic antigen-dependent/independent triggers for proliferation in a polyclonal fashion. The non-diabetes-prone C57BL6/J strain was selected for these experiments to exclude effects of endogenous antigen-dependent T cell stimulation from the autoimmune process. Prior to stimulation in vitro, T cells were loaded with the fluorescent dye CFSE to monitor proliferation. The decline of CFSE fluorescence with time reflects the dilution of the dye following successive rounds of cell division. Fig. 6, A–C, shows that there is a dose-dependent reduction in CFSE dilution with increasing concentrations of GC7, with a near complete block in proliferation at 100 μm GC7. This block in proliferation is reflected by the reduced number of cells seen at the end of the 4-day incubation (Fig. 6, A–C).
FIGURE 6.

Effect of DHS inhibition on CD4+ T cell proliferation and CD25 expression in vitro. Isolated mouse CD90.2+ splenocytes cells were stimulated in vitro with anti-CD3/anti-CD28 and IL-2 for 4 days in the presence or absence of varying concentrations of the DHS inhibitor GC7, then gated on CD4+ cells by flow cytometry. A, CFSE dye fluorescence intensity in unstimulated (black line) and stimulated (red line) CD4+ cells. B, effects of 1 μm (black line), 10 μm (red line), and 100 μm (green line) GC7 on CFSE fluorescence intensity in stimulated CD4+ cells. C, quantitation of CFSE fluorescence intensity from experiments in A and B from three independent experiments. * indicates that comparisons are significantly different by one-way ANOVA. D, median CD25 fluorescence intensity in unstimulated (black line) and stimulated (red line) CD4+ cells. E, effects of 1 μm (black line), 10 μm (red line), and 100 μm (green line) GC7 on CD25 fluorescence intensity in stimulated CD4+ cells.
To explore the mechanism for the reduction in T cell proliferation with DHS inhibition, we examined cell surface expression of CD25 on T cells stimulated in vitro. CD25 is the high affinity IL-2 receptor α chain that, together with the β and γ signaling chains, is important for the maximal proliferative response to IL-2. Stimulated CD90.2+ T cells were subjected to flow cytometry, gated on CD4+ cells, and examined for cell surface expression of CD25. As shown in Fig. 6, D and E, the CD25 fluorescence intensity increased upon stimulation of control cells, but increasing GC7 concentrations prevented this increase in a subpopulation of cells. The T cell incubation experiments in vitro were also subjected to immunoblot analysis. As shown in Fig. 7A and the corresponding quantitations in Fig. 7, B–D, stimulation of T cells resulted in an increase in CD25 protein levels as well as eIF5AHyp levels, without changes in total eIF5A levels (when normalized to GAPDH levels). However, with increasing doses of GC7 (10 and 100 μm), there were decreases in CD25 levels that correlated with a decrease in eIF5AHyp levels (Fig. 7, A–D). Interestingly, despite the decreasing CD25 levels observed with 1, 10, and 100 μm GC7, real-time RT-PCR revealed that levels of the mRNA encoding CD25 (Il2ra) actually increased (Fig. 7E), suggestive of post-transcriptional regulation of CD25 levels. Taken together, these results suggest that DHS inhibition reduces T cell proliferation, concomitant with impairments in hypusination and production of CD25.
FIGURE 7.

Effect of DHS inhibition on CD25 protein and Il2ra mRNA levels in vitro. Isolated mouse CD90.2+ splenocytes were stimulated in vitro with anti-CD3/anti-CD28 and IL-2 for 4 days in the presence or absence of varying concentrations of the DHS inhibitor GC7, then cell extracts were harvested for immunoblotting and RT-PCR analysis. A, immunoblots of CD25, eIF5AHyp, total eIF5A, and GAPDH protein levels (representative immunoblots from four independent experiments). B, quantitation of immunoblot band intensities for CD25 (normalized to GAPDH, n = 4). C, quantitation of immunoblot band intensities for eIF5AHyp (normalized to GAPDH, n = 3). D, quantitation of immunoblot band intensities for total eIF5A (relative to GAPDH, n = 3). E, real-time RT-PCR analysis of Il2ra mRNA (normalized to β2 microglobulin). * indicates that the value is significantly different compared with the sample containing 0 μm GC7 by one-way ANOVA.
DHS Inhibition Affects Proliferation of T Cell Subpopulations
To determine whether the block in T cell proliferation affected specific subtypes of T cells, CD90.2+ T cells stimulated in vitro were harvested and subjected to flow cytometry to determine percentages of Th1, Treg, and Th17 cell populations. As shown in Fig. 8, A–C, there was a GC7 dose-dependent reduction in the percentage of Th1 cells after 4 days stimulation, with percentages declining by 6-fold at 100 μm GC7 compared with untreated controls (Fig. 8B). These decreases were accompanied by reductions in IFN-γ release into the medium (Fig. 8C).
FIGURE 8.

Effect of DHS inhibition on Th1 and Th17 cell polarization in vitro. Isolated mouse CD90.2+ splenocytes were stimulated in vitro with anti-CD3/anti-CD28 and IL-2 for 4 days in the presence or absence of varying concentrations of the DHS inhibitor GC7, then subjected to flow cytometry. A, representative contour plots showing gating of CD4+ splenocytes (upper panels) followed by separation by IFN-γ and IL-17A staining intensities (lower panels). B, quantitation of Th1 cells (CD4+IFN-γ+) as a percentage of total CD4+ splenocytes (n = 5 independent experiments). C, levels of IFN-γ in cellular supernatant. D, quantitation of Th17 cells (CD4+IL17A+) as a percentage of total CD4+ splenocytes (n = 5). E, levels of IL-17A in cellular supernatant. * indicates that the values are significantly different from Control by one-way ANOVA.
In contrast to Th1 cells, Th17 cell percentages increased with 1 μm GC7 treatment (Fig. 8D). Corresponding IL-17A levels in the medium appeared to increase, as well, although the differences did not reach statistical significance by one-way ANOVA (Fig. 8E). Inducible nitric-oxide synthase is an enzyme that is negatively correlated with Th17 cell differentiation (29). Because GC7 inhibits iNOS production (14), we asked whether this increase in Th17 cells with GC7 treatment might be caused by inhibition of iNOS. As shown in Fig. 9, GC7 treatment blocked iNOS synthesis, thereby providing an explanation for the observed increase in Th17 cells.
FIGURE 9.
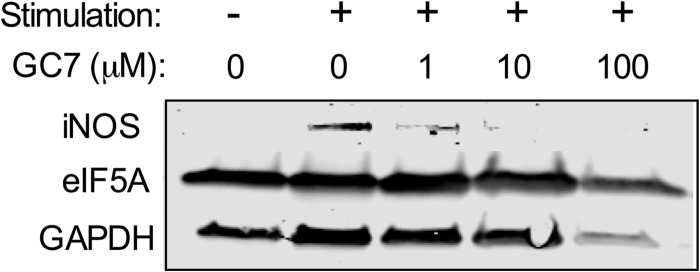
DHS inhibition in vitro impairs iNOS production in T cells. Isolated C57BL/6J mouse CD90.2+ splenocytes were stimulated in vitro with anti-CD3/anti-CD28 and IL-2 for 4 days in the presence or absence of varying concentrations of the DHS inhibitor GC7, and then cell extracts were harvested for immunoblot analysis using antibodies against iNOS, eIF5A, and GAPDH.
Finally, we examined Treg percentages. As shown in Fig. 10, A and B, frequency of Tregs increased in a dose-dependent manner with GC7 treatment (by ∼2-fold compared with untreated cells). The secretion of the Treg cytokine IL-10 into the medium also appeared to increase with GC7, although this increase did not reach statistical significance (Fig. 10C). Notably, the increase in Tregs occurred despite declining CD25 expression as a percentage of total CD4+ cells (Fig. 10, A and D). Similar results were seen in a mixed splenocyte population (data not shown).
FIGURE 10.

Effect of DHS inhibition on Treg cell polarization in vitro. Isolated mouse CD90.2+ splenocytes were stimulated in vitro with anti-CD3/anti-CD28 and IL-2 for 4 days in the presence or absence of varying concentrations of the DHS inhibitor GC7 and then subjected to flow cytometry. A, representative contour plots showing gating of CD4+ splenocytes (upper panels) followed by separation by CD25 and Foxp3 staining intensities (lower panels). B, quantitation of Treg cells (CD4+CD25+Foxp3+) as a percentage of total CD4+ splenocytes (n = 5 independent experiments). C, levels of IL-10 in cellular supernatant. D, quantitation of CD25+ cells as a percentage of total CD4+ splenocytes (n = 5). * indicates that the values are significantly different from Control by one-way ANOVA.
DISCUSSION
Studies in both humans and NOD mice suggest that the T1D disease process exhibits an early, protracted phase that is characterized by β cell dysfunction and mild hyperglycemia (5, 6, 30–33). Whether this early phase results from defects that are inherent to β cells, from stress imposed by invading immune cells or some combination of the two has remained controversial (6, 7, 34–36). Studies by our group and others have shown that β cell dysfunction in pre-T1D may emanate from ER stress (6, 7), which in turn may promote the expression of β cell neoantigens that exacerbate autoimmunity and epitope spreading (35). In this respect, interventions that mitigate β cell stress in the pre-diabetic phase may limit severity and/or progression to T1D. Here, we provide evidence that inhibition of DHS appears to protect β cell function and glycemic control during a crucial early phase of T1D.
DHS is required exclusively for the post-translational hypusination of eIF5A (37). eIF5A (and DHS) is thought to be expressed ubiquitously, with some cells (such as DCs and T cells) expressing eIF5A only during periods of stimulation or stress (15). Previous work suggests that under conditions of stress, eIF5A facilitates the nuclear export and translation of a subset of mRNAs, including mRNAs encoding iNOS and CD83 (a DC maturation marker) (13, 15, 38). Virtually all of the known functions of eIF5A (including mRNA binding, transport, and translation) appear to depend upon its hypusination (9). We have previously reported that DHS activity is at least partially required for the post-translational responses of β cells to pro-inflammatory cytokines and that inhibiting DHS (with GC7) reduces the β cell apoptosis and enhances β cell mass in a mouse model of type 2 diabetes (13, 14, 27). We therefore hypothesized in this study that DHS promotes β cell apoptosis in T1D.
To investigate the role of DHS in autoimmune diabetes, we employed the NOD mouse model, which is thought to mimic closely the pathogenesis of human T1D (4). We hypothesized that delivery of GC7 during a pre-diabetic time frame that is characterized by insulitis and β cell dysfunction would preserve β cell function and glucose tolerance. Indeed, treatment of NOD mice with GC7 resulted in improvements in insulin secretion and glucose tolerance and a reduction in islet ER stress as evidenced by reduced spliced Xbp1 message. Notably, however, these improvements were coincident with a reduction in insulitis, a finding that questions whether the apparent improvements in β cell function were direct effects of DHS inhibition in β cells versus indirect effects related to alterations in immune cell invasion. A potential role for DHS in T cell activation was previously reported by Hauber and colleagues (15), who showed that inhibition of DHS interfered with the maturation of DCs and hence their ability to activate cognate T cells. The impaired DC maturation correlated with reduced cell surface expression of CD83. We similarly observed a reduction (although not statistically significant) in median CD83 fluorescence intensity in conventional DCs in the spleens of NOD mice treated with GC7. To date, however, a direct role for CD83 in DC maturation in NOD mice has not been established. Importantly, we observed that mice treated with GC7 also exhibited reduced Th1 cells in pancreatic lymph nodes, with no changes in Th17 or Treg cell populations. On the one hand, these findings might reflect the inability of DCs in GC7-treated mice to activate Th1 cells. On the other, they might suggest a separate, direct role for DHS in T cell proliferation and/or polarization. To address the latter possibility, we performed T cell stimulation assays in vitro using anti-CD3/anti-CD28 and IL-2 incubations and fractionated CD90.2+ splenocytes to bypass DC-mediated stimulation (39). In agreement with the reductions in insulitis observed in GC7-treated mice, these studies revealed inhibition of total cellular proliferation in the presence of increasing concentrations of GC7, with a specific reduction in the proportion of Th1 cells. Additionally, increases in Treg cell proportions were observed in these assays in vitro but not recapitulated in the mouse studies; this dichotomy may reflect (i) differential effects of DHS inhibition in the models in vitro versus in vivo, (ii) insensitivity of our measurements to differences in T cell populations in the pancreatic lymph node in vivo, or (iii) our failure to select the right time window for observation of these highly dynamic T cell populations in vivo.
An important role of DHS and hypusinated eIF5A in promoting cell cycle progression has been well documented in the literature, and the mechanisms have been variably attributed to their impact upon polyamine homeostasis and/or the translation of growth-promoting mRNAs (13, 40, 41). In this study, we show that GC7 treatment reduces the cell surface expression of CD25 in a subpopulation CD4+ T cells (see Figs. 6E and 10D), likely a result of impaired production of CD25 from its encoding mRNA. CD25, the IL-2 receptor α chain, is rapidly induced in antigen-activated T cells and is required for the formation of a high affinity IL-2 receptor complex needed for maximal T cell expansion (42). Treg cells, in contrast to other T cells, exhibit a high level of CD25 expression (43). Thus, we suggest that the differential proliferative effects of DHS inhibition on Th1 and Treg populations that we observed in our studies may result from a greater dependence of Th1 cells on DHS/eIF5A for CD25 induction, whereas Treg cells are allowed to maintain or expand preferentially because of their high CD25 expression. In agreement with this perspective, a recent study suggests that Treg differentiation from CD4+CD25+Foxp3− requires IL-2 signaling (44). CD25 has proved to be an important target of inhibition in both autoimmunity and islet transplantation, as evidenced by the efficacy of CD25-blocking monoclonal antibodies (45–47). Given the known role of hypusinated eIF5A in stress-induced mRNA translation, it is tempting to speculate that translational elongation of CD25-encoding mRNA in antigen-activated T cells requires hypusinated eIF5A. Further studies are warranted to test this hypothesis.
Taken together, our studies here provide evidence for a role for DHS in the pathogenesis of T1D, specifically in naïve T cells. We report here that DHS (and eIF5A hypusination) contributes to Th1 cell proliferation, likely by promoting production of CD25. As such, the crucial balance between Th1 cells and Treg cells may be altered, favoring the immune-suppressive actions of Tregs over the immune-effector actions of Th1 cells (2). In our studies, the eventual incidence of diabetes remained unaffected, although we cannot rule out the possibility that glycemic control might have been improved. Whereas continued therapy with a DHS inhibitor past the age of 10 weeks may alter the eventual progression of disease, we favor the notion proposed by Matthews et al. (48) that combination therapies (e.g. a DHS inhibitor combined with other β cell-protective or immune-modulating agents) may result in better disease outcomes. Future studies will focus on both the impact of such combination therapies and the underlying mechanisms by which DHS/eIF5A contributes to CD25 production.
Acknowledgments
We thank N. Stull and K. Benninger in the Indiana Diabetes Research Center Islet Core for isolation of islets; B. Ulrich for technical assistance; and J.-C. Jaume (University of Wisconsin), J. Blum (Indiana University), and E. Anderson-Baucum (Indiana University) for helpful suggestions and critical reading of the manuscript.
This work was supported, in whole or in part, by National Institutes of Health Grants R01 DK60581 (to R. G. M.), F32 DK094489 (to S. C. C.), and F32 DK091976 (to D. L. M.). This work was also supported by a grant from the Juvenile Diabetes Research Foundation (to R. G. M.), an institutional Clinical and Translational Sciences Institute KL2 award (to S. A. T.), and gifts from the George and Frances Ball Foundation and the Ball Brothers Foundation (to R. G. M.).
- T1D
- type 1 diabetes mellitus
- ANOVA
- analysis of variance
- AUC
- area under the curve
- CFSE
- carboxyfluorescein diacetate succinimidyl ester
- DC
- dendritic cell
- DHS
- deoxyhypusine synthase
- eIF5A
- eukaryotic translation initiation factor 5A
- eIF5AHyp
- hypusine-50 eIF5A
- ER
- endoplasmic reticulum
- GC7
- N1-guanyl-1,7-diaminoheptane
- GTT
- glucose tolerance test
- iNOS
- inducible nitric-oxide synthase
- NOD
- non-obese diabetic
- Th1
- T helper type 1
- Treg
- T regulatory.
REFERENCES
- 1. Lehuen A., Diana J., Zaccone P., Cooke A. (2010) Immune cell cross-talk in type 1 diabetes. Nat. Rev. Immunol. 10, 501–513 [DOI] [PubMed] [Google Scholar]
- 2. Cabrera S. M., Rigby M. R., Mirmira R. G. (2012) Targeting regulatory T cells in the treatment of type 1 diabetes mellitus. Curr. Mol. Med. 12, 1261–1272 [DOI] [PMC free article] [PubMed] [Google Scholar]
- 3. Coppieters K. T., Dotta F., Amirian N., Campbell P. D., Kay T. W., Atkinson M. A., Roep B. O., von Herrath M. G. (2012) Demonstration of islet-autoreactive CD8 T cells in insulitic lesions from recent onset and long-term type 1 diabetes patients. J. Exp. Med. 209, 51–60 [DOI] [PMC free article] [PubMed] [Google Scholar]
- 4. Anderson M. S., Bluestone J. A. (2005) The NOD mouse: a model of immune dysregulation. Annu. Rev. Immunol. 23, 447–485 [DOI] [PubMed] [Google Scholar]
- 5. Ize-Ludlow D., Lightfoot Y. L., Parker M., Xue S., Wasserfall C., Haller M. J., Schatz D., Becker D. J., Atkinson M. A., Mathews C. E. (2011) Progressive erosion of β-cell function precedes the onset of hyperglycemia in the NOD mouse model of type 1 diabetes. Diabetes 60, 2086–2091 [DOI] [PMC free article] [PubMed] [Google Scholar]
- 6. Tersey S. A., Nishiki Y., Templin A. T., Cabrera S. M., Stull N. D., Colvin S. C., Evans-Molina C., Rickus J. L., Maier B., Mirmira R. G. (2012) Islet β-cell endoplasmic reticulum stress precedes the onset of type 1 diabetes in the nonobese diabetic mouse model. Diabetes 61, 818–827 [DOI] [PMC free article] [PubMed] [Google Scholar]
- 7. Marhfour I., Lopez X. M., Lefkaditis D., Salmon I., Allagnat F., Richardson S. J., Morgan N. G., Eizirik D. L. (2012) Expression of endoplasmic reticulum stress markers in the islets of patients with type 1 diabetes. Diabetologia 55, 2417–2420 [DOI] [PubMed] [Google Scholar]
- 8. Diabetes Control and Complications Trial Research Group (1998) Effect of intensive therapy on residual β-cell function in patients with type 1 diabetes in the diabetes control and complications trial: a randomized, controlled trial. Ann. Int. Med. 128, 517–523 [DOI] [PubMed] [Google Scholar]
- 9. Park M. H., Nishimura K., Zanelli C. F., Valentini S. R. (2010) Functional significance of eIF5A and its hypusine modification in eukaryotes. Amino Acids 38, 491–500 [DOI] [PMC free article] [PubMed] [Google Scholar]
- 10. Saini P., Eyler D. E., Green R., Dever T. E. (2009) Hypusine-containing protein eIF5A promotes translation elongation. Nature 459, 118–121 [DOI] [PMC free article] [PubMed] [Google Scholar]
- 11. Gregio A. P., Cano V. P., Avaca J. S., Valentini S. R., Zanelli C. F. (2009) eIF5A has a function in the elongation step of translation in yeast. Biochem. Biophys. Res. Commun. 380, 785–790 [DOI] [PubMed] [Google Scholar]
- 12. Dias C. A., Gregio A. P., Rossi D., Galvão F. C., Watanabe T. F., Park M. H., Valentini S. R., Zanelli C. F. (2012) eIF5A interacts functionally with eEF2. Amino Acids 42, 697–702 [DOI] [PMC free article] [PubMed] [Google Scholar]
- 13. Maier B., Ogihara T., Trace A. P., Tersey S. A., Robbins R. D., Chakrabarti S. K., Nunemaker C. S., Stull N. D., Taylor C. A., Thompson J. E., Dondero R. S., Lewis E. C., Dinarello C. A., Nadler J. L., Mirmira R. G. (2010) The unique hypusine modification of eIF5A promotes islet β cell inflammation and dysfunction in mice. J. Clin. Invest. 120, 2156–2170 [DOI] [PMC free article] [PubMed] [Google Scholar]
- 14. Nishiki Y., Adewola A., Hatanaka M., Templin A. T., Maier B., Mirmira R. G. (2013) Translational control of inducible nitric-oxide synthase by p38 MAPK in islet β-cells. Mol. Endocrinol. 27, 336–349 [DOI] [PMC free article] [PubMed] [Google Scholar]
- 15. Kruse M., Rosorius O., Krätzer F., Bevec D., Kuhnt C., Steinkasserer A., Schuler G., Hauber J. (2000) Inhibition of CD83 cell surface expression during dendritic cell maturation by interference with nuclear export of CD83 mRNA. J. Exp. Med. 191, 1581–1590 [DOI] [PMC free article] [PubMed] [Google Scholar]
- 16. Bevec D., Jaksche H., Oft M., Wöhl T., Himmelspach M., Pacher A., Schebesta M., Koettnitz K., Dobrovnik M., Csonga R., Lottspeich F., Hauber J. (1996) Inhibition of HIV-1 replication in lymphocytes by mutants of the Rev cofactor eIF-5A. Science 271, 1858–1860 [DOI] [PubMed] [Google Scholar]
- 17. Schlee M., Krug T., Gires O., Zeidler R., Hammerschmidt W., Mailhammer R., Laux G., Sauer G., Lovric J., Bornkamm G. W. (2004) Identification of Epstein-Barr virus (EBV) nuclear antigen 2 (EBNA2) target proteins by proteome analysis: activation of EBNA2 in conditionally immortalized B cells reflects early events after infection of primary B cells by EBV. J. Virol. 78, 3941–3952 [DOI] [PMC free article] [PubMed] [Google Scholar]
- 18. Padgett L. E., Broniowska K. A., Hansen P. A., Corbett J. A., Tse H. M. (2013) The role of reactive oxygen species and proinflammatory cytokines in type 1 diabetes pathogenesis. Ann. N.Y. Acad. Sci. 1281, 16–35 [DOI] [PMC free article] [PubMed] [Google Scholar]
- 19. Stull N. D., Breite A., McCarthy R., Tersey S. A., Mirmira R. G. (2012) Mouse islet of Langerhans isolation using a combination of purified collagenase and neutral protease. J Vis. Exp. 67, 4137. [DOI] [PMC free article] [PubMed] [Google Scholar]
- 20. Evans-Molina C., Robbins R. D., Kono T., Tersey S. A., Vestermark G. L., Nunemaker C. S., Garmey J. C., Deering T. G., Keller S. R., Maier B., Mirmira R. G. (2009) PPAR-γ activation restores islet function in diabetic mice through reduction of ER stress and maintenance of euchromatin structure. Mol. Cell. Biol. 29, 2053–2067 [DOI] [PMC free article] [PubMed] [Google Scholar]
- 21. Evans-Molina C., Garmey J. C., Ketchum R., Brayman K. L., Deng S., Mirmira R. G. (2007) Glucose regulation of insulin gene transcription and pre-mRNA processing in human islets. Diabetes 56, 827–835 [DOI] [PMC free article] [PubMed] [Google Scholar]
- 22. Lipson K. L., Fonseca S. G., Ishigaki S., Nguyen L. X., Foss E., Bortell R., Rossini A. A., Urano F. (2006) Regulation of insulin biosynthesis in pancreatic β cells by an endoplasmic reticulum-resident protein kinase IRE1. Cell Metab. 4, 245–254 [DOI] [PubMed] [Google Scholar]
- 23. Gagnon R. C., Peterson J. J. (1998) Estimation of confidence intervals for area under the curve from destructively obtained pharmacokinetic data. J. Pharmacokinet. Biopharm. 26, 87–102 [DOI] [PubMed] [Google Scholar]
- 24. Balabanov S., Gontarewicz A., Ziegler P., Hartmann U., Kammer W., Copland M., Brassat U., Priemer M., Hauber I., Wilhelm T., Schwarz G., Kanz L., Bokemeyer C., Hauber J., Holyoake T. L., Nordheim A., Brümmendorf T. H. (2007) Hypusination of eukaryotic initiation factor 5A (eIF5A): a novel therapeutic target in BCR-ABL-positive leukemias identified by a proteomics approach. Blood 109, 1701–1711 [DOI] [PubMed] [Google Scholar]
- 25. Umland T. C., Wolff E. C., Park M. H., Davies D. R. (2004) A new crystal structure of deoxyhypusine synthase reveals the configuration of the active enzyme and of an enzyme·NAD·inhibitor ternary complex. J. Biol. Chem. 279, 28697–28705 [DOI] [PubMed] [Google Scholar]
- 26. Park M. H., Wolff E. C., Lee Y. B., Folk J. E. (1994) Antiproliferative effects of inhibitors of deoxyhypusine synthase: inhibition of growth of Chinese hamster ovary cells by guanyl diamines. J. Biol. Chem. 269, 27827–27832 [PubMed] [Google Scholar]
- 27. Robbins R. D., Tersey S. A., Ogihara T., Gupta D., Farb T. B., Ficorilli J., Bokvist K., Maier B., Mirmira R. G. (2010) Inhibition of deoxyhypusine synthase enhances islet β cell function and survival in the setting of endoplasmic reticulum stress and type 2 diabetes. J. Biol. Chem. 285, 39943–39952 [DOI] [PMC free article] [PubMed] [Google Scholar]
- 28. Berchtold S., Mühl-Zürbes P., Heufler C., Winklehner P., Schuler G., Steinkasserer A. (1999) Cloning, recombinant expression and biochemical characterization of the murine CD83 molecule which is specifically up-regulated during dendritic cell maturation. FEBS Lett. 461, 211–216 [DOI] [PubMed] [Google Scholar]
- 29. Jianjun Yang, Zhang R., Lu G., Shen Y., Peng L., Zhu C., Cui M., Wang W., Arnaboldi P., Tang M., Gupta M., Qi C. F., Jayaraman P., Zhu H., Jiang B., Chen S. H., He J. C., Ting A. T., Zhou M. M., Kuchroo V. K., Morse H. C., 3rd, Ozato K., Sikora A. G., Xiong H. (2013) T cell-derived inducible nitric oxide synthase switches off TH17 cell differentiation. J. Exp. Med. 210, 1447–1462 [DOI] [PMC free article] [PubMed] [Google Scholar]
- 30. Strandell E., Eizirik D. L., Sandler S. (1990) Reversal of β-cell suppression in vitro in pancreatic islets isolated from nonobese diabetic mice during the phase preceding insulin-dependent diabetes mellitus. J. Clin. Invest. 85, 1944–1950 [DOI] [PMC free article] [PubMed] [Google Scholar]
- 31. Leiter E. H., Prochazka M., Coleman D. L. (1987) The non-obese diabetic (NOD) mouse. Am. J. Pathol. 128, 380–383 [PMC free article] [PubMed] [Google Scholar]
- 32. Ferrannini E., Mari A., Nofrate V., Sosenko J. M., Skyler J. S., and DPT-1 Study Group (2010) Progression to diabetes in relatives of type 1 diabetic patients: mechanisms and mode of onset. Diabetes 59, 679–685 [DOI] [PMC free article] [PubMed] [Google Scholar]
- 33. Keskinen P., Korhonen S., Kupila A., Veijola R., Erkkilä S., Savolainen H., Arvilommi P., Simell T., Ilonen J., Knip M., Simell O. (2002) First-phase insulin response in young healthy children at genetic and immunological risk for type I diabetes. Diabetologia 45, 1639–1648 [DOI] [PubMed] [Google Scholar]
- 34. Atkinson M. A., Bluestone J. A., Eisenbarth G. S., Hebrok M., Herold K. C., Accili D., Pietropaolo M., Arvan P. R., Von Herrath M., Markel D. S., Rhodes C. J. (2011) How does type 1 diabetes develop: the notion of homicide or β-cell suicide revisited. Diabetes 60, 1370–1379 [DOI] [PMC free article] [PubMed] [Google Scholar]
- 35. O'Sullivan-Murphy B., Urano F. (2012) ER stress as a trigger for β-cell dysfunction and autoimmunity in type 1 diabetes. Diabetes 61, 780–781 [DOI] [PMC free article] [PubMed] [Google Scholar]
- 36. Sherry N. A., Kushner J. A., Glandt M., Kitamura T., Brillantes A. M., Herold K. C. (2006) Effects of autoimmunity and immune therapy on β-cell turnover in type 1 diabetes. Diabetes 55, 3238–3245 [DOI] [PubMed] [Google Scholar]
- 37. Maier B., Tersey S. A., Mirmira R. G. (2010) Hypusine: a new target for therapeutic intervention in diabetic inflammation. Discov. Med. 10, 18–23 [PubMed] [Google Scholar]
- 38. Li C. H., Ohn T., Ivanov P., Tisdale S., Anderson P. (2010) eIF5A promotes translation elongation, polysome disassembly and stress granule assembly. PLoS ONE 5, e9942. [DOI] [PMC free article] [PubMed] [Google Scholar]
- 39. Tang Q., Henriksen K. J., Bi M., Finger E. B., Szot G., Ye J., Masteller E. L., McDevitt H., Bonyhadi M., Bluestone J. A. (2004) In vitro-expanded antigen-specific regulatory T cells suppress autoimmune diabetes. J. Exp. Med. 199, 1455–1465 [DOI] [PMC free article] [PubMed] [Google Scholar]
- 40. Nishimura K., Murozumi K., Shirahata A., Park M. H., Kashiwagi K., Igarashi K. (2005) Independent roles of eIF5A and polyamines in cell proliferation. Biochem. J. 385, 779–785 [DOI] [PMC free article] [PubMed] [Google Scholar]
- 41. Landau G., Bercovich Z., Park M. H., Kahana C. (2010) The role of polyamines in supporting growth of mammalian cells is mediated through their requirement for translation initiation and elongation. J. Biol. Chem. 285, 12474–12481 [DOI] [PMC free article] [PubMed] [Google Scholar]
- 42. Wang X., Rickert M., Garcia K. C. (2005) Structure of the quaternary complex of interleukin-2 with its α, β, and γc receptors. Science 310, 1159–1163 [DOI] [PubMed] [Google Scholar]
- 43. Sakaguchi S., Ono M., Setoguchi R., Yagi H., Hori S., Fehervari Z., Shimizu J., Takahashi T., Nomura T. (2006) Foxp3+ CD25+ CD4+ natural regulatory T cells in dominant self-tolerance and autoimmune disease. Immunol. Rev. 212, 8–27 [DOI] [PubMed] [Google Scholar]
- 44. Guo Z., Khattar M., Schroder P. M., Miyahara Y., Wang G., He X., Chen W., Stepkowski S. M. (2013) A dynamic dual role of IL-2 signaling in the two-step differentiation process of adaptive regulatory T cells. J. Immunol. 190, 3153–3162 [DOI] [PMC free article] [PubMed] [Google Scholar]
- 45. Bielekova B., Richert N., Howard T., Blevins G., Markovic-Plese S., McCartin J., Frank J. A., Würfel J., Ohayon J., Waldmann T. A., McFarland H. F., Martin R. (2004) Humanized anti-CD25 (daclizumab) inhibits disease activity in multiple sclerosis patients failing to respond to interferon-β. Proc. Natl. Acad. Sci. U.S.A. 101, 8705–8708 [DOI] [PMC free article] [PubMed] [Google Scholar]
- 46. Shapiro A. M., Lakey J. R., Ryan E. A., Korbutt G. S., Toth E., Warnock G. L., Kneteman N. M., Rajotte R. V. (2000) Islet transplantation in seven patients with type 1 diabetes mellitus using a glucocorticoid-free immunosuppressive regimen. N. Engl. J. Med. 343, 230–238 [DOI] [PubMed] [Google Scholar]
- 47. Wuest S. C., Edwan J. H., Martin J. F., Han S., Perry J. S., Cartagena C. M., Matsuura E., Maric D., Waldmann T. A., Bielekova B. (2011) A role for interleukin-2 trans-presentation in dendritic cell-mediated T cell activation in humans, as revealed by daclizumab therapy. Nat. Med. 17, 604–609 [DOI] [PMC free article] [PubMed] [Google Scholar]
- 48. Matthews J. B., Staeva T. P., Bernstein P. L., Peakman M., von Herrath M., ITN-JDRF Type 1 Diabetes Combination Therapy Assessment Group (2010) Developing combination immunotherapies for type 1 diabetes: recommendations from the ITN-JDRF Type 1 Diabetes Combination Therapy Assessment Group. Clin. Exp. Immunol. 160, 176–184 [DOI] [PMC free article] [PubMed] [Google Scholar]