

Abstract
The mechanisms by which transcription factor (TF) protein AP-1 modulates amphetamine's effects on gene transcription in living brains are unclear. We describe here the first part of our studies to investigate these mechanisms, specifically, our efforts to develop and validate aptamers containing the binding sequence of TF AP-1 (5ECdsAP1), in order to elucidate its mechanism of action in living brains. This AP-1-targeting aptamer, as well as a random sequence aptamer with no target (5ECdsRan) as a control, was partially phosphorothioate modified and tagged with superparamagnetic iron oxide nanoparticles (SPIONs), gold, or fluorescein isothiothianate contrast agent for imaging. Optical and transmission electron microscopy studies revealed that 5ECdsAP1 is taken up by endocytosis and is localized in the neuronal endoplasmic reticulum. The results of magnetic resonance imaging (MRI) with SPION-5ECdsAP1 revealed that neuronal AP-1 TF protein levels were elevated in neurons of live male C57black6 mice after amphetamine exposure; however, pretreatment with SCH23390, a dopaminergic receptor antagonist, suppressed this elevation. As studies in transgenic mice with neuronal dominant-negative A-FOS mutant protein, which has no binding affinity for the AP-1 sequence, showed a completely null MRI signal in the striatum, we can conclude that the MR signal reflects specific binding between the 5ECdsAP1 aptamer and endogenous AP-1 protein. Together, these data lend support to the application of 5ECdsAP1 aptamer for intracellular protein-guided imaging and modulation of gene transcription, which will thus allow investigation of the mechanisms of signal transduction in living brains.—Liu, C. H., Ren, J., Liu, C.-M., Liu, P. K. Intracellular gene transcription factor protein-guided MRI by DNA aptamers in vivo.
Keywords: AP1 knockout, attention, monoamine oxidase A, stress, transgenic mice
Clinical magnetic resonance (MR) images are most commonly acquired using exogenous contrast agents, such as gadolinium (Gd), a lanthanide metal, along with several candidate agents. Deoxygenated hemoglobin, an endogenous agent in biological systems, serves as a transverse relaxation time (T2) MR imaging (MRI) contrast agent, decreasing the T2 of proton spins when an external magnetic field (B0) is applied to an object. This change in T2 causes localized signal reduction in T2-weighted MR images. The change in signal reduction can also be expressed by the rate of signal change, or 1/T2* × 1000 m/s, and expressed as the effective rate of transverse relaxivity, R2* (s−1). The elevation in R2* values is positively proportional to the iron oxide content (1), and the relationship has been the fundamental basis for imaging functional aspects of neuronal activation/deactivation (2). Some, if not all, efforts to improve imaging techniques have been focused on the development of new pulse sequence, additional MR contrast agents alone or conjugates of small molecules, antibodies, and reporter genes to assist with assessment of and monitoring of the distribution of the receptor protein or stem cell migration (3, 4). The threshold concentration for detection of iron oxide nanoparticles unconjugated in the brain is 62.2 ng Fe/mm2 with a 1.5-T magnet (5). For example, iron oxide nanoparticles have been incubated with stem cells, and then the cells are injected into mice for cell tracking; however, the interpretation of such cell tracking using T2 contrast agents without targeting moiety has been cautioned (6). Seeking to develop a biocompatible contrast agent, we have linked superparamagnetic iron oxide nanoparticles (SPIONs; ref. 7) or cross-linked iron oxide nanoparticles (8) to short DNA aptamers that would allow MRI of endogenous and naturally occurring RNA; this approach reports endogenous genetic information (mRNA transcripts) with a positive proportionality to mRNA copy number by TaqMan analysis (9). We now use this approach to provide new capabilities to investigate AP1 transcription factor (TF) proteins in living mice, with clear advantages over current methods based on the use of crude cell extracts.
The AP-1 TF, a heteroduplex protein comprising members of the Fos and Jun immediate early gene families, plays an essential role in modifying gene expression by signal transduction. However, the mechanism by which AP-1 TF modulates the expression of the monoamine oxidase gene is not clear. Intracellular TF proteins are routinely detected by immunohistochemistry or gel shift analysis in ex vivo tissue samples. To better understand the effect of AP-1 TF on signal transduction in living tissue, we took an alternative approach of generating a double-stranded (ds) DNA aptamer with consensus sequences for the AP-1 binding site, along with control aptamers for nuclear protein κ of β cells (NF-κβ). In this first part of our studies, we labeled these aptamers with various MR and optical imaging contrast agents to track delivery, and to reveal the location of TF protein expression in the mesolimbic pathway in 2 mouse strains with wild-type and mutant AP-1 proteins (10). Our findings lend support to the effect of AP-1 TF protein on the effect of amphetamine on gene transcription modulation and abnormal motor activities in live mice in the second part of this study.
MATERIALS AND METHODS
Animals and housing
All of the procedures used in this study were approved by the Massachusetts General Hospital Subcommittee on Research Animal Care, the institutional animal welfare committee, in accordance with the U.S. Public Health Service Guide for the Care and Use of Laboratory Animals. Adult male mice, 2 to 3 mo of age (23±2 g body weight), were kept in cages with sawdust bedding, in a room with controlled light cycles (12 h light/12 h dark). All animals had free access to water and were fed standard lab chow. Mice were trained, operated on, and tested in a randomized manner; an observer performed the behavioral testing in a blinded procedure.
In addition to studying C57black6 male mice (Taconic Farm, Germantown, NY, USA; ref. 9), we also studied a double-transgenic mouse strain (NSE-tTAXTetOp-A-FOS), a generous gift from Dr. C. Vinson (National Cancer Institute, Frederick, MD, USA). This mutant strain is the offspring of 2 different transgenic parents, one of which contains a genetically altered A-FOS protein with higher affinity for the host Jun protein compared to the wild-type Fos protein (10, 11).
Short dsDNA for AP1 binding protein
We used dsDNA containing a consensus sequence (denoted by uppercase letters) for AP1 protein [5′-fluorecein isothiocyanate (FITC)-tccggcTGACTCAtcaagcg-3′ and 3′-aggccgACTGAGTagttcgc-biotin-5′], which we modified by phosphorothioation by replacing a nonbridging oxygen with sulfur on the phosphate linkages of 3, 4, or 5 nucleotides (lowercase letters) from both ends [end caps (ECs)]. We also synthesized 5ECdsDNAs for the transcription factors SP1 (5′-ctcgcCCCGCCccgatcgaa-biotin and 3′-gagcgGGGCGGggctagctt); NF-κβ (5′-gttgaGGGGACTTTCCcagg-biotin and 3′ caactCCCCTGAAAGGgtcc); and CREB (5′-ctctcTGACGTCAggcaat-biotin and 3′-gagagACTGCTGTccgtta) as controls. Both strands of the TF binding sequences were mixed at room temperature (we found thatt heating the mixture at 65°C for 5 min did not destroy biotin on biotinylated DNA). We then placed the mixture in a thermocycler programmed to heat the mixture at 65°C for 5 min and then slowly cool it (1°/min) to 20°C, at which temperature the mixture was maintained for 30 min. Short dsDNAs were stored in aliquots of 0.05 ml (100 μM) at −20°C. At 1 h before use, one aliquot was thawed to room temperature, and duplicates of dsAP1 (50 pmol) were removed and incubated with recombinant human AP1 protein (3 footprint units) in manufacturer's buffer, on ice, for 30 min. The complex was resolved by gel electrophoresis (12). FITC-dsDNA, which targets NF-κβ protein, and single-stranded FITC-AP1 DNA were used as controls. We obtained photographs at 495 and 521 nm (excitation and emission spectrum peak wavelengths, respectively) using an Imager Chem Q (Alpha Innotech, San Leandro, CA, USA).
Delivery of Au- or SPION-dsAP1
We synthesized NeutrAvidin (NA)-labeled SPIONs using the protocol previously published (13), which was conjugated with biotinylated aptamer (3 pmol dsDNA/μg SPION-NA) by mixing 16 h before administration and kept at 4°C. We anesthetized the mice with pure O2 plus 2% halothane at a flow rate of 800 ml/min and delivered AP1 DNA by intracerebroventricular (i.c.v.) injection, an accepted method for administering contrast agents to rodents and nonhuman primates (14–16). We administered a dose of 40 μg Fe/kg or 120 pmol DNA/kg for imaging studies (17, 18). In mice that had undergone blood-brain barrier (BBB) bypass 1 wk earlier, we delivered Au- or SPION-dsDNA using a less invasive intraperitoneal (i.p.) injection method, so as to reduce potential background caused by conducting the invasive i.c.v. procedure on the same day as MRI.
In the BBB bypass group, we administered an i.c.v. injection of 2 μl of saline (icv) 1 wk before MRI; the BBB remained open, allowing i.p. delivery of SPION-aptamer (4 mg Fe/kg or 12 nmol/kg) for an additional 2 wk after the procedure. On the day of MRI acquisition, we delivered Au-dsAP1, SPION-dsAP1, or a control [SPION-dsNFκβ, Au-StrAvidin (SA), or SPION-NA] to awake mice, and 3 h later injected amphetamine.
Intracellular location of dsAP1 by transmission electron microscopy (TEM)
We labeled 3′ biotinylated dsAP1 with SPION-NA at a ratio of 3 pmol dsAP1 to 1 μg SPION-NA; for validation purposes, we also labeled dsAP1 with Au-StratAvidin (Invitrogen, Carlsbad, CA, USA),. Normal mice with SPION-NA (or Au-SA) served as the control group; both groups were treated with amphetamine 3 h after delivery. In a double-blinded design, all tissue specimens were prepared and examined by two independent pathology laboratories. At least 4 samples were obtained from each brain, and each laboratory received 2 adjacent brain slices (0.5 mm in thickness).
Two adjacent brain slices from the nucleus accumbens (NAc) of each mouse were obtained and quickly submerged in 2.5% buffered glutaraldehyde; the specimens were then hand-delivered (on ice) for processing at the TEM laboratory of the Pathology Service at Massachusetts General Hospital. One brain slice was not stained; in this case, Au-dsAP1 was the only electron microscopy (EM)-visible tracer. The other specimen was stained with 1% osmium tetroxide (2 h). The cells were dehydrated in ascending concentrations of ethanol, immersed in propylene oxide, and embedded in Epon 812 resin (Agar Scientific Ltd., Standstead, UK). The samples were cut into ultrathin sections (∼60 nm), which were contrasted with 4% uranyl acetate and Reynold's lead citrate, and examined with a Philips Morgagni 268 transmission electron microscope (Philips, Amsterdam, The Netherlands). The neuronal nucleus was identified as a smooth, round nuclear body with a diameter of ∼7 μm.
Another set of samples was transferred for TEM sample preparation to the Histology Core Facility of the Systems Biology Division at Massachusetts General Hospital. The preparation and data acquisition were performed in a blinded procedure, and the samples were identified with a code. To reduce background staining from osmium, we treated the samples with 2% aqueous uranyl acetate for 5 min (19). The coded photographs were delivered to and decoded by the senior principal investigator.
FITC-dsAP1 uptake
Brain samples were obtained 4 h after saline or amphetamine administration and frozen by slow cooling with liquid nitrogen. Slices of brain tissue (25 μm in thickness) were stained with antibodies against glial fibrillary acidic protein (GFAP; ab7260, Abcam, Cambridge, MA, USA) for astroglia, and treated with 0.5% Hoechst stain for nucleic acids, following a previously published protocol (15). All photographs were obtained with the same exposure time, using a Retiga EXi camera (QImaging, Surrey, BC, Canada) on an Olympus microscope (Optical Analysis Corp., Nashua, NH, USA).
MRI for DNA-protein interaction in vivo
We statistically analyzed SPION retention in various regions of interest (ROIs) after SPION-dsAP1 administration. For MRI, one type of SPION probe was administered to each treatment group of 3 mice; T2*-weighted MRI scans were acquired before and at 4 h after amphetamine. This protocol of MRI acquisition was repeated to achieve a sample size as determined by a post hoc power analysis. Because R2* values above baseline are positively proportional to iron concentration (1), we compared R2* maps in all MR scans in the regions contralateral to the i.c.v. hemisphere, where R2* is the rate of signal reduction (R2* = 1/T2* ms × 1000; s−1). R2* maps were generated from multiple-echo time (TE) MR images [repetition time (TR)=500 ms; TE=3, 4, 6, 8, 10 ms], which were aligned using the jip analysis toolkit (http://www.nmr.mgh.harvard.edu/∼jbm/jip/), and the percentage increase above the pre-i.p. injection baseline R2* maps was computed and shown as ΔR2*, i.e., (R2*post-i.p. − R2*pre-i.p.)/R2*pre-i.p. × 100%. Any R2* values above the baseline R2* were shown in color scale as percentage increase. A post hoc power analysis was used to compute the necessary sample size to avoid type II error for SPION-actin uptake at each time point (P=80% at α=0.05). The noise in the ROI comes from the background before contrast agent delivery; therefore, the R2* of pre-SPIONs is the background. The contrast-to-noise ratio was determined by dividing the average R2* post-SPIONs by the square root of the sd of pre-SPION R2* values from the same ROI.
Statistical analysis (MRI)
Once we had obtained the first MRI data set, we calculated the number of animals needed in each group to achieve 95% power for a value of P = 0.01 (15, 20). We computed the means ± sem from the average values in each group of animals and compared the statistical significance of these values using a t test (1-tail, type II, or equal variant; GraphPad Prism IV, GraphPad Software, San Diego, CA, USA). A value of P < 0.05 was statistically significant (15).
RESULTS
5ECdsAP1binds to AP-1 protein
To detect AP-1 protein in living mice, we designed several 20-bp aptamers with the same consensus sequences for AP-1, replacing 3, 4, or 5 phosphate linkages from each end of the aptamers with phosphorothioate linkage (denoted as 3, 4, 5 or all ECs, i.e., 3EC, 4EC, 5EC, or full phosphorothioation, respectively) to protect the DNA aptamers from nucleases and to reduce nonspecific protein binding. In addition to the AP-1-targeting aptamers, we included 1 random sequence aptamer (5ECdsRan) with no protein target. All dsAP1 aptamers with these modifications bind to recombinant human (rh) AP-1 protein in the presence of 0.5 and 5 mM dithiothreitol (DTT). We found that the binding level of 5ECdsAP1 was most consistent at the 0.5 mM DTT level (Fig. 1A). Because the low concentration of DTT might represent intracellular conditions, we chose to use 5ECdsDNA for all tests. The specificity of 5ECdsAP1 for AP1 protein was demonstrated by its not binding to NF-κβ protein (Fig. 1B).
Figure 1.
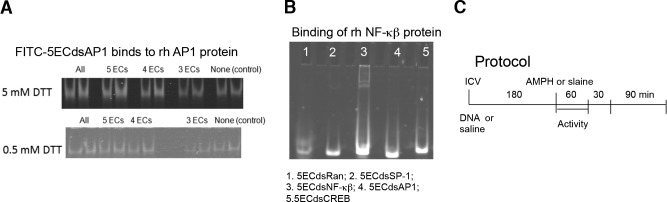
Aptamer affinity. A) We tested the in vitro binding of dsAP1 aptamers with various ECs to rh AP1 protein in the presence of 5 or 0.5 mM of DTT. B) Specificity of all aptamers for the rh NF-κβ protein by traditional gel shift assays. C) Protocol times for our studies.
Neurons take up and retain 5ECdsAP1
To demonstrate the uptake and retention of 5ECdsAP1 in vivo, we labeled 5ECdsAP1 aptamer with FITC for optical microscopy, SPIONs for MRI, or Au nanoparticles for TEM to determine the uptake and cellular distribution of the aptamer. We predicted that neurons would take up 5ECdsAP1 at an elevated level when neurons were stimulated by amphetamine. We delivered FITC-5ECdsAP1 (120 pmol aptamer/kg, i.c.v. injection) to 2 groups of C57black6 mice (n=4/group), which we then treated with either saline (control) or amphetamine 3 h later (see protocol outlines in Fig. 1C); brain samples were collected 1 h after amphetamine administration. We observed FITC-dsAP1 signal in all mice, regardless of treatment with saline (Fig. 2A–D) or amphetamine (Fig. 2E–H); however, the signal was noticeably stronger in mice treated with amphetamine (Fig. 2E) than those that received saline (Fig. 2A). This signal appeared to be localized in GFAP-null cells (Fig. 2D vs. H), with the majority of the FITC signal appearing around the nucleus (Fig. 2I). Fully stained samples from mice that were administered SPION-5ECdsAP1 (40 μg Fe/kg, i.c.v. injection, n=2 each), TEM examination did not reveal conclusive evidence of uptake (Fig. 3A). However, we did find electron-dense nanoparticles (EDNs) as evidence of intracellular SPIONs near the nucleus in partially stained samples (Fig. 3B). Moreover, although we detected EDNs near the perivascular space (Fig. 3C), we found no EDNs in the capillary lumen in brain samples collected after i.c.v. delivery of SPION-5ECdsAP1. Most significantly, we noted the presence of EDNs near and within the outlines of the endoplasmic reticulum (ER) in brain samples collected after Au-5ECdsAP1 injection (40 μg Au/kg, i.c.v. injection, n=2 each; Fig. 3D). In samples not stained with lead, we found EDNs in the cytoplasm near the nuclei (Fig. 3E). Consistent with the optical microscopy results shown in Figs. 2 and 3, EDNs were located in the neurons. This important evidence of aptamer uptake and distribution was as we expected, which therefore allowed us to ask whether SPION-5ECdsAP1 allows contrast-enhanced MR imaging of intracellular AP-1 protein.
Figure 2.

Uptake and distribution of aptamers. To examine for cell-specific uptake of AP-1 aptamer, we delivered FITC-5ECdsAP1 (120 pmol/kg, i.c.v. injection). We then administered saline (SAL; A–D) or amphetamine (AMPH; 4 mg/kg, i.p. injection; E–I) 3 h later (n=2 each); frozen brain samples were obtained 4 h after saline or amphetamine (15). A, E) Brain tissue was stained for FITC-5ECdsAP1 detection. B, F) Brain tissue was stained for nuclei detection. C, G) Brain tissue was treated with fresh 4% paraformaldehyde to label GFAP expressed by astroglia [Cy3-labeled antibodies against GFAP (ab7260; Abcam), and Hoechst (purple) stain for nucleic acids]. D, H) Merged images. I) FITC-5ECdsAP1 was located near the neuronal nuclei (∼10 μm in diameter) stained with propidium iodide. Scale bar = 10 μm.
Figure 3.

Subcellular distribution of aptamers: SPION-5ECdsAP1 or AU-5ECdsAP1 was delivered at a dose of 40 μg Fe/kg (A–C) or 40 μg Au/kg (D–E), i.c.v. injection). We administered amphetamine (n=2 each) as described in Materials and Methods; at 4 h after delivery, we obtained brain samples from the NAc and, in preparation for TEM, fixed the tissue for full staining (A) as well as for staining without osmium and uranyl acetate (B–D) and lead (E), as described in Materials and Methods. Arrows in panels B and D show that several EDNs were identified in the ER, at the site of protein translation. Arrows in panels D and E show that EDNs are not artifacts related to the lead stain. G, glia; N, neuronal nucleus based on diameters.
AP-1 protein-guided MRI in vivo
Amphetamine is known to cause a temporary increase in blood flow within 2 h of exposure; so as to avoid potential noise resulting from this blood flow increase, we waited 4 h after the amphetamine injection to acquire the MR images (Fig. 4A). The 4 h wait time improves TF AP-1 measurements, as the cells exclude excess and unbound aptamer during this 4 h window (9).
Figure 4.

Target-guided MRI with SPION-5ECdsAP1 (40 μg Fe/kg or 120 pmol dsAP1/kg, i.c.v. injection). A) MRI acquisition protocol and data processing methods. B) Increase in MR signal intensity in subtraction R2* maps. C–E) Frequency of the drop in MRI signal (R2* or 1/T2* ms × 1000) is shown as percentage increase in ΔR2* maps in 3 groups of mice: saline (SAL) vs. amphetamine (AMPH) (C), or SCH23390 vs. AMPH (D, E). Bar graphs show means ± sem (t test, vs. SAL controls) for SPION retention in various ROIs in live brains following SPION-5ECdsAP1. F) Anatomic ROIs from which we obtained MRI data.
In normal (saline-treated) brains, we observed very little change in R2* as a result of SPION-5ECdsAP1 retention (Fig. 4B, top panels); however, in brain regions that make up the reward pathway and its projections [the NAc, striatum (CPu, caudate putamen), medial prefrontal cortex (mPFC), and somatosensory cortex (SSC), as outlined in Fig. 4F] we found significant signal elevations following amphetamine administration (Fig. 4B, bottom panels). We did not detect an increase in the MR signal in the hippocampus regions, in either saline or amphetamine-treated brains (Fig. 4C HIPPO). Pretreatment with the D1/D5 receptor antagonist SCH-23390 (0.1 mg/kg, s.c. injection) suppressed the amphetamine-associated increase in AP-1 (Fig. 4D, E), indicating that signal transduction mediates AP-1 activity in brain regions similar to those previously observed in the mesolimbic pathway. We note that although several other ROIs (i.e., areas within the motor and retrosplenial cortices and cerebellum, as shown in Fig. 5) showed signal increases, these areas were small, and may reflect air-surface noise. Although these data represent the first detection of TF expression in vivo, it is important to determine whether the observation can be substantiated to support our hypothesis of AP-1 TF binding.
Figure 5.
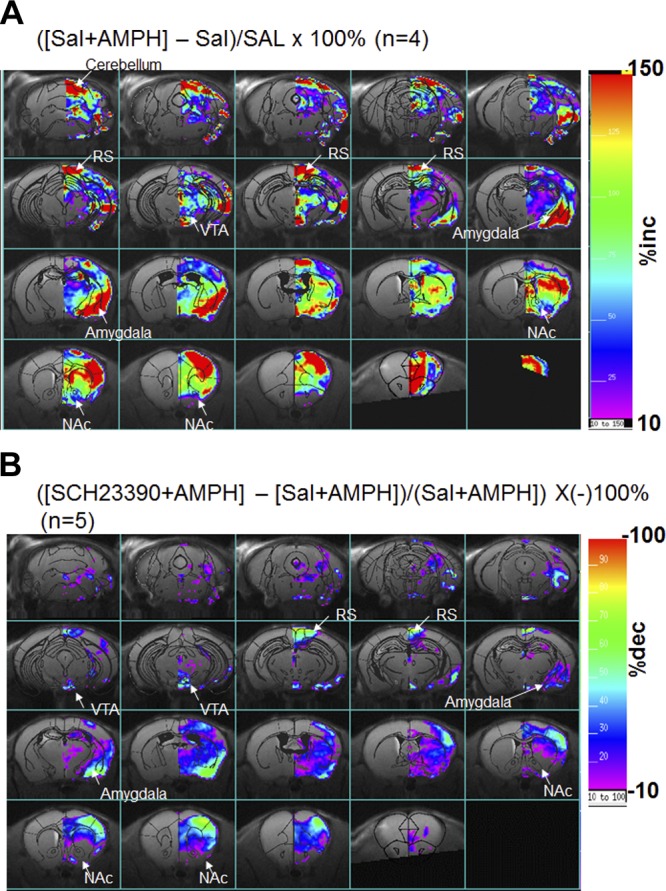
Distribution of SPION-5ECdsAP1 in living brains. Subtraction maps of AP-1 TF protein-guided whole-brain MRI after 1 typical treatment of amphetamine vs. saline (A) or SCH23390 with AMPH vs. saline with AMPH (B).
5ECdsAP1-guided MRI
To confirm that the increase in R2* reflects binding between AP-1 protein and SPION-5ECdsAP1 aptamer, we compared the retention profiles of SPION-5ECdsAP1 and SPION-5ECdsNFκβ in double-transgenic mice (NSE-tTAXTetOp-A-FOS) that are engineered to express mutant AP-1 TF. We hypothesized that in this double-transgenic mouse strain, SPION-5ECdsAP1 binding (as measured by the R2* level in the MRI data) would be less than that of SPION-5ECdsNF-κβ. For this purpose, it was important to measure longitudinal binding of both AP-1 and NFκβ in the same double-transgenic mice. We have demonstrated in C57black6 mice that the i.c.v. procedure disrupts the BBB, which remains open for a period of up to 3 wk. With the BBB open, we can use i.p. injection to introduce the SPION-DNA probes and to investigate probe retention and, hence, their ability to report gene expression in longitudinal MRI.
SPION-5ECdsAP1 uptake by endocytosis in the perivascular space
To initiate BBB bypass, we used a Hamilton syringe (Hamilton, Reno, NV, USA) with a 22-gauge needle to inject saline (2 μl, i.c.v. injection) into the cerebrospinal fluid in the cerebral ventricle; the opening was sealed with bone wax. After 1 wk, we acquired baseline MRI data and then administered SPION-5ECdsAP1 (4 mg Fe/kg or 12 nmol DNA/kg, i.p. injection). The measurements made at baseline (preinjection) and 2 and 4 h after i.p./i.c.v. delivery showed a gradual and uniform elevation in R2*, which spread from the NAc and ventral CPu of the left hemisphere (ipsilateral to the BBB bypass site) to the right (contralateral) hemisphere (Fig. 6A). We also found that 4 h after SPION-5ECdsAP1 delivery, contrast-to-noise ratio increased 4-fold from the baseline measurement. The global distribution of the probe seen from 2 to 4 h after the delivery of most SPION-DNA, with R2* returning to preinjection levels. TEM showing intracellular EDNs in brain samples from the NAc in the contralateral hemisphere confirmed SPION-5ECdsAP1 uptake after i.p./i.c.v. delivery. Figure 6B shows several EDNs near a small vessel; 2 naked EDNs, i.e., not enclosed by membrane, were attached to the perivascular wall opposite the basement membrane (these EDNs are indicated by the broken arrows in Fig. 6B, left panel). We noted that 1 EDN appeared to be in the process of transporting across the membrane (shown by the thick solid arrow in the top region of Fig. 6B, left panel), and 3 other EDNs appeared to be enclosed by membrane (Fig. 6B, left panel, asterisks); these membrane-enclosed EDNs support the association of AU-5ECdsAP1 with the ER and are indicators of endocytosis. The distribution of EDNs in the perivascular space was confirmed by EM examination of partially stained samples, in which the membrane exhibited less staining (Fig. 6C). We observed no EDNs in samples obtained from normal brains (not shown).
Figure 6.

Binding specificity of SPION-5ECdsAP1 (4 mg Fe/kg or 12 nmol dsAP1/kg, i.p./i.c.v. injection). A) Homogenously elevated R2* values measured before (Pre), as well as 2 and 4 h after delivery of SPION-5ECdsAP1. B, C) EDNs were detected in the perivascular space by TEM under full stain (B) as well as under partial stain (C). Solid arrow in panel B (left image) indicates an EDN transporting across the membrane; broken arrows indicate naked EDNs; asterisks indicate EDNs enclosed by membrane. Arrow in panel C inset indicates END from artifacts. D) Representative aptamer uptake for SPION-5ECdsAP1 in C57black6 mice (n=2 each; panels 1 and 2) or SPION-5ECdsAP1 or SPION-5ECdsNF-kb in double-transgenic A-FOS mutant mice (n=3; panels 3 and 4) is shown as ΔR2* maps; increase is calculated according to the result shown in Fig. 5A. E) Signal increase of SPION-5ECdsAP1 in the striatum, shown in panel D; this ROI is defined in panel A. Difference in striatal ΔR2* of panel D3 and SPION-5ECdsRan above the baseline was not significant.
Specificity of SPION-5ECdsAP1 binding using a dominant-negative mutant mouse strain
We compared the ΔR2* maps obtained from the same C57black6 mice after i.c.v. or i.p./i.c.v. delivery of SPION-5ECdsAP1, according to the protocol illustrated in Fig. 4A. ROI analysis in the striatum contralateral to the site of BBB bypass revealed no significant difference between the two ΔR2* maps (Fig. 6D1, 2). However, with the exception of the ventricles, probe uptake was more homogeneous after i.p./i.c.v. delivery, than after i.c.v. delivery, suggesting that i.p./i.c.v. delivery is more compatible for longitudinal MRI detection of different targets in the same mice. Similar ROI analysis in the striatum showed no retention in the double-transgenic A-FOS mice (Fig. 6D3, E); in comparison, the C57black6 mice exhibited significant elevation in SPION-5ECdsAP1 retention at the 4 h time point (Fig. 6D2, E). Whereas the A-FOS strain exhibited no SPION-5ECdsAP1 retention in the striatum, there was a slight increase in SPION-5ECdsAP1 in the cortex (Fig. 6D3). However, the double-transgenic strain did exhibit an overall elevation in ΔR2* in response to SPION-5ECdsNFκβ (Fig. 6D4). We observed that there was no significant difference in striatal uptake of SPION-5ECdsAP1 in the mutant strain; the low-level uptake can be compared to C57black mice that received nontargeting SPION-dsRan (Fig. 6E). Our results indicate that SPION-5ECdsAP1 binds to AP1 TF in vivo. Together. these data lead us to conclude that 5ECdsAP1 aptamer targets endogenous AP1 TF protein; aptamer targeting MRI reflects intracellular TF AP-1 protein in vivo. Moreover, MRI by this aptamer can monitor changes in TF AP-1 protein in living brains (Fig. 7).
Figure 7.

Mechanism of molecular MRI for intracellular TF proteins. A) The 3 major components of the nanoparticle-dsDNA aptamer: short dsDNA aptamer, avidin-biotin linkage or direct linkage, and MR contrast agent or microscopy agent. B) Proposed endocytosis pathway of DNA-mediated nanoparticle uptake. C) Once internalized, DNA aptamer binds to TF protein, whereby the nanoparticles remain within the unique cells that express the TF protein. C1–C3) Potential applications after target binding. D) If dsDNA does not bind to TF protein, the nanoparticles are excluded from the cell, and no image data can be acquired (Fig. 6D3). When the dose is sufficient to compete for intracellular TF protein, modulation by the TF protein is prevented (C3).
DISCUSSION
To examine the molecular mechanism underlying TF AP-1 modulation of monoamine oxidase A expression after amphetamine exposure, we developed a new targeted imaging technique to detect intracellular TF protein in neurons of living mouse brains. We have demonstrated the genetic events in living brains by introducing a bioengineered dsAP1 aptamer tagged with 3 different labels for MRI, optical imaging, and TEM. The evidence we have acquired demonstrates that our approach has some potential for multimodal in vivo (MRI) and ex vivo (microscopy) imaging. This evidence is further supported by complementary results in the double-transgenic A-FOS mouse strain, which lacks striatal functional TF AP-1 protein; this mutant retains SPION-5ECdsNFκβ (Fig. 6D4) but not SPION-5ECdsAP1 in the striatum (Fig. 6D3). Our in vivo results are consistent with the pattern of mutant A-FOS mRNA expression, which in this double-mutant strain is high in the striatum but low in the cortex (10). Therefore, the double-stranded AP-1 aptamer effectively binds to intracellular AP-1 protein in vivo. The results support the notion that our 5ECdsAP1 aptamer specifically guides the delivery of SPION or Au nanoparticles or FITC dyes to the intracellular AP-1 protein to enable multimodal detections.
As we observed using TEM, the presence of EDN clusters in the perivascular space during uptake confirms our earlier observations using Prussian blue staining (13) and similar TEM observations others have reported (21). Furthermore, the presence of SPION- or Au-5ECdsAP1 in the ER supports the role of membrane associated uptake by endocytosis as a mechanism of DNA uptake and retention (22). Because the rough ER is located in the perinuclear region, the observations we report in Fig. 2I support both our previous optical microscopy observations of iron core (Prussian blue staining) and FITC-DNA as intracellular punctates (15, 20). Our observation of 5ECdsAP1 localized near the ER, but absent in other parts of the cytoplasm, is important because it shows that the aptamer has functional specificity at the site of protein translation in the ribosomes. This physical evidence provides support for a mechanism of TF protein trafficking in vivo. The association between dsAP1 and ER inside the cytoplasm indicates that these clusters are not vesicles in the synapses or lysosomes. By identifying SPION-dsAP1 near the ER, we have demonstrated an innovative subcellular TF protein-guided drug delivery method that warrants future investigation for in vivo MRI studies of molecular trafficking and DNA-protein interaction during signal transduction and epigenetic events.
By linking SPIONs to phosphorothioate-modified DNA, the net charge on SPION-sODN is changed; this change enables SPION-sODN to interact with positive charges on the cell surface, and thus facilitates uptake by endocytosis (23). We have shown that at the optimal dose (40 μg/kg, i.c.v. injection), retention plateaus at 4–6 h, and then the uptake begins to decline. These properties are the same for uptake and distribution of SPION-cfos (13), SPION-actin (18), and SPION-gfap (9). Binding of 5ECdsAP1 to TF AP1 can prevent the exclusion of bound SPION or Au labels in cells that express TF AP1 protein, especially at the low doses used in our studies (13). Indeed, the distribution of SPION-sODN is uniform in the hemisphere contralateral to the i.c.v. port, and 4–6 h after i.c.v. delivery (9), or combined i.p. delivery and i.c.v. BBB bypass (i.p./i.c.v.), shows a sufficient signal-to-noise ratio of >3 (18).
Our previous studies have demonstrated the successful delivery of SPION-sODN to endogenous mRNA transcripts (24). Now we show that the same approach can be used to detect transcription factor proteins in live mice. If an average mouse has a body weight of 25 g and an average brain volume of 1000 mm3, our dose of 40 μg Fe/kg represents a threshold of 1.0 ng/mm3; this is a significant improvement over previous reports (25). We have also improved the detection of SPION-ODN for monitoring a cohort of cells (cell typing) in vivo to a resolution of 0.03 mm3 (0.06 mm2 in 0.5-mm slices) (17).
Furthermore, we have delivered the contrast agents using cortical puncture and BBB bypass. Although invasive, cortical puncture, which directly bypasses the BBB, is a clinically acceptable method for delivery of therapeutic agents. Mouse models have been used to investigate the neural response to amphetamine in preclinical studies to develop new treatment approaches for attention deficit disorder, major mood disorder, and/or bipolar disorder, as well as for drug abuse and Parkinson's disease (26, 27). Acute stress, characterized by anxiety (insomnia, irritability, poor concentration, motor restlessness), among other human conditions, can be experimentally induced in animals (28, 29) in which elevations of AP-1 proteins have been reported. Given that MRI is a noninvasive procedure and clinically approved method of detection, we anticipate that this technique will have potential for real-time and longitudinal research, as well as preclinical and clinical applications. We will demonstrate that 5ECdsAP1 aptamer could modulate the expression of monoamine oxidase A transcription and improved abnormal stress-like behavior induced by amphetamine (30). When 5ECdsAP1 becomes a therapeutic agent that may modulate intracellular gene expression, it should have the translational potential for our approach.
Acknowledgments
The authors thank Dr. M. Schwartzchild for allowing them to use the locomotion detection device. The authors also thank Dr. C. Vinson (National Cancer Institute, Frederick, MD, USA) for use of the double-transgenic A-FOS mutant mouse strain, Dr. H. Prentice for reading and critical evaluation, and Ms. N. Eusemann for assistance with editing the manuscript.
The authors appreciate the help of M. McKee with TEM and the availability of the Massachusetts General Hospital Microscopy Core [supported by U.S. National Institutes of Health (NIH) grants R01DK43351 and R01DK57521]. This project was supported by research grants from the National Institute on Drug Abuse (R01DA029889), the National Institute of Biomedical Imaging and Bioengineering (R01EB013768), and the National Center for Alternative Medicine (AT004974) of the NIH.
Footnotes
- BBB
- blood-brain barrier
- ds
- double stranded
- EC
- end cap
- CPu
- caudate putamen
- DTT
- dithiothreitol
- EDN
- electron-dense nanoparticle
- EM
- electron microscopy
- ER
- endoplasmic reticulum
- FITC
- fluorescein isothiocyanate
- GFAP
- glial fibrillary acidic protein
- i.c.v.
- intracerebroventricular
- i.p.
- intraperitoneal
- MR
- magnetic resonance
- MRI
- magnetic resonance imaging
- NA
- NeutrAvidin
- NAc
- nucleus accumbens
- NF-κβ
- nuclear protein κ of β cells
- rh
- recombinant human
- R2*
- effective rate of transverse relaxivity
- ΔR2*
- effective rate of transverse relaxivity above baseline
- ROI
- region of interest
- SA
- StrAvidin
- SPION
- superparamagnetic iron oxide nanoparticle
- TEM
- transmission electron microscopy
- T2
- transverse relaxation time
- TF
- transcription factor
REFERENCES
- 1. Boxerman J. L., Hamberg L. M., Rosen B. R., Weisskoff R. M. (1995) MR contrast due to intravascular magnetic susceptibility perturbations. Magn. Reson. Med. 34, 555–566 [DOI] [PubMed] [Google Scholar]
- 2. Sorensen A. G., Wray S. H., Weisskoff R. M., Boxerman J. L., Davis T. L., Caramia F., Kwong K. K., Stern C. E., Baker J. R., Breiter H., Gazit I. E., Belliveau J. W., Brady T. J., Rosen B. R. (1995) Functional MR of brain activity and perfusion in patients with chronic cortical stroke. Am. J. Neuroradiol. 16, 1753–1762 [PMC free article] [PubMed] [Google Scholar]
- 3. Bulte J. W., Arbab A. S., Douglas T., Frank J. A. (2004) Preparation of magnetically labeled cells for cell tracking by magnetic resonance imaging. Methods Enzymol. 386, 275–299 [DOI] [PubMed] [Google Scholar]
- 4. Högemann D., Josephson L., Weissleder R., Basilion J. P. (2000) Improvement of MRI probes to allow efficient detection of gene expression. Bioconjug. Chem. 11, 941–946 [DOI] [PubMed] [Google Scholar]
- 5. Zimmer C., Weissleder R., O'Connor D., LaPointe L., Brady T. J., Enochs W. S. (1995) Cerebral iron oxide distribution: in vivo mapping with MR imaging. Radiology 196, 521–527 [DOI] [PubMed] [Google Scholar]
- 6. Berman S. C., Galpoththawela C., Gilad A. A., Bulte J. W., Walczak P. (2011) Long-term MR cell tracking of neural stem cells grafted in immunocompetent versus immunodeficient mice reveals distinct differences in contrast between live and dead cells. Magn. Res. Med. 65, 564–574 [DOI] [PMC free article] [PubMed] [Google Scholar]
- 7. Lind K., Kresse M., Debus N. P., Müller R. H. (2002) A novel formulation for superparamagnetic iron oxide (SPIO) particles enhancing MR lymphography: comparison of physicochemical properties and the in vivo behaviour. J. Drug Target. 10, 221–230 [DOI] [PubMed] [Google Scholar]
- 8. Ichikawa T., Högemann D., Saeki Y., Tyminski E., Terada K., Weissleder R., Chiocca E. A., Basilion J. P. (2002) MRI of transgene expression: correlation to therapeutic gene expression. Neoplasia 4, 523–530 [DOI] [PMC free article] [PubMed] [Google Scholar]
- 9. Liu C. H., Yang J., Ren J. Q., Liu C. M., You Z., Liu P. K. (2013) MRI reveals differential effects of amphetamine exposure on neuroglia in vivo. FASEB J. 27, 712–724 [DOI] [PMC free article] [PubMed] [Google Scholar]
- 10. Paletzki R. F., Myakishev M. V., Polesskaya O., Orosz A., Hyman S. E, Vinson C. (2008) Inhibiting activator protein-1 activity alters cocaine-induced gene expression and potentiates sensitization. Neuroscience 152, 1040–1053 [DOI] [PMC free article] [PubMed] [Google Scholar]
- 11. Bonovich M., Olive M., Reed E., O'Connell B., Vinson C. (2002) Adenoviral delivery of A-FOS, an AP-1 dominant negative, selectively inhibits drug resistance in two human cancer cell lines. Cancer Gene Ther. 9, 62–70 [DOI] [PubMed] [Google Scholar]
- 12. Liu P. K., Salminen A., He Y. Y., Jiang M. H., Xue J. J., Liu J. S., Hsu C. Y. (1994) Suppression of ischemia-induced fos expression and AP-1 activity by an antisense oligodeoxynucleotide to c-fos mRNA. Ann. Neurol. 36, 566–576 [DOI] [PMC free article] [PubMed] [Google Scholar]
- 13. Liu C. H., Kim Y. R., Ren J. Q., Eichler F., Rosen B. R., Liu P. K. (2007) Imaging cerebral gene transcripts in live animals. J. Neurosci. 27, 713–722 [DOI] [PMC free article] [PubMed] [Google Scholar]
- 14. Wahlestedt C., Golanov E., Yamamoto S., Yee F., Ericson H., Yoo H., Inturrisi C. E., Reis D. J. (1993) Antisense oligodeoxynucleotides to NMDA-R1 receptor channel protect cortical neurons from excitotoxicity and reduce focal ischaemic infarctions. Nature 363, 260–263 [DOI] [PubMed] [Google Scholar]
- 15. Liu C. H., Ren J. Q., Yang J., Liu C. M., Mandeville J. B., Rosen B. R., Bhide P. G., Yanagawa Y., Liu P. K. (2009) DNA-based MRI probes for specific detection of chronic exposure to amphetamine in living brains. J. Neurosci. 29, 10663–10670 [DOI] [PMC free article] [PubMed] [Google Scholar]
- 16. Strome E. M., Wheler G. H., Higley J. D., Loriaux D. L., Suomi S. J., Doudet D. J. (2002) Intracerebroventricular corticotropin-releasing factor increases limbic glucose metabolism and has social context-dependent behavioral effects in nonhuman primates. Proc. Natl. Acad. Sci. U. S. A. 99, 15749–15754 [DOI] [PMC free article] [PubMed] [Google Scholar]
- 17. Liu C. H., You Z., Ren J., Kim Y. R., Eikermann-Haerter K., Liu P. K. (2008) Noninvasive delivery of gene targeting probes to live brains for transcription MRI. FASEB J. 22, 1193–1203 [DOI] [PMC free article] [PubMed] [Google Scholar]
- 18. Liu C. H., Ren J. Q., You Z., Yang J., Liu C. M., Uppal R., Liu P. K. (2012) Noninvasive detection of neural progenitor cells in living brains by MRI. FASEB J. 26, 1652–1662 [DOI] [PMC free article] [PubMed] [Google Scholar]
- 19. Fitzgerald M. L., Xavier R., Haley K. J., Welti R., Goss J. L., Brown C. E., Zhuang D. Z., Bell S. A., Lu N., McKee M., Seed B., Freeman M. W. (2007) ABCA3 inactivation in mice causes respiratory failure, loss of pulmonary surfactant, and depletion of lung phosphatidylglycerol. J. Lipid Res. 48, 621–632 [DOI] [PubMed] [Google Scholar]
- 20. Liu C. H., D'Arceuil H. E., de Crespigny A. J. (2004) Direct CSF injection of MnCl(2) for dynamic manganese-enhanced MRI. Magn. Res. Med. 51, 978–987 [DOI] [PubMed] [Google Scholar]
- 21. Muldoon L. L., Nilaver G., Kroll R. A., Pagel M. A., Breakefield X. O., Chiocca E. A., Davidson B. L., Weissleder R., Neuwelt E. A. (1995) Comparison of intracerebral inoculation and osmotic blood-brain barrier disruption for delivery of adenovirus, herpesvirus, and iron oxide particles to normal rat brain. Am. J. Pathol. 147, 1840–1851 [PMC free article] [PubMed] [Google Scholar]
- 22. Beltinger C., Saragovi H. U., Smith R. M., LeSauteur L., Shah N., DeDionisio L., Christensen L., Raible A., Jarett L., Gewirtz A. M. (1995) Binding, uptake, and intracellular trafficking of phosphorothioate-modified oligodeoxynucleotides. J. Clin. Invest. 95, 1814–1823 [DOI] [PMC free article] [PubMed] [Google Scholar]
- 23. Zhu X. M., Wang Y. X., Leung K. C., Lee S. F., Zhao F., Wang D. W., Lai J. M., Wan C., Cheng C. H., Ahuja A. T. (2012) Enhanced cellular uptake of aminosilane-coated superparamagnetic iron oxide nanoparticles in mammalian cell lines. Int. J. Nanomed. 7, 953–964 [DOI] [PMC free article] [PubMed] [Google Scholar]
- 24. Liu C. H., Huang S., Cui J., Kim Y. R., Farrar C. T., Moskowitz M. A., Rosen B. R., Liu P. K. (2007) MR contrast probes that trace gene transcripts for cerebral ischemia in live animals. FASEB J. 21, 3004–3015 [DOI] [PMC free article] [PubMed] [Google Scholar]
- 25. Liu P. K., Mandeville J. B., Dai G., Jenkins B. G., Kim Y. R., Liu C. H. (2007) Transcription MRI: a new view of the living brain. Neuroscientist 14, 503–520 [DOI] [PubMed] [Google Scholar]
- 26. Brody S.A., Geyer M. A., Large C. H. (2003) Lamotrigine prevents ketamine but not amphetamine-induced deficits in prepulse inhibition in mice. Psychopharmacol. (Berl.) 169, 240–246 [DOI] [PubMed] [Google Scholar]
- 27. Zhang Z., Andersen A., Grondin R., Barber T., Avison R., Gerhardt G., Gash D. (2001) Pharmacological MRI mapping of age-associated changes in basal ganglia circuitry of awake rhesus monkeys. Neuroimage 14, 1159–1167 [DOI] [PubMed] [Google Scholar]
- 28. Komatsu T., Trindade L. S., Chiba T., Hayashi H., Henmi T., Ushiroda Y., Mori R., Shimokawa I. (2011) Acute stress response modified by modest inhibition of growth hormone axis: a potential machinery of the anti-aging effect of calorie restriction. Mech. Ageing Dev. 132, 103–109 [DOI] [PubMed] [Google Scholar]
- 29. Sterrenburg L., Gaszner B., Boerrigter J., Santbergen L., Bramini M., Roubos E. W., Peeters B. W., Kozicz T. (2012) Sex-dependent and differential responses to acute restraint stress of corticotropin-releasing factor-producing neurons in the rat paraventricular nucleus, central amygdala, and bed nucleus of the stria terminalis. J. Neurosci. Res. 90, 179–192 [DOI] [PubMed] [Google Scholar]
- 30. Soliman A., Udemgba C., Fan I., Xu X., Miler L., Rusjan P., Houle S., Wilson A. A., Pruessner J., Ou X. M., Meyer J. H. (2012) Convergent effects of acute stress and glucocorticoid exposure upon MAO-A in humans. J. Neurosci. 32, 17120–17127 [DOI] [PMC free article] [PubMed] [Google Scholar]